Annual Report 2011 - Hysan Development Company Limited
Annual Report 2011 - Hysan Development Company Limited
Annual Report 2011 - Hysan Development Company Limited

Create successful ePaper yourself
Turn your PDF publications into a flip-book with our unique Google optimized e-Paper software.
A BETTER<br />
FUTURE TODAY<br />
<strong>Annual</strong> <strong>Report</strong> <strong>2011</strong><br />
stock code 00014
Contents<br />
THE ESSENTIAL READ AND WHY<br />
18<br />
<strong>2011</strong> financial and<br />
non-financial performance<br />
20<br />
A year in review and 2012 outlook<br />
24<br />
<strong>2011</strong> market conditions and<br />
how <strong>Hysan</strong> responded<br />
30<br />
Results highlights including<br />
key performance indicators<br />
32<br />
Review of our core leasing segments<br />
37<br />
<strong>Report</strong> on financial position and<br />
management<br />
40<br />
Prudent treasury policy<br />
45<br />
Risk control and management<br />
48<br />
Our people, our assets<br />
56<br />
Governance structure and<br />
the Board’s work in <strong>2011</strong><br />
1<br />
Overview<br />
16 Who We Are<br />
16 Mission<br />
16 Responsible Business<br />
as the Guiding Principle<br />
17 Our Values<br />
18 <strong>2011</strong> Performance at a Glance<br />
20 Chairman’s Statement<br />
2<br />
Strategy in Action<br />
24 Our Marketplace and Our Response<br />
28 The <strong>Hysan</strong> Community –<br />
Our Investment Property Portfolio<br />
30 Management’s Discussion and Analysis<br />
30 Review of Results<br />
32 Review of Operations<br />
37 Financial Review<br />
40 Treasury Policy<br />
45 Internal Controls and Risk Management<br />
48 Human Resources<br />
3<br />
Corporate Governance<br />
52 Board of Directors and<br />
Senior Management<br />
56 Corporate Governance <strong>Report</strong><br />
73 Directors’ <strong>Report</strong><br />
81 Directors’ Remuneration<br />
and Interests <strong>Report</strong><br />
89 Audit Committee <strong>Report</strong><br />
4<br />
Financial Statements<br />
and Valuation<br />
92 Directors’ Responsibility<br />
for the Financial Statements<br />
93 Independent Auditor’s <strong>Report</strong><br />
94 Financial Statements<br />
170 Five-Year Financial Summary<br />
172 <strong>Report</strong> of the Valuer<br />
173 Schedule of Principal Properties<br />
175 Shareholding Analysis<br />
176 Shareholder Information<br />
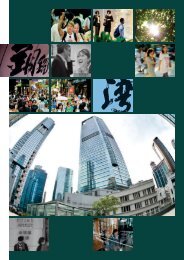
Photos on front and back covers:<br />
<strong>Hysan</strong> Place, <strong>Hysan</strong>’s next milestone
A BETTER<br />
FUTURE TODAY<br />
<strong>2011</strong> was a productive year for <strong>Hysan</strong>. Against<br />
the backdrop of continued global economic<br />
uncertainties, we delivered a sound business<br />
performance across our core leasing activities.<br />
In addition, we made good progress with<br />
our <strong>Hysan</strong> Place redevelopment project and<br />
continued to enhance our existing assets,<br />
strategically adding longer-term competitiveness<br />
to our portfolio. We shall continue to further<br />
transform <strong>Hysan</strong>’s Causeway Bay as a location<br />
of choice for both work and play.
Largest commercial landlord<br />
in vibrant Causeway Bay
Asset enhancements:<br />
Lee Theatre area at the western<br />
gateway of the <strong>Hysan</strong> community
Next milestone:<br />
<strong>Hysan</strong> Place
<strong>Hysan</strong> Place at the<br />
northern gateway of<br />
our community
Prime offices in a<br />
dynamic and green<br />
community
An energetic and<br />
unique district in<br />
further transformation
1<br />
Overview<br />
This section begins by stating who we<br />
are, in terms of our mission and core<br />
values. An at-a-glance table gives an<br />
overview of our <strong>2011</strong> financial and<br />
non-financial performances. The<br />
Chairman’s Statement reviews the<br />
year’s work, and highlights our efforts<br />
to further transform our unique<br />
district of Causeway Bay.<br />
14<br />
<strong>Hysan</strong> <strong>Annual</strong> <strong>Report</strong> <strong>2011</strong>
Overview<br />
16<br />
18<br />
20<br />
Who We Are<br />
16<br />
16<br />
17<br />
Mission<br />
Responsible Business<br />
as the Guiding Principle<br />
Our Values<br />
<strong>2011</strong> Performance<br />
at a Glance<br />
Chairman’s Statement<br />
<strong>Hysan</strong> <strong>Annual</strong> <strong>Report</strong> <strong>2011</strong> 15
Who We Are<br />
MISSION<br />
To build, own and manage quality buildings, and<br />
being the occupiers’ partner of choice in the<br />
provision of real estate accommodation and services,<br />
thereby delivering attractive and sustainable returns<br />
to our shareholders.<br />
RESPONSIBLE BUSINESS<br />
AS THE GUIDING PRINCIPLE<br />
<strong>Hysan</strong> aims to be a successful as well as<br />
responsible business. We pay attention not only to<br />
the results achieved, but also to how we deliver the<br />
same. The principle of being a responsible business<br />
is at the heart of our <strong>Company</strong>.<br />
16<br />
<strong>Hysan</strong> <strong>Annual</strong> <strong>Report</strong> <strong>2011</strong>
OUR VALUES<br />
We foster the highest business ethics and<br />
accountability. At <strong>Hysan</strong>, we take pride in our work,<br />
acknowledge responsibility for our actions and<br />
endeavour to complete our tasks in the right way.<br />
Our thought leadership applies to all strategic and<br />
operational issues in the quest to create innovative<br />
solutions through collective insight. We aim to take a<br />
market leadership position in whatever we do.<br />
<strong>Hysan</strong> maintains long-term and mutually beneficial<br />
partnerships with our shareholders, clients, business<br />
partners, employees and the community.<br />
We take responsibility by giving back to the<br />
community. This is achieved through everyday<br />
business operations as well as active participation in<br />
community activities.<br />
Overview<br />
Strategy in Action Corporate Governance Financial Statements and Valuation<br />
<strong>Hysan</strong> <strong>Annual</strong> <strong>Report</strong> <strong>2011</strong><br />
17
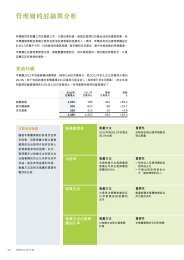
<strong>2011</strong> Performance<br />
at a Glance<br />
FINANCIAL PERFORMANCE<br />
With a clear focus and strategic actions, we continued to<br />
achieve results in a fast-changing business environment. It<br />
is also important that we do things the right way. Key<br />
financial and non-financial performance indicators are set<br />
out below.<br />
Turnover<br />
HK$1,922m<br />
9.0%<br />
11<br />
10<br />
09<br />
08<br />
07<br />
Office Sector’s Revenue<br />
HK$820m 6.5%<br />
820<br />
770<br />
747<br />
720<br />
584<br />
0 200 400 600 800 1,000<br />
(HK$ million)<br />
• Occupancy at 96%<br />
• Overall positive rental reversion<br />
• Flagship Lee Gardens achieved rentals<br />
exceeding 2008 peak and set rental tone<br />
for new <strong>Hysan</strong> Place pre-leasing<br />
11<br />
10<br />
09<br />
08<br />
07<br />
Retail Sector’s Revenue<br />
HK$789m 12.7%<br />
789<br />
700<br />
648<br />
626<br />
522<br />
0 100 200 300 400 500 600 700 800<br />
(HK$ million)<br />
• Virtually fully-let<br />
• Significant rise of turnover rent by 64.8% to<br />
HK$89 million<br />
• Mainland tourist spending increased by 84%<br />
in The Lee Gardens and Lee Gardens Two<br />
shopping centres<br />
11<br />
10<br />
09<br />
08<br />
07<br />
0 50<br />
(HK$ million)<br />
Recurring Underlying Profit<br />
Recurring Underlying Profit<br />
HK$1,310m 14.1%<br />
Recurring Underlying Earnings per Share<br />
HK123.92cents 13.5%<br />
HK$1,310m<br />
14.1%<br />
11<br />
10<br />
09<br />
08<br />
07<br />
1,310<br />
1,148<br />
1,110<br />
1,066<br />
950<br />
0 300 600 900 1,200 1,500<br />
(HK$ million)<br />
11<br />
10<br />
09<br />
08<br />
07<br />
123.92<br />
109.15<br />
106.09<br />
102.57<br />
90.32<br />
0 30 60 90 120 150<br />
(HK cents)<br />
11<br />
10<br />
09<br />
08<br />
07<br />
0 10<br />
(HK cents)<br />
• Increase reflects improvements in gross<br />
profit generated from core leasing<br />
activities and higher investment income<br />
• Being Recurring Underlying Profit divided<br />
by weighted average number of ordinary<br />
shares for the purpose of basic earnings<br />
per share<br />
Net Asset Value per Share<br />
HK$46.00<br />
19.1%<br />
11<br />
10<br />
09<br />
08<br />
07<br />
Property Value<br />
HK$49,969m 22.4%<br />
49,969<br />
40,833<br />
37,363<br />
35,850<br />
35,711<br />
11<br />
10<br />
09<br />
08<br />
07<br />
Shareholders’ Funds<br />
HK$48,753m 19.9%<br />
48,753<br />
40,677<br />
37,216<br />
34,811<br />
35,214<br />
11<br />
10<br />
09<br />
08<br />
07<br />
0 10,000 20,000 30,000 40,000 50,000<br />
(HK$ million)<br />
Valuation Surplus Cost<br />
0 10,000 20,000 30,000 40,000 50,000<br />
(HK$ million)<br />
0<br />
(HK$)<br />
10<br />
• Investment property portfolio valued by an<br />
independent professional valuer, on the<br />
basis of open market value<br />
• Valuation reflects improved rental rates as<br />
well as the increase in site value of and<br />
construction costs expended on <strong>Hysan</strong><br />
Place, which is near completion<br />
• Increase mainly due to a rise in valuation<br />
of investment properties<br />
18<br />
<strong>Hysan</strong> <strong>Annual</strong> <strong>Report</strong> <strong>2011</strong>
NON-FINANCIAL PERFORMANCE<br />
789<br />
700<br />
48<br />
6<br />
600 700 800<br />
.92<br />
120 150<br />
48,753<br />
77<br />
40,000 50,000<br />
11<br />
10<br />
09<br />
08<br />
07<br />
11<br />
10<br />
09<br />
08<br />
07<br />
11<br />
10<br />
09<br />
08<br />
07<br />
Residential Sector’s Revenue<br />
HK$313m 6.5%<br />
313<br />
294<br />
285<br />
292<br />
262<br />
0 50 100 150 200 250 300 350<br />
(HK$ million)<br />
• Occupancy at 95%<br />
• Selective refurbished units at Bamboo<br />
Grove set pricing benchmark above 2008<br />
market peak<br />
• Further enhanced tenant relations resulted<br />
in high tenant retention and increase in<br />
direct deals<br />
Dividends per Share<br />
HK79cents 6.8%<br />
79<br />
74<br />
68<br />
68<br />
60<br />
0 10 20 30 40 50 60 70 80<br />
(HK cents)<br />
• Recommended the payment of a final<br />
dividend of HK64 cents per share<br />
• Together with the interim dividend of<br />
HK15 cents, an aggregate distribution of<br />
HK79 cents per share<br />
Net Asset Value per Share<br />
HK$46.00 19.1%<br />
46.00<br />
38.61<br />
35.42<br />
33.44<br />
33.94<br />
0 10 20 30 40 50<br />
(HK$)<br />
• Being shareholders’ funds divided by<br />
number of issued shares at year-end<br />
Governance<br />
• Recognition by industry for excellence in corporate<br />
governance:<br />
• Platinum Award (Non-Hang Seng Index Large Market<br />
Capitalisation Category) in the Hong Kong Institute<br />
of Certified Public Accountants’ Best Corporate<br />
Governance Disclosure Awards <strong>2011</strong>, which was<br />
<strong>Hysan</strong>’s ninth Best Corporate Governance<br />
Disclosure Award since 2000<br />
• Outstanding Corporate Governance in Greater China<br />
and Top 5 Corporate Governance in Asia/Pacific in<br />
the IR Global Rankings <strong>2011</strong><br />
Environment<br />
• <strong>Hysan</strong> Place project on track as Hong Kong’s first<br />
building to be certified by United States Green Building<br />
Council’s Leadership in Energy and Environmental<br />
Design standard (LEED) at its highest platinum level<br />
• <strong>Hysan</strong>’s long-term sustainable approach to the<br />
development of Causeway Bay as well as its <strong>Hysan</strong><br />
Place project recognised for “Best Practices in Green<br />
Organisation <strong>Development</strong>” in the Best Practice<br />
Awards <strong>2011</strong> organised by Best Practice Management<br />
Group<br />
Community<br />
• Constituent member of Dow Jones Sustainability Index,<br />
FTSE4Good Index, and Hang Seng Corporate<br />
Sustainability Index, three of the best known indices to<br />
track responsible business practices around the world<br />
• Awarded the 5 Years Plus Caring <strong>Company</strong> Logo by The<br />
Hong Kong Council of Social Service in recognition of<br />
<strong>Hysan</strong>’s efforts in promoting corporate social<br />
responsibility<br />
Overview<br />
Strategy in Action Corporate Governance Financial Statements and Valuation<br />
<strong>Hysan</strong> <strong>Annual</strong> <strong>Report</strong> <strong>2011</strong><br />
19
Chairman’s Statement<br />
Overview<br />
The Hong Kong economy expanded strongly in the first quarter of <strong>2011</strong>. This was followed by<br />
more moderate growth during the remaining part of <strong>2011</strong>, principally attributable to weakened<br />
exports in light of increased uncertainties in the global economic environment. Nevertheless,<br />
domestic demand remained robust on the back of favourable labour market conditions and<br />
strength in inbound tourism. Strong consumption momentum continued to fuel growth in the<br />
retail leasing market. For the Grade “A” office leasing market, tight supply offered support<br />
amidst slowing new demand.<br />
Business Performance<br />
Against this backdrop, <strong>Hysan</strong> recorded a satisfactory performance in <strong>2011</strong> with revenue growth<br />
across our entire core leasing business. The Group’s <strong>2011</strong> turnover was HK$1,922 million, up<br />
9.0% from HK$1,764 million in 2010. The retail sector showed a growth of 12.7%, while both<br />
the office and residential sectors recorded an increase of 6.5%. The retail sector was virtually<br />
fully-let. Occupancy of office and residential sectors at year-end <strong>2011</strong> stood at 96% and 95%<br />
respectively.<br />
Recurring Underlying Profit, the key measurement of our core leasing business performance,<br />
was up 14.1% to HK$1,310 million (2010: HK$1,148 million), reflecting improvement in gross<br />
profit generated from our core leasing activities. Higher investment income was also recorded.<br />
Our Underlying Profit, which excludes unrealised changes in fair value of investment properties,<br />
was also HK$1,310 million (2010: HK$1,148 million). Basic earnings per share based on<br />
Recurring Underlying Profit correspondingly rose to HK123.92 cents (2010: HK109.15 cents).<br />
At year-end <strong>2011</strong>, the external valuation of the Group’s investment property portfolio increased<br />
by 22.4% to HK$49,969 million (2010: HK$40,833 million), reflecting improved rental rates<br />
for our core portfolio as well as the increase in site value of and construction costs expended<br />
on <strong>Hysan</strong> Place, which is near completion. Taking into consideration the fair value change of<br />
investment properties, the Group’s <strong>Report</strong>ed Profit for <strong>2011</strong> was HK$8,545 million (2010:<br />
HK$3,844 million). Shareholders’ Funds increased by 19.9% to HK$48,753 million (2010:<br />
HK$40,677 million).<br />
Our financial position remains strong, with net interest coverage of 12.3 times (2010:<br />
14.0 times) and net debt to equity ratio of 7.6% (2010: 6.4%).<br />
The Board of Directors (the “Board”) recommends the payment of a final dividend of<br />
HK64 cents per share (2010: HK60 cents). Together with the interim dividend of HK15 cents<br />
per share (2010: HK14 cents), there is an aggregate distribution of HK79 cents per share,<br />
representing a year-on-year increase of 6.8%. Subject to shareholder approval, the final<br />
dividend will be payable in cash with a scrip dividend alternative.<br />
20<br />
<strong>Hysan</strong> <strong>Annual</strong> <strong>Report</strong> <strong>2011</strong>
Further Transformation of <strong>Hysan</strong>’s Causeway Bay<br />
The Group’s sound performance in year <strong>2011</strong> was complemented by the good progress of our<br />
major redevelopment project, <strong>Hysan</strong> Place, at the northern gateway of our hub. <strong>Hysan</strong> Place will<br />
bring significant strategic value to our portfolio. Its retail mall, scheduled for opening in August<br />
2012, represents a 50% increase in our portfolio’s retail gross floor area, and will bring many new<br />
attractions to Hong Kong’s most vibrant retail district of Causeway Bay. <strong>Hysan</strong> Place’s top quality<br />
office space will also strengthen our Grade “A” office hub positioning. It is Hong Kong’s first<br />
platinum LEED (Leadership in Energy and Environmental Design) building, also reflecting the<br />
Group’s strong commitment to sustainability.<br />
In <strong>2011</strong>, we also successfully made enhancements to our assets in the Lee Theatre area at the<br />
western gateway of our hub. The first phase has been completed with the relaunch of Leighton<br />
Centre, bringing in new retail outlets of international top brands, and the opening of a major<br />
flagship store at One <strong>Hysan</strong> Avenue. We shall carry these efforts through with the rejuvenation of<br />
Lee Theatre Plaza in 2012.<br />
Moving forward, we will devote further efforts to promote the unique brand character of our hub in<br />
Causeway Bay, and to strengthen its recognition and appeal as a sustainable community and a<br />
location of choice for both work and play.<br />
Board and People<br />
The year <strong>2011</strong> marked my first year as Chairman. I am honoured to join <strong>Hysan</strong>’s team to deliver<br />
value for our shareholders, clients and stakeholders. My new executive capacity, and the<br />
appointment of Mr. Siu Chuen LAU as Non-executive Deputy Chairman, both take effect on<br />
8 March 2012, further reflect the founding Lee family’s strong commitment to the future success<br />
of the Group.<br />
I would like to take this opportunity to express my heartfelt thanks to Sir David AKERS-JONES, who<br />
stepped down during the year after having served the Board for more than 20 years, including as our<br />
Independent non-executive Chairman. He has made invaluable contribution to <strong>Hysan</strong> with his<br />
capable leadership over the years, and by guiding the Board through its continuing renewal process.<br />
I am grateful for the strong guidance and support of all Board members. They have brought with<br />
them diverse professional experiences and expertise that contribute to the strength of the Board.<br />
My special thanks to Dr. Deanna Ruth Tak Yung RUDGARD who stepped down from the Board last<br />
May, after having served the Board for over 18 years. We are grateful for her guidance and the<br />
wise counsel she provided to the Board throughout the years.<br />
<strong>Hysan</strong> has made enormous progress this year. On behalf of the Board, I would like to thank our<br />
management team and staff for their contribution and hard work.<br />
Outlook<br />
The local economy is not immune to the impact of the global economic uncertainties. However,<br />
Hong Kong’s economic fundamentals are expected to remain sound. The overall retail market is<br />
expected to remain resilient and should benefit our retail leasing business. Tight supply of new<br />
Grade “A” office space in core locations should provide support to our office leasing business. In<br />
this light, <strong>Hysan</strong>’s more balanced core office and retail portfolio should look forward to continuing<br />
steady performance in 2012.<br />
The launch of <strong>Hysan</strong> Place at the northern gateway of our hub is strategic to the Group’s long-term<br />
growth. It is being followed by the rejuvenation of the Lee Theatre Plaza hub at our western<br />
gateway, adding long-term competitiveness to our portfolio. By creating a new destination and new<br />
surroundings in Causeway Bay, we will continue to contribute to the further transformation of an<br />
energetic and unique district.<br />
Irene Yun Lien LEE<br />
Chairman<br />
Hong Kong, 8 March 2012<br />
Overview<br />
Strategy in Action Corporate Governance Financial Statements and Valuation<br />
<strong>Hysan</strong> <strong>Annual</strong> <strong>Report</strong> <strong>2011</strong><br />
21
2<br />
Strategy in Action<br />
This section starts with an overview<br />
of Hong Kong’s macroeconomic<br />
environment and property leasing<br />
markets in <strong>2011</strong>, followed by <strong>Hysan</strong>’s<br />
strategic actions in response to the<br />
market developments. We then<br />
discuss in detail our operations and<br />
performances, finance, risks and<br />
people management during the year.<br />
22<br />
<strong>Hysan</strong> <strong>Annual</strong> <strong>Report</strong> <strong>2011</strong>
24<br />
28<br />
30<br />
45<br />
48<br />
Our Marketplace<br />
and Our Response<br />
The <strong>Hysan</strong> Community –<br />
Our Investment Property Portfolio<br />
Management’s Discussion<br />
and Analysis<br />
30<br />
32<br />
37<br />
40<br />
Review of Results<br />
Review of Operations<br />
Financial Review<br />
Treasury Policy<br />
Internal Controls<br />
and Risk Management<br />
Human Resources<br />
Strategy in Action<br />
<strong>Hysan</strong> <strong>Annual</strong> <strong>Report</strong> <strong>2011</strong> 23
Our Marketplace<br />
and Our Response<br />
In <strong>2011</strong>, uncertain global economic environment set the<br />
backdrop for the property leasing market in Hong Kong.<br />
Our three leasing segments responded successfully to<br />
such market changes.<br />
Hong Kong Economy<br />
The Hong Kong economy recorded a moderate GDP<br />
growth of 5% in <strong>2011</strong>. The growth moderation was mainly<br />
caused by a slowdown in exports since the second<br />
quarter of <strong>2011</strong> amid a worsening global economic<br />
environment. Domestic consumption nevertheless<br />
displayed remarkable resilience throughout the year,<br />
thereby rendering a strong cushion to overall economic<br />
performance. Total employment in Hong Kong rose to 3.7<br />
million as of December <strong>2011</strong>, while the unemployment<br />
rate fell to 3.3%. Inflation rate was 5.3% in <strong>2011</strong>.<br />
The Hong Kong economy recorded a moderate GDP growth in <strong>2011</strong><br />
Office<br />
The Grade “A” office market started strongly with buoyant<br />
demand in the first half of <strong>2011</strong>. However, concerns over<br />
the growing global economic uncertainties led to slowing<br />
new demand and expansion activities since mid-year.<br />
New Grade “A” office supply* totalled 1.6 million square<br />
feet in <strong>2011</strong>. The majority of space was located in<br />
decentralised areas. Such a new supply level was<br />
considerably lower than that in 2008 (3.7 million square<br />
feet), which then coincided with reduced demand amidst<br />
the global financial crisis. Overall net take-up* in Hong<br />
Kong amounted to 2.0 million square feet in the year.<br />
Decentralised Kowloon East recorded a significant netabsorption.<br />
Among the core districts (Central, Causeway Bay/<br />
Wanchai and Tsim Sha Tsui), Causeway Bay/Wanchai was the<br />
largest contributor with a positive net take-up of around<br />
160,000 square feet.<br />
Despite a slowdown in new demand and expansion activities,<br />
the market saw considerable demand from companies<br />
seeking cost-saving relocation opportunities – especially those<br />
from Central – to more affordable options in other submarkets<br />
as mentioned above. At the end of December <strong>2011</strong>,<br />
the overall vacancy rate in Causeway Bay/Wanchai fell to<br />
1.9%. The graph on the right shows the vacancy rate of Grade<br />
“A” office in Central, Causeway Bay/Wanchai, Tsim Sha Tsui<br />
and Kowloon East for both 2010 and <strong>2011</strong>.<br />
All Grade “A” office sub-markets witnessed double-digit rental<br />
growth in <strong>2011</strong>. Recording an annual rental growth of 20.2%,<br />
Causeway Bay/Wanchai outperformed the other two core<br />
districts, namely Central (10.2%) and Tsim Sha Tsui (19.2%).<br />
During the last quarter, Central rental levels fell by 4.5%.<br />
Rents in Causeway Bay/Wanchai fell by 1.1%, while those of<br />
Tsim Sha Tsui grew by 2.4%. It should be noted that the rental<br />
gap between Causeway Bay/Wanchai and Central remained<br />
wide during the year (see the graph on the right).<br />
<strong>Hysan</strong>’s office portfolio maintains a balanced tenant mix<br />
* The new supply and net take-up figures in <strong>2011</strong> exclude Hong Kong<br />
Government Headquarters in Admiralty.<br />
Source: Jones Lang LaSalle (data as of March 2012)<br />
24<br />
<strong>Hysan</strong> <strong>Annual</strong> <strong>Report</strong> <strong>2011</strong>
6%<br />
4%<br />
Real Gross Domestic Product*<br />
Year-on-Year % Change<br />
8%<br />
6.4%<br />
1,629<br />
1,667<br />
7.0%<br />
1,737<br />
1,823<br />
5.0%<br />
Year-on-Year % Change<br />
1,623<br />
8%<br />
2%<br />
2.3%<br />
1,823<br />
7.0%<br />
6% 6.4%<br />
0%<br />
07 08 09 10 11<br />
1,667<br />
1,737 5.0%<br />
4% 1,629<br />
-2%<br />
-2.6%<br />
1,623<br />
2%<br />
-4%<br />
0%<br />
15%<br />
-2%<br />
10%<br />
-4%<br />
5%<br />
15%<br />
0%<br />
10%<br />
5%<br />
Grade “A” Office Vacancy Rate<br />
3.0%<br />
3.6%<br />
Central<br />
Grade “A” Office Rental Value<br />
0%<br />
HK$ per Square Central Foot<br />
120<br />
110<br />
100<br />
90<br />
80<br />
HK$ 70 per Square Foot<br />
120<br />
60<br />
110<br />
50<br />
100<br />
40<br />
90<br />
30<br />
Real Gross Domestic Product*<br />
3.0%<br />
2.3%<br />
07 08 09 10 11<br />
3.6%<br />
-2.6%<br />
Grade “A” Office Vacancy Rate<br />
10.8%<br />
9.0%<br />
4.1%<br />
3.0% 2.9%<br />
1.9%<br />
Causeway Bay/<br />
Wanchai<br />
3.0%<br />
1.9%<br />
Tsim Sha Tsui<br />
4.1%<br />
2.9%<br />
10.8% Kowloon East<br />
9.0%<br />
2010 <strong>2011</strong><br />
Causeway Bay/<br />
Wanchai<br />
Grade “A” Office Rental Value<br />
Tsim Sha Tsui<br />
80<br />
20<br />
70Q1 Q2 Q3 Q4 Q1 Q2 Q3 Q4 Q1 Q2 Q3 Q4 Q1 Q2 Q3 Q4 Q1 Q2 Q3 Q4<br />
60<br />
50<br />
40<br />
07 08 09 10 11<br />
Central Causeway Bay/Wanchai<br />
30 Source: Jones Lang LaSalle (data as of March 2012)<br />
Kowloon East<br />
07 08 09 10 11<br />
Central Causeway Bay/Wanchai<br />
Source: Jones Lang LaSalle (data as of March 2012)<br />
2010 <strong>2011</strong><br />
HK$ billion<br />
1,900<br />
1,800<br />
1,700<br />
1,600<br />
HK$ billion<br />
1,900<br />
1,500<br />
20<br />
Q1 Q2 Q3 Q4 Q1 Q2 Q3 Q4 Q1 Q2 Q3 Q4 Q1 Q2 Q3 Q4 Q1 Q2 Q3 Q4<br />
1,800<br />
1,400<br />
1,700<br />
1,300<br />
1,600<br />
1,200<br />
1,500<br />
1,400<br />
1,300<br />
1,200<br />
Year-on-Year % Change<br />
Gross Domestic Product<br />
* In chained (2009) dollars<br />
Source: Census and Statistics Department<br />
(data as of March 2012)<br />
Year-on-Year % Change<br />
Gross Domestic Product<br />
* In chained (2009) dollars<br />
Source: Census and Statistics Department<br />
(data as of March 2012)<br />
<strong>Hysan</strong>’s Response<br />
We concluded negotiations of a vast<br />
majority of <strong>2011</strong> expiring leases<br />
during the first half of the year,<br />
capitalising on the buoyant market<br />
environment. We achieved positive<br />
rental reversion as a whole, also<br />
supported by our strengthened<br />
marketing activities.<br />
The rental level of The Lee Gardens<br />
climbed above the peak of 2008,<br />
setting the rental tone for the<br />
pre-leasing of <strong>Hysan</strong> Place.<br />
We maintained a balanced tenant<br />
mix with no undue dependence on<br />
any particular industry segment.<br />
With tight supply of quality office<br />
space in core locations, our office<br />
portfolio in Causeway Bay, offering<br />
good cost advantage versus other<br />
core areas, remains attractive to<br />
tenants.<br />
See Review of Operations on Office Sector on pages<br />
32-33 for more details.<br />
Overview<br />
Strategy in Action Corporate Governance Financial Statements and Valuation<br />
<strong>Hysan</strong> <strong>Annual</strong> <strong>Report</strong> <strong>2011</strong> 25
Our Marketplace<br />
and Our Response<br />
Retail<br />
Overall annual retail sales in Hong Kong remained buoyant during the year, with an increase of<br />
24.9% in <strong>2011</strong> over the previous year (see the graph below).<br />
Consumer confidence remained high, with private consumption expenditure rising by 8.6% in <strong>2011</strong>.<br />
Retailers continued to benefit from the influx of Mainland visitors in Hong Kong. In <strong>2011</strong>, Mainland<br />
arrivals hit 28.1 million, accounting for 67.0% of the total arrivals in the year (see the graph below).<br />
In terms of new supply, two major retail developments were completed in <strong>2011</strong>. They are located in<br />
Kowloon and the New Territories. Rents for premium prime shopping centres rose by 16.1% in<br />
<strong>2011</strong>.<br />
Hong Kong Total Retail Sales<br />
HK$ billion<br />
450<br />
400<br />
350<br />
300<br />
273<br />
275<br />
247<br />
250<br />
12.8%<br />
10.6%<br />
200<br />
150<br />
0.6%<br />
325<br />
18.3%<br />
406<br />
24.9%<br />
30%<br />
25%<br />
20%<br />
15%<br />
10%<br />
5%<br />
Million<br />
50<br />
40<br />
30<br />
20<br />
10<br />
Total Number of Visitors<br />
28<br />
45.0%<br />
55.0%<br />
30 30<br />
42.9% 39.3%<br />
57.1%<br />
60.7%<br />
36<br />
37.0%<br />
63.0%<br />
42<br />
33.0%<br />
67.0%<br />
100<br />
07 08 09 10 11<br />
0<br />
0<br />
07 08 09 10 11<br />
Total Retail Sales<br />
Year-on-Year % Change<br />
Number of Other Visitors<br />
Number of Mainland China Visitors<br />
Source: Census and Statistics Department (data as of March 2012) Source: Hong Kong Tourism Board (data as of March 2012)<br />
Luxury Residential<br />
During the first half of the year, the luxury residential<br />
leasing market was characterised by a positive market<br />
sentiment on the back of increasing new expatriate<br />
arrivals. However, the market was affected by sluggish<br />
corporate expansion activity in the second half of the year,<br />
especially in the financial sector. It has resulted in reduced<br />
new demand for luxury residential leasing for expatriate staff.<br />
Leasing activity was mainly driven by local relocations as<br />
some expatriates embarked on cost-saving exercises.<br />
Rents for luxury properties edged down marginally by less<br />
than 1% in the second half of <strong>2011</strong> after rising by about 5% in<br />
the first half. Overall, luxury residential rents increased by<br />
4.4% in <strong>2011</strong> but were still below the market highs of 2008<br />
(see the graph on the right).<br />
Social and cultural activities in our Bamboo Grove help build a thriving<br />
community for residents<br />
26<br />
<strong>Hysan</strong> <strong>Annual</strong> <strong>Report</strong> <strong>2011</strong>
Index<br />
140<br />
130<br />
120<br />
110<br />
100<br />
90<br />
80<br />
Q1 Q2 Q3 Q4 Q1 Q2 Q3 Q4 Q1 Q2 Q3 Q4 Q1 Q2 Q3 Q4 Q1 Q2 Q3 Q4<br />
Index<br />
135<br />
130<br />
125<br />
120<br />
115<br />
110<br />
105<br />
100<br />
95<br />
The renovated retail podium at Leighton Centre has<br />
become a trendy shopping venue<br />
Premium Prime Shopping Centre Rental Index<br />
(2009 Q4=100)<br />
07 08 09 10 11<br />
Source: Jones Lang LaSalle (data as of March 2012)<br />
Luxury Residential Rental Index (2009 Q4=100)<br />
90<br />
Q1 Q2 Q3 Q4 Q1 Q2 Q3 Q4 Q1 Q2 Q3 Q4 Q1 Q2 Q3 Q4 Q1 Q2 Q3 Q4<br />
07 08 09 10 11<br />
Source: Jones Lang LaSalle (data as of March 2012)<br />
<strong>Hysan</strong>’s Response<br />
Riding on strong private consumption<br />
and inbound tourism, our retail<br />
portfolio recorded a sound growth.<br />
We captured market opportunities by<br />
reinforcing the luxury positioning of<br />
the Lee Gardens hub and rejuvenating<br />
the trendy Lee Theatre hub.<br />
Our marketing strategies include<br />
strengthening our customer base and<br />
loyalty of shoppers and launching<br />
promotion activities to attract tourists.<br />
See Review of Operations on Retail Sector on page 34<br />
for more details.<br />
<strong>Hysan</strong>’s Response<br />
In a changing market, we focused on<br />
optimising occupancy to maximise<br />
revenue.<br />
At the same time, we enhanced our<br />
facilities and services. Refurbishment<br />
of selected units successfully<br />
established a new pricing benchmark,<br />
surpassing the peak of 2008.<br />
We also strengthened tenant<br />
relations and our direct marketing<br />
initiatives.<br />
See Review of Operations on Residential Sector on<br />
page 35 for more details.<br />
Overview<br />
Strategy in Action Corporate Governance Financial Statements and Valuation<br />
<strong>Hysan</strong> <strong>Annual</strong> <strong>Report</strong> <strong>2011</strong> 27
The <strong>Hysan</strong><br />
Community –<br />
Our Investment<br />
Property Portfolio<br />
Our investment property interests totaled some 3.8 million<br />
gross square feet of high quality office, retail and residential<br />
space in Hong Kong. <strong>Hysan</strong> Place at 500 Hennessy Road,<br />
currently under redevelopment, will add an additional<br />
710,000 square feet to our portfolio upon its completion in<br />
2012.<br />
HYSAN PLACE<br />
500 Hennessy Road, Causeway Bay<br />
<strong>Hysan</strong> Place, formerly the Hennessy Centre, is <strong>Hysan</strong>’s major<br />
redevelopment project with its shopping mall opening in August 2012.<br />
It includes 15 floors of Grade “A” offices and 17 floors of retail outlets.<br />
Situated at the northern gateway of <strong>Hysan</strong>’s portfolio and the heart of<br />
bustling Causeway Bay, <strong>Hysan</strong> Place offers full harbour view offices, a<br />
shopping mall of exciting tenant mix and green building features that<br />
conform to the highest international sustainability standards.<br />
Estimated Total Gross Floor Area Approx. 710,000 ft 2<br />
See page 36 for more details<br />
Shopping Mall<br />
Opening<br />
August 2012<br />
BAMBOO<br />
GROVE<br />
HENNESSY<br />
ROAD<br />
SOGO<br />
HYSAN<br />
PLACE<br />
CROSS<br />
HARBOUR<br />
TUNNEL<br />
GRADE “A”<br />
OFFICES<br />
LEE GARDENS<br />
RETAIL HUB<br />
RESIDENTIAL<br />
LEE THEATRE<br />
RETAIL HUB<br />
NORTH<br />
POINT<br />
Mid-Levels<br />
YUN PING ROAD<br />
CENTRAL<br />
Times Square<br />
PERCIVAL STREET<br />
LEE THEATRE<br />
PLAZA<br />
LEIGHTON<br />
CENTRE<br />
LEE GARDEN ROAD<br />
ONE HYSAN<br />
AVENUE<br />
HYSAN AVENUE<br />
LEIGHTON ROAD<br />
THE LEE<br />
GARDENS<br />
SUNNING<br />
PLAZA<br />
LEE GARDENS<br />
TWO<br />
18 HYSAN<br />
AVENUE<br />
SUNNING<br />
COURT<br />
111<br />
LEIGHTON<br />
ROAD<br />
ABERDEEN<br />
TUNNEL<br />
Not to scale<br />
Not to scale<br />
OFFICE<br />
Our office portfolio’s Grade “A” offices provide a core location with<br />
premium facilities and prestige for tenants and their clients. <strong>Hysan</strong><br />
Place will further strengthen our Grade “A” office positioning with<br />
its world-class building specifications. Other office buildings<br />
provide quality office space for tenants’ diversified use.<br />
RETAIL<br />
The Lee Gardens hub provides elegant and luxury premium retail<br />
spaces for high-end brands, while the Lee Theatre hub is home to<br />
stylish and chic lifestyle shops and renowned restaurants. <strong>Hysan</strong><br />
Place represents an increase of 50% by gross floor area to our overall<br />
retail portfolio, offering a new and exciting shopping destination with<br />
international brands new to Hong Kong.<br />
28<br />
<strong>Hysan</strong> <strong>Annual</strong> <strong>Report</strong> <strong>2011</strong>
THE LEE GARDENS<br />
33 <strong>Hysan</strong> Avenue, Causeway Bay<br />
The Lee Gardens is the Group’s flagship<br />
property comprising an office tower and a<br />
high-end shopping centre. The development,<br />
close to the MTR Causeway Bay station,<br />
enjoys spectacular views of the Harbour and<br />
Happy Valley and is home to many<br />
international corporations, luxury fashion<br />
brands and renowned restaurants.<br />
Approx. Gross Floor Area 900,000 ft 2<br />
\ Number of Floors 53 \ Parking Spaces 200<br />
\ Completed 1997<br />
LEE THEATRE PLAZA<br />
99 Percival Street, Causeway Bay<br />
Like its predecessor, Lee Theatre, the Lee<br />
Theatre Plaza is a Hong Kong landmark, being<br />
one of the city’s best known shopping and<br />
dining complexes, housing many of the world’s<br />
most famous lifestyle brands and restaurants.<br />
Approx. Gross Floor Area 317,000 ft 2<br />
\ Number of Floors 26 \ Completed 1994<br />
Overview<br />
LEE GARDENS TWO<br />
28 Yun Ping Road, Causeway Bay<br />
Lee Gardens Two is an office and retail<br />
complex. The complex is conveniently linked<br />
to the neighbouring The Lee Gardens and is<br />
home to many international corporations,<br />
luxury fashion brands, renowned restaurants<br />
and a children’s concept floor.<br />
Approx. Gross Floor Area 627,000 ft 2<br />
\ Number of Floors 34 \ Parking Spaces 176<br />
\ Completed 1992 \ Renovation of retail podium 2003<br />
SUNNING PLAZA<br />
10 <strong>Hysan</strong> Avenue, Causeway Bay<br />
Designed by the renowned architect I.M. Pei,<br />
Sunning Plaza greets tenants and visitors with<br />
a spacious entrance and lift lobby. Among its<br />
retail tenants are popular food and beverage<br />
outlets, which have established the plaza as a<br />
hub for relaxation and social recreation.<br />
Approx. Gross Floor Area 277,000 ft 2<br />
\ Number of Floors 30 \ Parking Spaces 150 (jointly<br />
owned with Sunning Court) \ Completed 1982<br />
18 HYSAN AVENUE<br />
18 <strong>Hysan</strong> Avenue, Causeway Bay<br />
18 <strong>Hysan</strong> Avenue, formerly known as AIA<br />
Plaza, is a 25-level office and retail complex at<br />
the corner of <strong>Hysan</strong> Avenue. The building<br />
boasts a bright and spacious lobby.<br />
Approx. Gross Floor Area 132,000 ft 2<br />
\ Number of Floors 25 \ Completed 1989<br />
\ Renovated 2009<br />
111 LEIGHTON ROAD<br />
111 Leighton Road, Causeway Bay<br />
Located in a pleasant and quieter area in the<br />
heart of Causeway Bay, 111 Leighton Road is<br />
an ideal office location offering convenience as<br />
well as privacy. The retail shops include some<br />
trend-setting stores.<br />
Approx. Gross Floor Area 80,000 ft 2<br />
\ Number of Floors 24 \ Completed 1988<br />
\ Renovated 2004<br />
LEIGHTON CENTRE<br />
77 Leighton Road, Causeway Bay<br />
This office and retail complex enjoys close<br />
proximity to all forms of public transport. Its<br />
central location in the Causeway Bay area<br />
makes it a much sought-after address. Its<br />
completed renovation in <strong>2011</strong> has given a<br />
fresh look to its office lobby, while the retail<br />
podium has become a stylish shopping venue<br />
of international brands.<br />
Approx. Gross Floor Area 430,000 ft 2<br />
\ Number of Floors 28 \ Parking Spaces 264<br />
\ Completed 1977 \ Renovated <strong>2011</strong><br />
ONE HYSAN AVENUE<br />
1 <strong>Hysan</strong> Avenue, Causeway Bay<br />
Located at the junction of three busy streets<br />
in the heart of Causeway Bay, this office and<br />
retail complex enjoys a prime location with a<br />
variety of retail facilities in the surrounding<br />
area.<br />
Approx. Gross Floor Area 169,000 ft 2<br />
\ Number of Floors 26 \ Completed 1976<br />
\ Renovated 2002<br />
BAMBOO GROVE<br />
74–86 Kennedy Road, Mid-Levels<br />
A luxury residential complex in the Mid-Levels,<br />
Bamboo Grove commands panoramic views of<br />
the harbour and the greenery of the Peak, and<br />
is well served by a multitude of public<br />
transport. In addition to superb property<br />
management services and full club-house and<br />
sports facilities, tenants also enjoy<br />
personalised resident services that help<br />
ensure a comfortable stay.<br />
Approx. Gross Floor Area 691,000 ft 2<br />
\ Number of Units 345 \ Parking Spaces 436<br />
\ Completed 1985 \ Renovated 2002<br />
SUNNING COURT<br />
8 Hoi Ping Road, Causeway Bay<br />
The Sunning Court is a unique residential<br />
tower in the dynamic Causeway Bay area.<br />
Located in a pleasant environment with treelined<br />
streets, and within easy reach of all<br />
forms of relaxation and entertainment in the<br />
surrounding district, the building provides<br />
maximum comfort for its tenants.<br />
Approx. Gross Floor Area 98,000 ft 2<br />
\ Number of Units 59 \ Parking Spaces 150 (jointly<br />
owned with Sunning Plaza) \ Completed 1982<br />
\ Renovated 2003<br />
Strategy in Action Corporate Governance Financial Statements and Valuation<br />
Note: The Approximate Gross Floor Areas shown above are based on accountable gross floor area of the relevant building and rounded to the nearest 1,000 ft 2 .<br />
<strong>Hysan</strong> <strong>Annual</strong> <strong>Report</strong> <strong>2011</strong> 29
Management’s Discussion<br />
and Analysis<br />
<strong>Hysan</strong> is principally engaged, together with its subsidiaries and associates, in investment,<br />
development and management of quality properties in prime locations, and the Group’s<br />
turnover and results are primarily derived from leasing of investment properties located in Hong<br />
Kong. Throughout the year, our investment property interests totaled some 3.8 million gross<br />
square feet of high-quality office, retail and residential space in Hong Kong, excluding <strong>Hysan</strong><br />
Place at 500 Hennessy Road, which is currently under redevelopment.<br />
Review of Results<br />
The Group’s turnover continued to record growth and reached HK$1,922 million in <strong>2011</strong>,<br />
representing an increase of 9.0% from HK$1,764 million in 2010. The rise principally reflected<br />
the further improvement in occupancy and positive rental reversion. Higher retail turnover rent<br />
also contributed to the revenue growth of our retail sector. The turnover of each sector was<br />
recorded as below:<br />
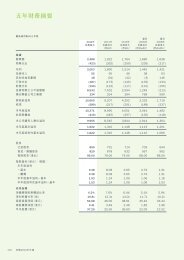
<strong>2011</strong><br />
HK$ million<br />
2010<br />
HK$ million<br />
Change<br />
HK$ million<br />
Change<br />
%<br />
Office sector 820 770 50 +6.5<br />
Retail sector 789 700 89 +12.7<br />
Residential sector 313 294 19 +6.5<br />
1,922 1,764 158 +9.0<br />
Key Performance Indicators<br />
While many factors contribute to the results of the<br />
Group’s businesses, turnover growth and occupancy rate<br />
are the key drivers used by the Group’s management for<br />
assessment of the performance of our core leasing<br />
business. In addition, the management uses property<br />
expenses and such expenses as a percentage of<br />
turnover to assess cost effectiveness. The nature of<br />
these performance indicators, the way they are<br />
measured and their significance to the Group are set out<br />
in this table.<br />
Turnover<br />
Growth<br />
Occupancy<br />
Rate<br />
Property<br />
Expenses<br />
Property<br />
Expenses as a<br />
Percentage of<br />
Turnover<br />
How is it measured<br />
Rental revenue in <strong>2011</strong> as<br />
compared to that in 2010<br />
How is it measured<br />
Percentage of total area leased<br />
to tenants over total lettable<br />
area of each sector<br />
How are they<br />
measured<br />
Principally being costs directly<br />
associated with the day-to-day<br />
operations of the Group’s<br />
property portfolio<br />
How is it measured<br />
Calculated by dividing property<br />
expenses by turnover<br />
30<br />
<strong>Hysan</strong> <strong>Annual</strong> <strong>Report</strong> <strong>2011</strong>
Recurring Underlying Profit, arrived at by excluding the fair value change of investment<br />
properties and items that are non-recurring in nature (such as gains or losses on disposal of<br />
long-term assets; impairment or its reversal; and tax provisions for prior years), was the key<br />
measurement of the Group’s core leasing business. In <strong>2011</strong>, our Recurring Underlying Profit<br />
was HK$1,310 million, up 14.1% from HK$1,148 million in 2010. Our Underlying Profit*,<br />
arrived at by excluding the fair value change of investment properties only, was also HK$1,310<br />
million, up 14.1% from HK$1,148 million in 2010. Both profit indicators primarily reflected the<br />
improvement in gross profit generated from our core leasing activities. Higher investment<br />
income was also recorded. Taking into consideration the fair value change of investment<br />
properties, our <strong>Report</strong>ed Profit* was HK$8,545 million, an increase of 122.3% from HK$3,844<br />
million in 2010. Basic earnings per share based on Recurring Underlying Profit correspondingly<br />
rose to HK123.92 cents (2010: HK109.15 cents).<br />
Why is it significant<br />
Reflects the combined<br />
effect of changes in rental<br />
rate and occupancy rate<br />
Why is it significant<br />
• Rental revenue and<br />
management fees are<br />
directly proportional to<br />
occupancy rate<br />
• Optimises revenue by<br />
balancing occupancy rate<br />
and rental level<br />
Why are they<br />
significant<br />
Measures the costs<br />
incurred in operating the<br />
Group’s property portfolio<br />
Why is it significant<br />
An indication of the gross<br />
margin of our business<br />
<strong>2011</strong><br />
HK$ million<br />
Performance<br />
Growth was recorded in all<br />
three leasing sectors<br />
Performance<br />
• Retail sector was virtually<br />
fully-let<br />
• Occupancy levels were further<br />
improved in both office and<br />
residential sectors<br />
Performance<br />
Property expenses rose<br />
principally due to higher<br />
marketing expenses (including<br />
for new <strong>Hysan</strong> Place promotion),<br />
partly offset by lower agency fees<br />
on account of strong occupancy<br />
Performance<br />
Ratio improved slightly in<br />
<strong>2011</strong><br />
2010<br />
HK$ million<br />
Change<br />
HK$ million<br />
Office Sector<br />
6.5%<br />
for <strong>2011</strong><br />
( 3.1% for 2010)<br />
Office Sector<br />
96%<br />
at year- end <strong>2011</strong><br />
(95% at year- end 2010)<br />
Change<br />
%<br />
Recurring Underlying Profit 1,310 1,148 162 +14.1<br />
Underlying Profit 1,310 1,148 162 +14.1<br />
Fair value change on investment<br />
properties located in<br />
– Hong Kong 7,177 2,469 4,708 +190.7<br />
– Shanghai 58 227 (169) -74.4<br />
<strong>Report</strong>ed Profit 8,545 3,844 4,701 +122.3<br />
* In <strong>2011</strong>, the Group had applied Hong Kong Financial <strong>Report</strong>ing Standard 9 (“HKFRS 9”) (as revised in December<br />
<strong>2011</strong>) prospectively in advance of its effective date of 1 January 2015. Following the application of HKFRS 9, the<br />
Group’s Underlying Profit and <strong>Report</strong>ed Profit in <strong>2011</strong> was decreased by HK$31 million as the cumulative gain of<br />
HK$33 million on disposal of investments in listed equity securities which would have been reclassified from<br />
investments revaluation reserve to profit or loss is now recognised as a transfer from investments revaluation<br />
reserve to retained profits, as well as the impairment loss of HK$2 million on investments in unlisted equity<br />
securities which would have been recognised as impairment loss in profit or loss is now recognised in<br />
investments revaluation reserve.<br />
Retail Sector<br />
12.7%<br />
for <strong>2011</strong><br />
( 8.0% for 2010)<br />
Retail Sector<br />
Virtually<br />
Fully-Let<br />
at year- end <strong>2011</strong><br />
(96% at year- end 2010)<br />
Total Property Expenses<br />
HK$262million<br />
for <strong>2011</strong><br />
(HK$250 million for 2010)<br />
Property Expenses to Turnover Ratio<br />
13.6%<br />
for <strong>2011</strong><br />
(14.2% for 2010)<br />
Residential Sector<br />
6.5%<br />
for <strong>2011</strong><br />
( 3.2% for 2010)<br />
Residential Sector<br />
95%<br />
at year- end <strong>2011</strong><br />
(94% at year- end 2010)<br />
Overview<br />
Strategy in Action Corporate Governance Financial Statements and Valuation<br />
<strong>Hysan</strong> <strong>Annual</strong> <strong>Report</strong> <strong>2011</strong> 31
Management’s Discussion<br />
and Analysis<br />
Review of Operations<br />
All three leasing sectors continued to record growth during the year. The portfolio, strategies<br />
and performance of each sector are discussed in detail below.<br />
Office Sector<br />
<strong>Hysan</strong> owns and manages 2.1 million gross square feet of premium office space in the core<br />
commercial district of Causeway Bay. Our office portfolio’s Grade “A” offices (comprising The<br />
Lee Gardens, Lee Gardens Two, Sunning Plaza and 18 <strong>Hysan</strong> Avenue) provide a core location<br />
with premium facilities and prestige for tenants and their clients. Other office buildings within<br />
our portfolio (comprising One <strong>Hysan</strong> Avenue, 111 Leighton Road and Leighton Centre) provide<br />
quality office space for tenant use. In <strong>2011</strong>, we completed the renovation work for Leighton<br />
Centre, giving a fresh look to its lobby and common areas.<br />
Our office sector’s revenue grew 6.5% to HK$820 million (2010: HK$770 million). Occupancy<br />
at year-end <strong>2011</strong> increased to 96%, as compared to 95% on both 30 June <strong>2011</strong> and<br />
31 December 2010.<br />
On renewing and negotiating new leases, we achieved positive rental reversion as a whole as<br />
compared to rental levels in 2008, the last market peak. This reflects the success of our<br />
marketing activities. In particular, the rental level of The Lee Gardens climbed above the peak<br />
of 2008, setting the rental tone for the pre-leasing of <strong>Hysan</strong> Place. The impact of overall<br />
positive rental reversion successfully offset the brought forward effect of low rental rates<br />
committed during the market troughs of 2009.<br />
32<br />
<strong>Hysan</strong> <strong>Annual</strong> <strong>Report</strong> <strong>2011</strong>
Overview<br />
Our office has a balanced tenant mix. The top four industry groups are insurance, banking and<br />
finance, professional and consulting, and high-end retailers. Together they take up around<br />
56.3% of total lettable area, with no single industry group accounting for more than 20% of<br />
total lettable area. The charts below illustrate our office portfolio tenant profile as analysed by<br />
area occupied.<br />
Office Tenant Profile by Area Occupied as at Year- end<br />
4.6%<br />
5.1%<br />
5.8%<br />
19.3%<br />
8.9%<br />
5.2%<br />
<strong>2011</strong><br />
13.9% 4.9% 2010<br />
10.0%<br />
19.8%<br />
12.6%<br />
6.4%<br />
18.5%<br />
9.1%<br />
8.9%<br />
18.2%<br />
14.9%<br />
13.9%<br />
Insurance<br />
Banking and Finance<br />
Professional and Consulting<br />
High-end Retailers<br />
Semi-retail<br />
Marketing<br />
Consumer Products<br />
Trading<br />
Others<br />
To increase our office portfolio’s longer-term competitiveness, we continued to raise property<br />
service standards across our portfolio and form closer tenant relationships.<br />
Strategy in Action Corporate Governance Financial Statements and Valuation<br />
<strong>Hysan</strong> <strong>Annual</strong> <strong>Report</strong> <strong>2011</strong> 33
Management’s Discussion<br />
and Analysis<br />
Retail Sector<br />
<strong>Hysan</strong>’s retail portfolio, approximately 0.9 million gross square feet in size, takes full advantage<br />
of its position in Causeway Bay, Hong Kong’s prime retail area. The Lee Gardens hub<br />
(comprising The Lee Gardens, Lee Gardens Two, Sunning Plaza and 18 <strong>Hysan</strong> Avenue) provides<br />
elegant and luxury premium retail spaces for high-end brands, while the Lee Theatre hub<br />
(comprising Lee Theatre Plaza, Leighton Centre and One <strong>Hysan</strong> Avenue) is home to stylish and<br />
chic lifestyle shops and renowned restaurants.<br />
Riding on strong private consumption on the back of a favourable labour market and increased<br />
spending by Mainland tourists in <strong>2011</strong>, <strong>Hysan</strong>’s retail sector revenue recorded strong growth of<br />
12.7% to HK$789 million (2010: HK$700 million). Turnover rent increased significantly by<br />
64.8% to HK$89 million (2010: HK$54 million), further reflecting the benefits generated by<br />
buoyant retail sales.<br />
Retail spaces were virtually fully-let after the completed renovation of Leighton Centre’s retail<br />
podium, as compared to 95% on 30 June <strong>2011</strong> and 96% on 31 December 2010.<br />
Tenant sales of our overall retail portfolio recorded an increase of 22.2% over 2010. In <strong>2011</strong>,<br />
tenant sales of the retail units in The Lee Gardens and Lee Gardens Two increased by 29.1%.<br />
Mainland tourist spending in The Lee Gardens and Lee Gardens Two increased by 84%<br />
compared to 2010.<br />
These results reflect the success of our leasing and marketing strategies, which placed<br />
emphasis on reinforcing the luxury positioning of the Lee Gardens hub and rejuvenating the<br />
trendy Lee Theatre hub. In the Lee Gardens hub, our tenant mix and facilities were further<br />
upgraded to enhance the area’s stylish ambience. We strengthened our customer base and the<br />
loyalty of our local shoppers. In addition, we launched promotion activities to target Mainland<br />
tourists including conducted tours for members of the Mainland media. These programmes<br />
helped stimulate shopper traffic and consumption.<br />
In the Lee Theatre hub, the completed renovation of Leighton Centre complemented the arrival<br />
of a new fashion flagship store at One <strong>Hysan</strong> Avenue. These efforts helped redefine the hub as<br />
an even more fashionable shopping venue with a new wave of contemporary fashion brands<br />
and flagship stores. The completion of these projects paves the way for the next phase of<br />
renovation and rejuvenation of Lee Theatre Plaza planned for 2012.<br />
34<br />
<strong>Hysan</strong> <strong>Annual</strong> <strong>Report</strong> <strong>2011</strong>
Overview<br />
Residential Sector<br />
Our residential portfolio comprises the Bamboo Grove residential development located in<br />
Mid-Levels and Sunning Court in Causeway Bay. We offer top quality facilities and one-stop<br />
personalised services to provide an expatriate-focused living experience. Residential leases<br />
are typically for two years.<br />
The Group’s residential sector’s revenue increased by 6.5% to HK$313 million (2010: HK$294<br />
million). Occupancy remained strong, at 95% at the end of <strong>2011</strong>, as compared to 96% on<br />
30 June <strong>2011</strong> and 94% on 31 December 2010. Rising rental levels led to positive rental<br />
reversion in <strong>2011</strong>.<br />
Our tenant retention remained high, reflecting our continued efforts to enhance our facilities,<br />
services and clubhouse activities. Refurbishment of selected units has successfully<br />
established a new pricing benchmark, surpassing the peak of 2008. Strengthened tenant<br />
relations and direct marketing initiatives have helped increase tenant referrals and deals made<br />
directly with us.<br />
Our team of experienced, bilingual Resident Services Associates will continue to provide<br />
personalised assistance to residents, while our regular social and cultural activities will help<br />
create a thriving community and foster long-term partnerships with residents.<br />
Strategy in Action Corporate Governance Financial Statements and Valuation<br />
<strong>Hysan</strong> <strong>Annual</strong> <strong>Report</strong> <strong>2011</strong> 35
Management’s Discussion<br />
and Analysis<br />
<strong>Hysan</strong> Place<br />
The next milestone for <strong>Hysan</strong> will be the redevelopment project of <strong>Hysan</strong> Place at 500<br />
Hennessy Road, comprising 15 levels of office space and 17 floors of retail outlets, totaling<br />
710,000 square feet. <strong>Hysan</strong> Place will bring long-term strategic significance to the overall<br />
<strong>Hysan</strong> portfolio:<br />
• <strong>Hysan</strong> Place’s retail portion will significantly strengthen <strong>Hysan</strong>’s overall retail portfolio, in<br />
terms of both its size, which represents an increase of 50% by gross floor area, and its<br />
tenant mix, bringing many tenants which are new to Hong Kong.<br />
• <strong>Hysan</strong> Place will also be an important part of <strong>Hysan</strong>’s office cluster evolution, providing top<br />
quality space to strengthen our Grade “A” office positioning as the most natural extension of<br />
Central. <strong>Hysan</strong> Place will be the only triple A grade building to open on Hong Kong Island in<br />
2012. Its sustainability design features are based on world-class building specifications and<br />
the building offers full harbour views from all office floors.<br />
• <strong>Hysan</strong> Place demonstrates <strong>Hysan</strong>’s commitment to find greener solutions for all our<br />
buildings and for Causeway Bay as a whole. The project is built to the highest international<br />
environmental and sustainability standards, having achieved pre-certification at the Platinum<br />
level for the United States Green Building Council’s Leadership in Energy and Environmental<br />
Design (USGBC LEED), as well as the Hong Kong Building Environmental Assessment<br />
Method (HK BEAM) standard. With its specially designed “Urban Windows” and roof gardens,<br />
<strong>Hysan</strong> Place is set to become a green landmark in the heart of thriving Causeway Bay.<br />
Construction of the building is making good progress. Leasing for the overall building<br />
proceeded well during the year, with over 90% of retail space leased by the end of February<br />
2012. The shopping mall is expected to open in August 2012, to allow for better co-ordinated<br />
launch of retail outlets from August onwards. The arrangement should better ensure the<br />
long-term success of the mall.<br />
Our retail tenants will include international brands new to Hong Kong, catering to the needs of<br />
trendy shoppers. The entire project promises to bring additional shopping dynamics and an<br />
exciting new variety to the district of Causeway Bay.<br />
In terms of office leasing, following the commitment to one-third of the entire office space by<br />
an international accounting firm, the rest of the office space is under negotiation with<br />
prospective tenants. Leasing strategy will balance occupancy and strategic contribution<br />
towards further enhancing the tenant profile and hence attraction of our office portfolio.<br />
<strong>Hysan</strong> Place: express escalators in the building facilitate shopper circulation in the vertical mall<br />
36<br />
<strong>Hysan</strong> <strong>Annual</strong> <strong>Report</strong> <strong>2011</strong>
Financial Review<br />
A review of the Group’s results and operations is covered in the preceding sections. This<br />
section deals with other financial matters.<br />
Overview<br />
Operating Costs<br />
The Group’s operating costs were generally classified as property expenses and administrative<br />
expenses.<br />
Property expenses were the costs directly associated with the day-to-day operations of our<br />
investment properties, being primarily related to front-line staff wages and benefits, utilities<br />
costs, repairs and maintenance, marketing expenses and agency fees, as well as cleaning<br />
expenses. In <strong>2011</strong>, higher marketing expenses were incurred for capturing local and tourist<br />
spending, as well as for <strong>Hysan</strong> Place’s pre-leasing promotion activities. These were partly offset<br />
by a reduction in agency fees as occupancy and direct marketing further improved. As a result,<br />
property expenses rose 4.8% to HK$262 million (2010: HK$250 million). Coupled with the<br />
increase in turnover, the property expenses to turnover ratio improved slightly from 14.2% to<br />
13.6% as compared to 2010.<br />
Administrative expenses were the costs indirectly associated with the day-to-day operations of<br />
our investment properties, largely representing the payroll costs and related expenses of<br />
management and head-office staff. In addition to costs for continuing human resources<br />
upskilling for <strong>Hysan</strong>’s existing property portfolio, additional payroll costs were incurred in <strong>2011</strong><br />
for hiring new staff in relation to the upcoming <strong>Hysan</strong> Place. These factors resulted in<br />
administrative expenses increasing by 23.6% to HK$173 million (2010: HK$140 million).<br />
Finance Costs<br />
Finance costs, after capitalisation of HK$44 million (2010: HK$12 million) interest expenses<br />
and related borrowing costs as part of the construction costs of <strong>Hysan</strong> Place, were HK$122<br />
million in <strong>2011</strong>, up 4.3% from HK$117 million in 2010. If the capitalised interest expenses<br />
and related borrowing costs were included, the Group’s finance costs in <strong>2011</strong> would have been<br />
HK$166 million, an increase of HK$37 million or 28.7% as compared to last year (2010:<br />
HK$129 million). It was predominantly due to the increase in the Group’s gross borrowings.<br />
During the year, the Group issued notes of HK$554 million from the Medium Term Notes<br />
Programme and drew down bank loans of HK$2,350 million, mainly for preparing for the<br />
repayment of debts maturing in early 2012.<br />
The Group’s average finance costs in <strong>2011</strong> (defined as interest expenses divided by average<br />
gross debt for the year) were 2.7%, at a level similar to 2010. Further discussion of the<br />
Group’s treasury policy, including debt and interest rate management, is set out in the<br />
“Treasury Policy” section on pages 40 to 44.<br />
Strategy in Action Corporate Governance Financial Statements and Valuation<br />
<strong>Hysan</strong> <strong>Annual</strong> <strong>Report</strong> <strong>2011</strong> 37
Management’s Discussion<br />
and Analysis<br />
Revaluation of Investment Properties<br />
The Group’s investment property portfolio was valued at 31 December <strong>2011</strong> by Knight Frank<br />
Petty <strong>Limited</strong>, an independent professional valuer, on the basis of open market value. The<br />
amount of this valuation was HK$49,969 million, an increase of 22.4% from HK$40,833<br />
million at 31 December 2010. The valuation at year-end <strong>2011</strong> principally reflected improved<br />
rental rates for the Group’s investment property portfolio as well as the increase in site value<br />
of and construction costs expended on <strong>Hysan</strong> Place, which is near completion. The following<br />
shows the property valuation of each portfolio at year-end.<br />
<strong>2011</strong><br />
HK$ million<br />
2010<br />
HK$ million<br />
Change<br />
HK$ million<br />
Change<br />
%<br />
Office portfolio 16,954 14,708 2,246 +15.3<br />
Retail portfolio 15,089 11,896 3,193 +26.8<br />
Residential portfolio 8,426 7,821 605 +7.7<br />
Property under redevelopment<br />
(<strong>Hysan</strong> Place)* 9,500 6,408 3,092 +48.3<br />
49,969 40,833 9,136 +22.4<br />
* Property under redevelopment is valued at site value plus construction costs expended up to date.<br />
Excluding capital expenditures for the Group’s property portfolio, fair value gain on investment<br />
properties of HK$7,532 million (2010: HK$2,594 million) was recognised in the Group’s<br />
consolidated income statement for the year.<br />
Investments in Associates<br />
The Group’s share of results of associates decreased by 35.5% to HK$254 million (2010:<br />
HK$394 million), principally due to a smaller revaluation gain on the Shanghai Grand Gateway<br />
project, of which the Group owns 24.7%, as compared to last year. At 31 December <strong>2011</strong>,<br />
properties at Shanghai Grand Gateway had been revalued at fair value by an independent<br />
professional valuer. The Group’s share of the revaluation gain, net of the corresponding<br />
deferred tax thereon, of the associate amounted to HK$58 million (2010: HK$227 million).<br />
The Shanghai Grand Gateway project continued to deliver a good performance in <strong>2011</strong>. The<br />
Group’s share of results, excluding revaluation gains on investment properties held by the<br />
associate, recorded a 17.4% increase year-on-year. As at the end of <strong>2011</strong>, the residential<br />
properties were continuing to enjoy high occupancy while the retail and office properties<br />
remained virtually fully-let.<br />
Other Investments<br />
In addition to placing surplus funds as time deposits in banks with strong credit ratings, the<br />
Group also invested in highly liquid listed securities, debt securities as well as principalprotected<br />
investments. This helped to preserve the Group’s liquidity and to diversify<br />
counterparty risk exposure.<br />
In <strong>2011</strong>, higher interest income from bank deposits was experienced as the average bank<br />
deposits rate increased. In addition, higher dividend income was derived from the Group’s<br />
equity investments. As a result, the Group’s investment income increased by 83.7% to<br />
HK$90 million from HK$49 million in 2010.<br />
38<br />
<strong>Hysan</strong> <strong>Annual</strong> <strong>Report</strong> <strong>2011</strong>
Cash Flows<br />
Cash flow of the Group during the year is summarised below.<br />
Overview<br />
<strong>2011</strong><br />
HK$ million<br />
2010<br />
HK$ million<br />
Change<br />
HK$ million<br />
Change<br />
%<br />
Operating cash inflow 1,592 1,460 132 +9.0<br />
Financing 2,041 620 1,421 +229.2<br />
Capital expenditure (1,547) (828) (719) +86.8<br />
Investments (1,040) (147) (893) +607.5<br />
Interest and taxation (273) (246) (27) +11.0<br />
Dividends paid and share issues (679) (732) 53 -7.2<br />
Net cash inflow 94 127 (33) -26.0<br />
Including the movements of working capital, the Group reported operating cash inflow of<br />
HK$1,592 million (2010: HK$1,460 million) in <strong>2011</strong>, reflecting the growth in our core leasing<br />
business and better working capital management. Cash flow from financing rose to HK$2,041<br />
million (2010: HK$620 million), mainly due to new borrowings of HK$2,350 million bank loans<br />
and HK$554 million fixed rate notes during the year, which was partly offset by the cash<br />
outflow for debts repayment.<br />
Capital expenditure in <strong>2011</strong> was HK$1,547 million (2010: HK$828 million), largely used for<br />
the payment of construction costs of <strong>Hysan</strong> Place and other costs for building renovations.<br />
Cash used in investments was HK$1,040 million (2010: HK$147 million), of which the<br />
majority were time deposits with tenor matching debts maturing in early 2012.<br />
Capital Expenditure and Management<br />
The Group is committed to enhancing the asset value of its investment property portfolio<br />
through selective refurbishment, repositioning and redevelopment. The Group has also in place<br />
a portfolio-wide whole-life cycle maintenance programme as part of its ongoing strategy to<br />
pro-actively implement preventive maintenance activities. Total cash outlay of capital<br />
expenditure (excluding principally purchase of plant and equipment) during the year was<br />
HK$1,520 million (2010: HK$871 million). The rise was mostly attributable to the increase in<br />
payments of construction costs for <strong>Hysan</strong> Place and other renovation costs for <strong>Hysan</strong>’s existing<br />
portfolio.<br />
The Group has an internal control system for scrutinising capital expenditures. Detailed<br />
analysis of expected risks and returns is submitted to business unit heads, Executive Directors<br />
or the Board for consideration and approval, depending on strategic importance, cost/benefit<br />
and the size of the projects. The criteria for assessment of financial feasibility are generally<br />
based on net present value, payback period and internal rate of return from projected cash<br />
flow.<br />
Strategy in Action Corporate Governance Financial Statements and Valuation<br />
<strong>Hysan</strong> <strong>Annual</strong> <strong>Report</strong> <strong>2011</strong> 39
Management’s Discussion<br />
and Analysis<br />
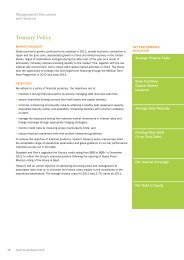
Treasury Policy<br />
Market Highlight<br />
The global economic recovery remained slow and uncertain in <strong>2011</strong>. Concerns about<br />
sovereign debt risks in the Euro zone and economic slowdown and high unemployment rates<br />
in the developed economies exerted pressure on the financial markets. Although the Asian<br />
economies maintained its growth trend in <strong>2011</strong>, the pace slowed down as tight liquidity led to<br />
depressed financial assets prices and increased borrowing costs in the second half of the<br />
year. Against this uncertain backdrop, the Group will continue to focus on liquidity<br />
management in 2012.<br />
Objectives<br />
We adhere to a policy of financial prudence. Our objectives are to:<br />
• maintain a strong financial position by actively managing debt levels and cash flow;<br />
• secure diversified funding sources from both banks and capital markets;<br />
• minimise re-financing and liquidity risks by attaining a healthy debt repayment capacity,<br />
diversified maturity profile, and availability of banking facilities with minimum collateral on<br />
debt;<br />
• manage the exposures arising from adverse market movements in interest rates and<br />
foreign exchange through appropriate hedging strategies;<br />
• monitor credit risks by imposing proper counter-party limits; and<br />
• reduce financial investment risks by holding quality marketable securities.<br />
To achieve the objective of financial prudence, <strong>Hysan</strong>’s Treasury policy manual lays down the<br />
acceptable range of operational parameters and gives guidance on our key performance<br />
indicators as set out in the table. Reflecting our strong financial position, the Group<br />
maintained its investment-grade credit ratings of Baa1 as rated by Moody’s and BBB as rated<br />
by Standard and Poor’s in <strong>2011</strong>.<br />
Treasury has an overall objective of optimising borrowing costs and the management of<br />
associated risks: that is, to minimise finance costs subject to the constraints of our<br />
operational parameters. The average cost of financing for <strong>2011</strong> was 2.7%, same as 2010.<br />
KEY PERFORMANCE INDICATORS<br />
Average<br />
Finance<br />
Costs<br />
Bank Facilities:<br />
Capital Market<br />
Issuance<br />
Average<br />
Debt<br />
Maturity<br />
Floating Rate<br />
Debt<br />
(% on Total<br />
Debt)<br />
Net Interest<br />
Coverage<br />
Net Debt to<br />
Equity<br />
40<br />
<strong>Hysan</strong> <strong>Annual</strong> <strong>Report</strong> <strong>2011</strong>
How are they<br />
measured<br />
Interest expenses divided<br />
by average gross debt for<br />
the year<br />
Why are they<br />
significant<br />
Our treasury aims to<br />
manage and optimise<br />
finance costs<br />
Performance<br />
HIBOR in <strong>2011</strong><br />
continued to hover at a<br />
level similar to 2010<br />
Average Finance Costs<br />
2.7%<br />
for <strong>2011</strong><br />
(2.7% for 2010)<br />
Overview<br />
How is it measured<br />
The proportion of the<br />
borrowings from banks and<br />
from capital markets<br />
relative to gross debt<br />
Why is it significant<br />
As a measure of<br />
diversification of funding<br />
sources<br />
Performance<br />
More bank borrowings<br />
were utilised during<br />
the year to increase<br />
our financial flexibility<br />
Bank Facilities :<br />
Capital Market Issuance<br />
43.1%:56.9%<br />
at year- end <strong>2011</strong><br />
(29.7% : 70.3% at year-end 2010)<br />
How is it measured<br />
The weighted average of the<br />
remaining maturity period of<br />
the Group’s gross debt<br />
How is it measured<br />
Debt effectively in floating<br />
interest rates divided by<br />
gross debt<br />
How is it measured<br />
Gross profit less<br />
administrative expenses<br />
before depreciation divided<br />
by net interest expenses<br />
How is it measured<br />
Borrowings less time<br />
deposits, cash and bank<br />
balances divided by<br />
shareholders’ funds<br />
Why is it significant<br />
An indicator of the pressure<br />
for re-financing or repaying the<br />
existing borrowings in the near<br />
term<br />
Why is it significant<br />
A measure to calculate the<br />
percentage of borrowings<br />
subject to fluctuations in<br />
market interest rates<br />
Why is it significant<br />
It represents the Group’s<br />
financial ability from operating<br />
activities to meet its interest<br />
payment obligations<br />
Why is it significant<br />
A benchmark as to the healthy<br />
debt level as well as an<br />
indicator of the Group’s ability<br />
to raise further debt<br />
Performance<br />
The average maturity<br />
was about the same<br />
as at year-end 2010<br />
Performance<br />
The ratio was kept<br />
around the same level<br />
as at year-end 2010<br />
Performance<br />
Ratio reflects our<br />
stable profit against<br />
higher net interest<br />
expenses<br />
Performance<br />
The ratio remains low<br />
and the Group’s ability<br />
to raise further debt<br />
remains strong<br />
Average Debt Maturity<br />
4.2 years<br />
at year- end <strong>2011</strong><br />
(4.3 years at year-end 2010)<br />
Floating Rate Debt<br />
54.8%<br />
at year-end <strong>2011</strong><br />
(53.6% at year-end 2010)<br />
Net Interest Coverage<br />
12.3times<br />
for <strong>2011</strong><br />
(14.0 times for 2010)<br />
Net Debt to Equity<br />
7.6%<br />
at year-end <strong>2011</strong><br />
(6.4% at year-end 2010)<br />
Strategy in Action Corporate Governance Financial Statements and Valuation<br />
<strong>Hysan</strong> <strong>Annual</strong> <strong>Report</strong> <strong>2011</strong> 41
Management’s Discussion<br />
and Analysis<br />
Debt Management<br />
Liquidity in the local bank loan market experienced significant changes in <strong>2011</strong>. The market<br />
was flushed with liquidity at the beginning of the year. However, as China continued to tighten<br />
its monetary policy to contain inflation, together with worsening situation in regard to the Euro<br />
sovereign debt crisis, liquidity dropped substantially in the second half of the year. For capital<br />
market activities, investors also required a higher credit premium than before due to an<br />
uncertain economic outlook. As a result, credit spread on new borrowings increased<br />
significantly in <strong>2011</strong>.<br />
Leveraging its strong financial position, the Group successfully arranged new financings of<br />
HK$2,004 million despite the unfavourable credit environment in <strong>2011</strong>. The new financings<br />
were mainly used for preparing for the repayment of debt maturing in early 2012. The<br />
HK$2,004 million financings comprised banking facilities of HK$1,450 million and notes of<br />
HK$554 million issued under the Medium Term Notes Programme.<br />
The graph below shows the financial strength of the Group and our ability to meet interest<br />
payment obligations and to raise further debts if necessary.<br />
Net Interest Coverage and Net Debt to Equity at Year- end<br />
%/times<br />
14.0x<br />
14<br />
11.7x<br />
12<br />
10.2x<br />
10<br />
7.8x<br />
8<br />
6 6.8%<br />
5.9%<br />
6.4%<br />
4<br />
5.1%<br />
12.3x<br />
7.6%<br />
2<br />
0<br />
07 08 09 10 11<br />
Net Debt to Equity<br />
Net Interest Coverage (times)<br />
The Group always strives to lower the borrowing margin, to diversify the funding sources and to<br />
maintain a suitable maturity profile relative to the overall use of funds. As at 31 December<br />
<strong>2011</strong>, the outstanding gross debt of the Group was HK$6,610 million (2010: HK$4,540<br />
million), an increase of HK$2,070 million compared with 2010. All outstanding borrowings are<br />
on an unsecured basis.<br />
To diversify funding sources, the Group has established long-term relationships with a number<br />
of local and overseas banks. Ten local and overseas banks have provided bilateral banking<br />
facilities to the Group and such bank borrowings accounted for about 43.1% (2010: 29.7%) of<br />
the Group’s outstanding gross debt. These facilities help to increase the Group’s financial<br />
flexibility and to maintain a low level of funding costs. The Group also has access to local and<br />
international investors through notes issued under the Medium Term Notes Programme. As at<br />
the end of <strong>2011</strong>, about 56.9% (2010: 70.3%) of the Group’s outstanding gross debts were<br />
sourced from the debt capital markets through the Programme.<br />
42<br />
<strong>Hysan</strong> <strong>Annual</strong> <strong>Report</strong> <strong>2011</strong>
The following graph shows the percentages of total outstanding gross debts sourced from<br />
banks and the debt capital markets in the past five years.<br />
Sources of Financing at Year- end<br />
HK$ million<br />
7,000<br />
6,000<br />
56.9%<br />
Overview<br />
5,000<br />
4,000<br />
3,000<br />
2,000<br />
1,000<br />
0<br />
70.3%<br />
75.1%<br />
62.8%<br />
75.3%<br />
43.1%<br />
37.2%<br />
29.7%<br />
24.7%<br />
24.9%<br />
07 08 09 10 11<br />
Bilateral Bank Loans<br />
Capital Market Issuances<br />
The Group also strives to maintain an appropriate maturity profile. As at 31 December <strong>2011</strong>,<br />
the average maturity of the debt portfolio was about 4.2 years (2010: 4.3 years), of which<br />
about HK$2,207 million or 33.4% (2010: HK$2,007 million or 44.2%) of the outstanding<br />
debts will be due in less than two years. As the Group has already arranged funding for the<br />
repayment of maturing debts in 2012, there is little re-financing pressure for the year. The<br />
Group, however, will continue to monitor the financial markets closely to identify the appropriate<br />
opportunity to tap the market if needed.<br />
The graph below shows the debt maturity profile of the Group at <strong>2011</strong> and 2010 year-end.<br />
Debt Maturity Profile at <strong>2011</strong> and 2010 Year- end<br />
<strong>2011</strong><br />
2010<br />
0<br />
1,000<br />
1,507<br />
700 2,600 1,803 6,610<br />
650 1,357 1,298 1,235<br />
2,000<br />
3,000<br />
4,000<br />
4,540<br />
5,000<br />
6,000<br />
7,000<br />
Gross Debt Amount (HK$ million)<br />
Maturing in not exceeding one year Maturing in more than one year but not exceeding two years<br />
Maturing in more than two years but not exceeding five years Maturing in more than five years<br />
Liquidity Management<br />
The Group always places great emphasis on liquidity management in order to withstand any<br />
possible liquidity crunch amidst turbulent financial market conditions. Recurring cash flows<br />
from our business continued to remain steady and strong. As at 31 December <strong>2011</strong>, the<br />
Group had cash and bank deposits totaling about HK$2,961 million (2010: HK$1,993 million),<br />
which will be used for capital expenditure and maturing debt repayments. All the deposits are<br />
placed with banks with strong credit ratings and the counterparty risk is monitored on a regular<br />
basis. In order to preserve liquidity and enhance interest yields, the Group also invested<br />
HK$1,060 million (2010: HK$725 million) in debt securities and principal-protected<br />
investments.<br />
Additional liquidity reserve was maintained in the form of highly liquid securities listed on The<br />
Stock Exchange of Hong Kong <strong>Limited</strong>. The market value of these securities amounted to<br />
HK$988 million at year-end <strong>2011</strong> (2010: HK$1,147 million).<br />
Further liquidity, if needed, is available from the undrawn committed facilities offered by the<br />
Group’s relationship banks. These facilities, which amounted to HK$1,000 million at year-end<br />
<strong>2011</strong> (2010: HK$2,550 million), essentially allow the Group to obtain additional liquidity as<br />
the needs arise.<br />
Strategy in Action Corporate Governance Financial Statements and Valuation<br />
<strong>Hysan</strong> <strong>Annual</strong> <strong>Report</strong> <strong>2011</strong> 43
Management’s Discussion<br />
and Analysis<br />
Interest Rate Management<br />
Interest expenses account for a significant proportion of the Group’s total expenses and<br />
warrant close monitoring. Appropriate hedging strategies are adopted to manage exposure to<br />
projected movements in the interest rates.<br />
Despite the tight liquidity in the credit market, 3-month Hong Kong Inter-bank Offered Rate<br />
(HIBOR) remained low, hovering between 0.19% and 0.38%. The benefit of low interest rates<br />
offset the impact of the slightly increased credit margin of new borrowings. As a result, the<br />
Group maintained the average cost of financing at 2.7% in <strong>2011</strong>, same as 2010.<br />
The Group managed the floating rate debt ratio at 54.8% at year-end <strong>2011</strong>, similar to the level<br />
of last year-end at 53.6%.<br />
The diagram below shows the Group’s debt levels and average finance costs in the past five<br />
years.<br />
Debt Levels and Average Finance Costs<br />
HK$ million<br />
7,000<br />
6,610<br />
7.0%<br />
6,000<br />
5.6%<br />
6.0%<br />
5,000<br />
4,000<br />
3,000<br />
2,000<br />
2,921<br />
2,437<br />
4.4%<br />
3,698<br />
3,889<br />
3.1%<br />
1,983 1,905<br />
4,540<br />
3,649<br />
2,547<br />
2.7% 2.7%<br />
5.0%<br />
4.0%<br />
3.0%<br />
2.0%<br />
1,000<br />
07 08 09 10 11<br />
Year-end Gross Debt<br />
Year-end Net Debt<br />
(Gross debt less short-term investments,<br />
time deposits, cash and bank balances)<br />
1.0%<br />
Average Finance Costs<br />
Foreign Exchange Management<br />
The Group aims to have minimal mismatches in currency and does not speculate in currency<br />
movements for debt management. With the exception of the US$174 million 10-year notes,<br />
the US$26 million and AUD37 million bank loans, which have been hedged by appropriate<br />
hedging instruments, all of the Group’s other borrowings were denominated in Hong Kong<br />
dollars. In regard to foreign exchange exposure on the investment side, the Group’s<br />
outstanding investment in time deposits, principal-protected investments and debt securities<br />
amounted to US$60 million and RMB317 million, of which US$55 million and RMB167 million<br />
were hedged by foreign exchange forward contracts. Other foreign exchange exposure mainly<br />
relates to investments in the Shanghai project. These foreign exchange exposures amounted<br />
to the equivalent of HK$3,423 million (2010: HK$3,153 million) or 5.8% (2010: 6.5%) of total<br />
assets.<br />
Use of Derivatives<br />
As at 31 December <strong>2011</strong>, outstanding derivatives mainly related to the hedging of interest rate<br />
and foreign exchange exposures. Strict internal guidelines have been established to ensure<br />
derivatives are used mainly to manage volatilities or adjust the appropriate risk profile of the<br />
Group’s Treasury assets and liabilities.<br />
Before entering into any hedging transaction, the Group will ensure that its counterparty<br />
possesses strong investment-grade ratings to control credit risk. As part of our risk<br />
management, a limit on maximum risk-adjusted credit exposure is assigned to each<br />
counterparty, which reflects the credit quality of the counterparty.<br />
44<br />
<strong>Hysan</strong> <strong>Annual</strong> <strong>Report</strong> <strong>2011</strong>
Internal Controls and<br />
Risk Management<br />
Responsibility<br />
Our Board of Directors has the overall responsibility to ensure that sound and effective internal<br />
controls are maintained, while management is charged with the responsibility to design and<br />
implement an internal controls system to manage risks. A sound system of internal controls is<br />
designed to manage rather than eliminate the risk of failure to achieve business objectives,<br />
and can only provide reasonable but not absolute assurance.<br />
<strong>2011</strong> Review of Internal Controls Effectiveness<br />
The Board is responsible for the Group’s system of internal controls and for reviewing its<br />
effectiveness. Internal Audit reports on reviews of the business processes and activities,<br />
including action plans to address any identified control weaknesses. Management assesses<br />
and presents to the Audit Committee its own assessments of the strengths and weaknesses<br />
of the overall internal controls systems, with action plans to address the weaknesses. External<br />
auditors also report on any control issues identified in the course of their work. Taking these<br />
into consideration, the Audit Committee reviews the effectiveness of the Group’s system of<br />
internal controls at least once each year and reports to the Board on such reviews.<br />
In respect of the year ended 31 December <strong>2011</strong>, the Board considered the internal controls<br />
system effective and adequate. No significant areas of concern that might affect the<br />
operational, financial reporting, and compliance functions of the Group were identified. The<br />
scope of this review covers the adequacy of resources, qualification/experience of staff of the<br />
Group’s accounting and financial reporting function, and their training and budget.<br />
<strong>Hysan</strong>’s Internal Controls Model<br />
Our internal controls model is based on that set down by the Committee of Sponsoring<br />
Organisations of the U.S. Treadway Commission (“COSO”), and has five components, namely<br />
Control Environment; Risk Assessment; Control Activities; Information and Communication; and<br />
Monitoring. In developing our internal controls model based on the COSO principles, we have<br />
taken into consideration our organisational structure and the nature of our business activities:<br />
• Control Environment --- this is very important as it sets the tone for internal controls in a<br />
company. <strong>Hysan</strong> is a tightly-knit organisation with around 500 staff members. The actions of<br />
management and its demonstrated commitment to effective governance and control are<br />
therefore very transparent to all. We have a strong tradition of good corporate governance<br />
and a corporate culture based on good business ethics and accountability. We have in place<br />
a formal Code of Ethics that is communicated to all staff (including new recruits). Our<br />
“whistle-blowing” system is monitored by an independent third party service provider with<br />
direct reporting to the Audit Committee Chairman. We aim to build risk awareness and<br />
control responsibility into our culture and regard them as the foundation of our internal<br />
controls system.<br />
• Control Activities --- our core property leasing and management business involves wellestablished<br />
business processes. Control activities have traditionally been built on top-level<br />
reviews, segregation of duties; and physical controls. Over the past few years, we have been<br />
formalising and documenting the control processes in line with a general desire to move<br />
towards a management style based on systematic and structured control principles. During<br />
<strong>2011</strong>, we established a plan, and are in progress of further strengthening the use of<br />
automation (information processing) in phases.<br />
Overview<br />
Strategy in Action Corporate Governance Financial Statements and Valuation<br />
<strong>Hysan</strong> <strong>Annual</strong> <strong>Report</strong> <strong>2011</strong> 45
Internal Controls and<br />
Risk Management<br />
Currently, the key features of our system of internal controls include:<br />
– Strategic and business planning: each business unit produces and obtains Board<br />
approval on a business plan each year, against which its performance is regularly<br />
monitored. Targets for a wide variety of key performance indicators are set. There is a<br />
Schedule of Matters Reserved for the Full Board to cover all major policies and directions<br />
of the Group. (See the separate Corporate Governance <strong>Report</strong> for details)<br />
– Investment appraisal: capital projects are reviewed in detail and approved by the Chief<br />
Executive Officer, or the Board where appropriate, in accordance with delegated authority<br />
limits.<br />
– Financial monitoring: profitability, cash flow and capital expenditure are closely monitored<br />
and key financial information is reported to the Board on a regular basis, including<br />
explanations of variances between actual and budgeted performance.<br />
– Systems of control procedures and delegated authorities: there are clearly defined<br />
guidelines and approval limits for capital and operating expenditure and other key<br />
business transactions and decisions.<br />
Risk Assessment<br />
Specify Corporate<br />
Objectives<br />
2012 focus: further<br />
Refine corporate<br />
objectives based on<br />
changes potentially<br />
impacting the<br />
business<br />
enhancement of risk identification and assessment process<br />
Identify and<br />
analyse risks<br />
to achievement<br />
of<br />
corporate<br />
objectives<br />
Monitoring<br />
• Internal audit function<br />
• Oversight by Board and<br />
Audit Committee<br />
• 2012 focus: more<br />
frequent and<br />
structured reporting to<br />
Audit Committee and<br />
Board<br />
Determine<br />
impact of such<br />
identified risks on<br />
the achievement<br />
of corporate<br />
objectives<br />
Continuous Improvement<br />
<strong>Hysan</strong>’s internal controls<br />
system:<br />
• is designed to ensure<br />
corporate objectives are<br />
achieved<br />
• has five components that<br />
work together<br />
Information and<br />
Communication<br />
Implement and<br />
operate information<br />
and communication<br />
to support internal<br />
controls<br />
Determine<br />
how each of the<br />
other internal<br />
controls components,<br />
both separately and<br />
together, mitigate<br />
such risks<br />
Control Environment<br />
• Strong tradition of<br />
emphasising good<br />
corporate governance<br />
• Human resources<br />
policies<br />
Control Activities<br />
• Documented key control<br />
policies and processes<br />
• <strong>Annual</strong> review update<br />
of risk registers by<br />
department heads<br />
Determine<br />
Effectiveness<br />
<strong>Hysan</strong>’s internal controls model is based on that set down by COSO<br />
46<br />
<strong>Hysan</strong> <strong>Annual</strong> <strong>Report</strong> <strong>2011</strong>
Our Approach to Risk Management<br />
We maintain a simple and practical approach to risk management. Given the size and nature of<br />
our business, we do not have a separate risk management function. Instead, we seek to have<br />
risk management features embedded in our operations. The following summarizes our process<br />
to identify, evaluate, and manage the risks faced by the Group.<br />
Overview<br />
Methodology: We capture and report risk in a consistent manner across the Group by way of<br />
“risk registers”, enabling management to assess the significance of risks by considering the<br />
relationship between the likelihood and consequence of their occurrence. We monitor and<br />
report risk as appropriate on both “Inherent” and “Residual” risk bases, the latter reflecting<br />
how management has reduced risks through appropriate controls and mitigating activities.<br />
<strong>Annual</strong> assessments: department heads review and update the relevant risk registers once a<br />
year, providing assurances that controls are both embedded and effective within the business.<br />
Potential weaknesses and action items are regularly monitored by the management team.<br />
Internal audit: responsible for reviewing and testing key business processes and controls in<br />
accordance with its audit plan, including following up the implementation of management<br />
actions and reporting any overdue actions to the Audit Committee. The Head of Internal Audit<br />
reports to the Chief Executive Officer and has direct access to the Audit Committee Chairman.<br />
Way Forward<br />
We recognise that the strengthening of internal controls is a continuing process. We shall<br />
continually review our business processes and control activities accordingly.<br />
During 2012, our focus will centre around the following directions:<br />
• Risk Identification<br />
and Assessment<br />
• Control Activities<br />
• More Structured and<br />
Frequent <strong>Report</strong>ing to<br />
Audit Committee<br />
We shall further refine the risk registers in phases by adopting a<br />
more risk-based approach, with clearer description of specific yearon-year<br />
risks. Training sessions and workshops will be provided to<br />
department heads, with guidance, facilitation, and discussions<br />
throughout the process.<br />
We shall continue to enhance our Control Activities by refining our<br />
documented policies and procedures, including greater use of<br />
automation (information processing). There will be a greater use of<br />
performance indicators, also facilitating top-level reviews.<br />
In addition to meetings scheduled primarily for reviewing annual and<br />
interim results, an additional Audit Committee meeting will be held<br />
to review and monitor risk management activities. Management will<br />
report on progress in action plans against our principal risks.<br />
Strategy in Action Corporate Governance Financial Statements and Valuation<br />
<strong>Hysan</strong> <strong>Annual</strong> <strong>Report</strong> <strong>2011</strong> 47
Human Resources<br />
<strong>Hysan</strong>’s people are a highly valuable asset and the key to our continuous growth and success.<br />
We believe in teamwork and the development of talents. As at 31 December <strong>2011</strong>, we<br />
employed a total of 541 staff, including our head office management team and front-line<br />
building management colleagues. Our workforce adheres strongly to the Group’s core values of<br />
maintaining high standards of business ethics and deep respect for each individual staff<br />
member.<br />
Building and Engaging a Strong Team<br />
<strong>Hysan</strong>’s team is strengthened from time to time by new members at all levels who enhance our<br />
capability to meet the Group’s strategic objectives. Integration of teamwork by all staff<br />
members is key to ensuring that we achieve sustainable growth. To this end, a key activity to<br />
help build a winning team is the annual <strong>Company</strong> Day, an off-site one-day staff meeting<br />
attended by all head office staff and front-line building managers. With the motto “Together We<br />
Can Take the Lead”, the <strong>Company</strong> Day provides an excellent platform to communicate the<br />
Group’s directions and objectives for the year from the senior management to staff, and to<br />
align company goals with those of each individual.<br />
A key component of the <strong>Company</strong> Day is the afternoon team-building session. Staff members<br />
participate in fun-filled activities that inspire better communication and encourage more<br />
effective cooperation to help maximise individual contributions to the Group.<br />
Engaging closely with staff members plays an important role in achieving business success.<br />
Among various engagement channels, our staff briefing sessions on company annual and<br />
interim results hosted by senior management are useful avenues for employees to share<br />
success, obtain updates and provide feedback.<br />
Chairman shares her vision on the <strong>Company</strong> Day<br />
An enthusiastic team participates in games<br />
on the <strong>Company</strong> Day<br />
Staff members share success at the annual<br />
results staff briefing hosted by top management<br />
48<br />
<strong>Hysan</strong> <strong>Annual</strong> <strong>Report</strong> <strong>2011</strong>
Talent Management<br />
Our people management strategy focuses on creating a talented organisation by attracting,<br />
retaining and developing high-performing employees.<br />
Overview<br />
Attracting the Best Talents<br />
<strong>Hysan</strong> attracts talents by providing them with a motivating work environment that fosters open<br />
communication. The year <strong>2011</strong> saw intensive efforts made to attract new talents in<br />
preparation for the opening of <strong>Hysan</strong> Place, our key redevelopment project to be completed in<br />
2012. More than 100 new career opportunities were offered at the operational level including<br />
the areas of customer service, property management and technical support, as well as at the<br />
management level with marketing and retail leasing being particularly important.<br />
To meet demand for a strengthened team, we launched a hiring campaign by expanding<br />
recruitment channels, including Recruitment Days and employee referrals.<br />
Retaining and Developing Our Staff<br />
To create a culture of high performance, we focus on a strong performance management<br />
process to ensure that employee performance is objectively assessed and rewarded. We adopt<br />
the principle of “reward for performance” to motivate our employees and recognise their<br />
contribution.<br />
In addition, we are committed to investing in our people and to helping them pursue career<br />
paths that match their aspirations. We promote continuous learning and offer a well-designed<br />
training curriculum for managerial and general staff to upgrade their competencies and<br />
capabilities. The training programmes include specialised business-related workshops such as<br />
Finance for Non-finance Managers, and Sales Behaviour for Success, both of which aim to<br />
enhance the professional training of staff. Operational training courses covering customer<br />
services and the development of service standards are organised on an on-going basis. We<br />
also offer training sponsorships to encourage our staff to remain well informed about the<br />
industry and to enhance their professional skills and knowledge.<br />
A focus of operating staff development in <strong>2011</strong> was the preparation for the opening of <strong>Hysan</strong><br />
Place. As <strong>Hysan</strong> Place features a 17-floor shopping mall and prime offices of sustainable<br />
design, operating staff are provided with training to equip them with skills and new knowledge<br />
related to green features for offices, technical features designed for a vertical shopping mall,<br />
and electronic applications that aim at enhancing shoppers’ experiences.<br />
Way Forward<br />
As <strong>Hysan</strong>’s portfolio continues to evolve with the completion of <strong>Hysan</strong> Place, our human capital<br />
is playing an increasingly instrumental role in ensuring our sustainable development and future<br />
success. Collaborative teamwork and people development will continue to be central pillars for<br />
supporting the Group’s transformation and for nurturing the next generation of <strong>Hysan</strong> leaders<br />
to maintain the succession pipeline.<br />
Strategy in Action Corporate Governance Financial Statements and Valuation<br />
<strong>Hysan</strong> <strong>Annual</strong> <strong>Report</strong> <strong>2011</strong> 49
3<br />
Corporate Governance<br />
This section introduces our Board<br />
of Directors and senior management,<br />
and gives an account of our governance<br />
structure and systems. It explains our<br />
best practices in corporate governance<br />
in place and reviews the Board’s work<br />
focus in <strong>2011</strong>.<br />
50<br />
<strong>Hysan</strong> <strong>Annual</strong> <strong>Report</strong> <strong>2011</strong>
52<br />
56<br />
73<br />
81<br />
89<br />
Board of Directors<br />
and Senior Management<br />
Corporate Governance <strong>Report</strong><br />
Directors’ <strong>Report</strong><br />
Directors’ Remuneration<br />
and Interests <strong>Report</strong><br />
Audit Committee <strong>Report</strong><br />
Corporate Governance<br />
<strong>Hysan</strong> <strong>Annual</strong> <strong>Report</strong> <strong>2011</strong> 51
Board of Directors<br />
and Senior Management<br />
THE BOARD<br />
MANAGEMENT<br />
Audit Committee<br />
Remuneration Committee<br />
Nomination Committee<br />
Strategy Committee<br />
(A)<br />
(R)<br />
(N)<br />
(S)<br />
Finance<br />
Corporate Services<br />
Property<br />
Investment<br />
Property<br />
Services<br />
Property<br />
<strong>Development</strong><br />
Chairman (chairing N, S)<br />
Irene Yun Lien LEE<br />
Ms. Lee is the non-executive chairman of Keybridge Capital <strong>Limited</strong>, a financial services<br />
company listed on the Australian Stock Exchange, a non-executive director of Cathay<br />
Pacific Airways <strong>Limited</strong>, QBE Insurance Group <strong>Limited</strong> (listed on the Australian Stock<br />
Exchange) and Noble Group <strong>Limited</strong> (listed on Singapore Exchange <strong>Limited</strong>). She is a<br />
member of the Advisory Council of JP Morgan Australia. She has held senior positions in<br />
investment banking and fund management in a number of renowned international<br />
financial institutions. Previously, Ms. Lee has been an executive director of Citicorp<br />
Investment Bank <strong>Limited</strong> in New York, London and Sydney; head of corporate finance at<br />
Commonwealth Bank of Australia and chief executive officer of Sealcorp Holdings <strong>Limited</strong>,<br />
both based in Sydney; and a non-executive director of ING Bank (Australia) <strong>Limited</strong> and<br />
The Myer Family <strong>Company</strong> Pty <strong>Limited</strong>. Ms. Lee was formerly a member of the Australian<br />
Government Takeovers Panel. She is a member of the founding Lee family, a sister of<br />
Mr. Anthony Hsien Pin LEE (Non-executive Director) and his alternate on the Board.<br />
Ms. Lee holds a Bachelor of Arts Degree from Smith College, United States of America,<br />
and is a Barrister-at-Law in England and Wales and a member of the Honourable Society<br />
of Gray’s Inn, United Kingdom. She was appointed a Non-executive Director in March <strong>2011</strong><br />
and became Non-executive Chairman in May <strong>2011</strong>. She was appointed Executive<br />
Chairman in March 2012. She is aged 58.<br />
52<br />
<strong>Hysan</strong> <strong>Annual</strong> <strong>Report</strong> <strong>2011</strong>
Non-executive<br />
Deputy Chairman (S)<br />
Siu Chuen LAU<br />
Mr. Lau is a private investor. Previously, he has worked as<br />
a management consultant at McKinsey & <strong>Company</strong>, a<br />
consumer analyst at Morgan Stanley Asia, and a brand<br />
manager of a French luxury product. He subsequently<br />
co-founded and became a Responsible Officer of a SFC<br />
licensed investment advisory firm. Mr. Lau was the acting<br />
Head of Finance of <strong>Hysan</strong> Group in 1999. He is a member<br />
of the founding Lee family and an alternate director of Lee<br />
<strong>Hysan</strong> <strong>Company</strong> <strong>Limited</strong>, a substantial shareholder of the<br />
<strong>Company</strong>. Mr. Lau holds a Bachelor of Social Sciences<br />
Degree in Management and Economics from The University<br />
of Hong Kong, and a Master of Business Administration<br />
Degree from INSEAD, France. He was appointed a<br />
Non-executive Director in May <strong>2011</strong> and became<br />
Non-executive Deputy Chairman in March 2012. He is<br />
aged 53.<br />
Chief Executive Officer (S)<br />
Gerry Lui Fai YIM<br />
Mr. Yim leads the management team and is responsible<br />
for the entire Group’s business and development. Prior to<br />
joining <strong>Hysan</strong>, he was managing director (for the Americas,<br />
Middle East and Africa) of the ports division of a<br />
conglomerate and has held senior positions in general<br />
management, finance, and investment banking at major<br />
organisations in Hong Kong. Mr. Yim holds a Bachelor’s<br />
degree in Economics from the University of Leeds, United<br />
Kingdom. He is a member of the Institute of Chartered<br />
Accountants in England and Wales and the Hong Kong<br />
Institute of Certified Public Accountants. He was appointed<br />
Executive Director in December 2009 and Chief Executive<br />
Officer in March 2010. He is aged 52.<br />
Independent non-executive<br />
Director (N, S, chairing A)<br />
Nicholas Charles ALLEN<br />
Mr. Allen is an independent non-executive director of CLP<br />
Holdings <strong>Limited</strong>, Lenovo Group <strong>Limited</strong> and VinaLand<br />
<strong>Limited</strong>. He has extensive experience in accounting and<br />
auditing and was a partner of PricewaterhouseCoopers<br />
(PwC) from 1988 until his retirement in June 2007. His<br />
other appointments in Hong Kong prior to his retirement<br />
from PwC included: Member of the Securities and Futures<br />
Appeal Panel; Member of the Takeovers & Merger Panel;<br />
Member of the Takeovers Appeal Committee; Member of<br />
the Share Registrars’ Disciplinary Committee and Member<br />
of the Disciplinary Panel of the Hong Kong Institute of<br />
Certified Public Accountants. Mr. Allen holds a Bachelor of<br />
Arts degree in Economics/Social Studies from Manchester<br />
University, United Kingdom. He is a Fellow of the Institute<br />
of Chartered Accountants in England and Wales and a<br />
member of the Hong Kong Institute of Certified Public<br />
Accountants. He was appointed an Independent<br />
non-executive Director in November 2009 and is aged 56.<br />
Independent non-executive<br />
Director (A, N, S, chairing R)<br />
Philip Yan Hok FAN<br />
Mr. Fan is a non-executive director of China Everbright<br />
International <strong>Limited</strong>, an independent non-executive<br />
director of HKC (Holdings) <strong>Limited</strong>, an independent director<br />
of Zhuhai Zhongfu Enterprise Co. Ltd. and Goodman<br />
Group. Mr. Fan holds a Bachelor’s Degree in Industrial<br />
Engineering and a Master’s Degree in Operations Research<br />
from Stanford University, as well as a Master’s Degree in<br />
Management Science from Massachusetts Institute of<br />
Technology. He was appointed Independent non-executive<br />
Director in January 2010. He is aged 62.<br />
Independent non-executive<br />
Director (R, N)<br />
Joseph Chung Yin POON<br />
Mr. Poon is group managing director and deputy chief<br />
executive officer of a private company and an independent<br />
non-executive director of AAC Technologies Holdings Inc.<br />
He was formerly managing director and deputy chief<br />
executive of Hang Seng Bank <strong>Limited</strong> and had held senior<br />
management posts in HSBC Group and a number of<br />
international renowned financial institutions. Mr. Poon is a<br />
member of the Board of Inland Revenue of Hong Kong<br />
Special Administrative Region and the Environment and<br />
Conservation Fund Investment Committee, also a<br />
committee member of the Chinese General Chamber of<br />
Commerce. He was the former chairman of Hang Seng<br />
Index Advisory Committee, Hang Seng Indexes <strong>Company</strong><br />
<strong>Limited</strong>. Mr. Poon holds a Bachelor of Commerce degree<br />
from the University of Western Australia, is a member of<br />
the Hong Kong Institute of Certified Public Accountants<br />
and the Institute of Chartered Accountants in Australia. He<br />
was appointed Independent non-executive Director in<br />
January 2010. He is aged 57.<br />
Overview<br />
Strategy in Action Corporate Governance Financial Statements and Valuation<br />
(A) Audit Committee (R) Remuneration Committee (N) Nomination Committee (S) Strategy Committee<br />
<strong>Hysan</strong> <strong>Annual</strong> <strong>Report</strong> <strong>2011</strong> 53
Board of Directors<br />
and Senior Management<br />
Non-executive Director<br />
Hans Michael JEBSEN<br />
B.B.S.<br />
Non-executive Director (R)<br />
Michael Tze Hau LEE<br />
Mr. Jebsen is chairman of Jebsen and <strong>Company</strong> <strong>Limited</strong> as<br />
well as a director of other Jebsen Group companies<br />
worldwide. He is also an independent non-executive<br />
director of The Wharf (Holdings) <strong>Limited</strong>. He was appointed<br />
a Non-executive Director in 1994 and is aged 55.<br />
Non-executive Director (A)<br />
Anthony Hsien Pin LEE<br />
Mr. Lee is a director and substantial shareholder of the<br />
Australian-listed Beyond International <strong>Limited</strong>, principally<br />
engaged in television programme production and<br />
international sales of television programmes and feature<br />
films. He is also a non-executive director of Television<br />
Broadcasts <strong>Limited</strong>. He received a Bachelor of Arts Degree<br />
from Princeton University and a Master of Business<br />
Administration Degree from The Chinese University of Hong<br />
Kong. Mr. Lee is a member of the founding Lee family, the<br />
brother of Ms. Irene Yun Lien LEE and a director of Lee<br />
<strong>Hysan</strong> Estate <strong>Company</strong>, <strong>Limited</strong> (a substantial shareholder<br />
of the <strong>Company</strong>). He was appointed a Non-executive<br />
Director in 1994 and is aged 54.<br />
Non-executive Director (N, S)<br />
Chien LEE<br />
Mr. Lee is a private investor and a non-executive director of<br />
Swire Pacific <strong>Limited</strong> and Television Broadcasts <strong>Limited</strong><br />
and a number of private companies. He is a member of<br />
the founding Lee family and a director of Lee <strong>Hysan</strong> Estate<br />
<strong>Company</strong>, <strong>Limited</strong>, a substantial shareholder of the<br />
<strong>Company</strong>. Mr. Lee received a Bachelor of Science Degree<br />
in Mathematical Science, a Master of Science Degree in<br />
Operations Research and a Master of Business<br />
Administration Degree from Stanford University. Mr. Lee<br />
was appointed a Non-executive Director in 1988 and is<br />
aged 58.<br />
Mr. Lee is currently the managing director of MAP Capital<br />
<strong>Limited</strong>, an investment management company. He is also<br />
an independent non-executive director of Hong Kong<br />
Exchanges and Clearing <strong>Limited</strong>, Chen Hsong Holdings<br />
<strong>Limited</strong>, Trinity <strong>Limited</strong>; and a Steward of The Hong Kong<br />
Jockey Club. Mr. Lee was an independent non-executive<br />
director of Tai Ping Carpets International <strong>Limited</strong> and a<br />
member of the Main Board and Growth Enterprise Market<br />
Listing Committees of The Stock Exchange of Hong Kong<br />
<strong>Limited</strong>. Mr. Lee is a member of the founding Lee family<br />
and a director of Lee <strong>Hysan</strong> Estate <strong>Company</strong>, <strong>Limited</strong>, a<br />
substantial shareholder of the <strong>Company</strong>. He joined the<br />
Board in January 2010 having previously served as a<br />
Director from 1990 to 2007. Mr. Lee received his Bachelor<br />
of Arts Degree from Bowdoin College and his Master of<br />
Business Administration Degree from Boston University.<br />
He is aged 50.<br />
Executive Director and<br />
<strong>Company</strong> Secretary<br />
Wendy Wen Yee YUNG<br />
Ms. Yung joined the Group in 1999 and was appointed an<br />
Executive Director in 2008. She advises the Board on all<br />
matters of corporate governance, and is responsible for<br />
the Group’s shareholder communications and key<br />
stakeholder relations management. In addition, she has an<br />
oversight of all aspects of the Group’s legal matters. As a<br />
member of the management team, she participates in the<br />
Group’s strategic planning matters. Ms. Yung holds a<br />
Master of Arts degree from Oxford University, United<br />
Kingdom and is qualified as a solicitor of the Supreme<br />
Court of England and Wales as well as High Court of Hong<br />
Kong. She was a partner of an international law firm prior<br />
to joining the Group. Ms. Yung is also qualified as a<br />
Certified Public Accountant of the Hong Kong Institute of<br />
Certified Public Accountants, and sits on the Institute’s<br />
Professional Accountants in Business Leadership Panel.<br />
Her public services include serving as a member of the<br />
Securities and Futures Appeal Panel, and a member of the<br />
Hong Kong Selection Committee of the Rhodes<br />
Scholarships. She is aged 50.<br />
(A) Audit Committee (R) Remuneration Committee (N) Nomination Committee (S) Strategy Committee<br />
54<br />
<strong>Hysan</strong> <strong>Annual</strong> <strong>Report</strong> <strong>2011</strong>
Overview<br />
Senior management team (from left)<br />
Lai Kiu CHAN Wendy Wen Yee YUNG Gerry Lui Fai YIM Cissy Ching Sze CHAN Roger Shu Yan HAO<br />
Director, Retail Portfolio and Marketing<br />
Cissy Ching Sze CHAN<br />
Ms. Chan is responsible for the Group’s retail portfolio and<br />
related marketing activities. She joined the Group in 2008.<br />
Ms. Chan received a Master of Business Administration<br />
Degree from the Chinese University of Hong Kong and a<br />
Bachelor of Social Science Degree from the University of<br />
Hong Kong. She gained substantial general management<br />
experience in multinational companies while holding senior<br />
positions, with particular expertise in sales and marketing.<br />
She is aged 46.<br />
Director, Design and Project<br />
Lai Kiu CHAN<br />
Ms. Chan oversees the Group’s design and project affairs.<br />
She joined the Group in 2008. Ms. Chan holds a Doctor of<br />
Philosophy Degree in Architecture from the University of<br />
Hong Kong. She qualified as a PRC Class 1 Registered<br />
Architect, is a Registered Architect of Architects<br />
Registration Board of Hong Kong, and is also an<br />
Authorised Person (Architect) in Hong Kong. Ms. Chan has<br />
received various international and local awards for<br />
architectural designs. She is aged 49.<br />
Chief Financial Officer<br />
Roger Shu Yan HAO<br />
Mr. Hao is responsible for the Group’s financial control,<br />
treasury and information technology function. He joined the<br />
Group in 2008. Mr. Hao received a Bachelor’s Degree in<br />
Business Administration from the Chinese University of<br />
Hong Kong, and is a Chartered Accountant with the<br />
Institute of Chartered Accountants in England and Wales, a<br />
Fellow of the Association of Chartered Certified<br />
Accountants and an Associate of the Hong Kong Institute<br />
of Certified Public Accountants. Mr. Hao accumulated<br />
extensive experience in auditing, financial management<br />
and control, while holding senior positions in multinational<br />
corporations. He is aged 46.<br />
Strategy in Action Corporate Governance Financial Statements and Valuation<br />
<strong>Hysan</strong> <strong>Annual</strong> <strong>Report</strong> <strong>2011</strong> 55
Corporate Governance <strong>Report</strong><br />
Refreshing of the Board and Board Leadership<br />
<strong>Hysan</strong> believes that embracing strong governance is the foundation to delivering on its<br />
strategic objective of consistent and sustainable performance over the long term. At the heart<br />
of <strong>Hysan</strong>’s governance structure is an effective Board that is committed to upholding strong<br />
governance principles and to reinforcing <strong>Hysan</strong>’s long-established and deeply engrained<br />
corporate governance tradition and culture of accountability, transparency and integrity.<br />
We recognise the importance of having a broad complement of skills, experience and<br />
competencies on our Board to ensure the continued effective oversight of, and informed<br />
decision making with respect to, issues affecting <strong>Hysan</strong>. We are committed to continuing Board<br />
renewal to ensure that the Board is infused with fresh perspectives from time to time and that<br />
it always has the necessary skills and attributes required to oversee and govern in the<br />
ever-changing operating environment. Since October 2009, six Non-executive Directors with<br />
backgrounds in the areas of finance, general management and professional practices have<br />
joined our Board. Irene Yun Lien LEE was appointed Non-executive Chairman in May <strong>2011</strong>,<br />
succeeding Sir David AKERS-JONES who has served the Board for over 20 years in a number of<br />
capacities.<br />
Gerry Lui Fai YIM, Chief Executive Officer, has resigned from the Board effective as from the<br />
conclusion of the <strong>Annual</strong> General Meeting (“AGM”) to be held on 14 May 2012. Effective<br />
8 March 2012, the Chairman will assume an executive capacity. In addition to her role in<br />
leading the Board, she will advise, support and coach the management team, particularly<br />
regarding the long-term strategic development of the Group and management matters that<br />
drive shareholder value. Siu Chuen LAU, currently Non-executive Director, will be appointed<br />
Non-executive Deputy Chairman at the same time, to deputize and support the Chairman in<br />
her Board leadership role.<br />
Meeting and Exceeding Compliance Requirements<br />
<strong>Hysan</strong> meets the requirements of the Code Provisions contained in the Code on Corporate<br />
Governance Practices (the “Corporate Governance Code”) set out in Appendix 14 of the Rules<br />
Governing the Listing of Securities (the “Listing Rules”) on The Stock Exchange of Hong Kong<br />
<strong>Limited</strong> (the “HKSE”), with the exception that its Remuneration Committee (established since<br />
1987) has the responsibility of determining compensation at Executive Director-level only. The<br />
Board is of the view that, in light of the current organisational structure and the nature of<br />
<strong>Hysan</strong>’s business activities, this arrangement is appropriate. However, the Board will continue<br />
to review this arrangement going forward in light of the evolving needs of the Group. The Board<br />
has reviewed the composition of the Remuneration Committee. Philip Yan Hok FAN and<br />
Joseph Chung Yin POON, both being Independent non-executive Directors, were appointed<br />
Committee chairman and member respectively in March 2012. The other member is<br />
Michael Tze Hau LEE, Non-executive Director.<br />
<strong>Hysan</strong>’s system of corporate governance practices exceed the Corporate Governance Code in a<br />
number of key areas, some of which are contained in the new Code Provisions effective 1 April<br />
2012 (“New April Code Provisions”).<br />
56<br />
<strong>Hysan</strong> <strong>Annual</strong> <strong>Report</strong> <strong>2011</strong>
Exceeded<br />
Code Provisions<br />
✓<br />
✓<br />
✓<br />
✓<br />
✓<br />
✓<br />
✓<br />
✓<br />
✓<br />
✓<br />
✓<br />
✓<br />
✓<br />
✓<br />
✓<br />
✓<br />
Best Practices in Corporate Governance in Place at <strong>Hysan</strong><br />
The Board first established a formal Corporate Governance Policy* in 2004.<br />
(It is a New April Code Provision that the Board takes special responsibilities for corporate governance.)<br />
The Board has established formal mandates and responsibilities* for itself, with a clear division of roles<br />
with management. The Board’s responsibilities in the formulation of strategy, in addition to its monitoring<br />
function, are expressly provided for.<br />
The Board has established formal criteria and requirements* for Non-executive Director appointments.<br />
Newly appointed Non-executive Directors are given formal letters of appointment, which address (among<br />
other things) the expected time commitment of the Non-executive Director.<br />
(Time commitment of directors is a New April Code Provision.)<br />
Board evaluation: The Chairman and Non-executive Directors meet at regularly scheduled sessions without<br />
management presence.<br />
(Board evaluation is a recommended best practice as from April 2012.)<br />
We have three Corporate Governance-related Committees, being the Audit Committee, Remuneration<br />
Committee and Nomination Committee. The Terms of Reference* of each Corporate Governance<br />
Committee provides for in-camera meetings without management presence to further encourage objective<br />
and independent discussions and assessment. The Audit, Remuneration, and Nomination Committees<br />
currently have a majority of Independent non-executive Directors.<br />
(Formation of a nomination committee is a New April Code requirement.)<br />
The Audit Committee meets the external auditors twice annually without management presence.<br />
(Such meeting frequency is a New April Code requirement.)<br />
The Group has a written Code of Ethics* applicable to all staff and Directors. Monitoring of the “whistle<br />
blowing” mechanism is performed by an external independent third party provider to further enhance<br />
independence. Such service provider reports directly to the Audit Committee.<br />
(The establishment of a “whistle blowing” policy is a proposed recommended best practice effective<br />
April 2012.)<br />
The Group has established a Code for Securities Dealing applicable to those employees likely to have<br />
access to unpublished price-sensitive information.<br />
The Group has established a Corporate Disclosure Policy* to guide its stakeholder communications and the<br />
determination of price sensitive information in order to ensure consistent and timely disclosure and<br />
fulfillment of the Group’s continuous disclosure obligations.<br />
The Group has established an Auditor Service Policy* to identify areas of conflict and prohibit the<br />
engagement of auditors in such areas to ensure objectivity and independence.<br />
The Group has demonstrated its commitment to transparency in shareholder reporting by publishing a<br />
separate Corporate Governance <strong>Report</strong> since 2001. It also publishes the following reports: (i) Audit<br />
Committee <strong>Report</strong>; (ii) Directors’ Remuneration and Interests <strong>Report</strong>; and (iii) Internal Controls and Risk<br />
Management <strong>Report</strong>.<br />
The Group has a formal Corporate Responsibility Policy and publishes a separate Corporate Responsibility<br />
<strong>Report</strong>.<br />
Since 2004, the Group has operated a new form of AGM that goes beyond discharging statutory business<br />
by including a detailed business review. All voting at AGMs has been conducted by poll since 2004.<br />
The Group has initiated and funded a programme inviting major nominee companies to proactively forward<br />
communication materials to the ultimate beneficial shareholders at the Group’s expense.<br />
In 2012, the Group published its annual results within 70 days, well within the required time period of three<br />
months from the end of accounting period.<br />
The Group continually enhances the use of its corporate website as a means of communication with<br />
shareholders. Principal corporate governance policies, guidelines, and terms of reference of the Corporate<br />
Governance Committees are posted and publicly available.<br />
Overview<br />
Strategy in Action Corporate Governance Financial Statements and Valuation<br />
* Detailed policies/terms of reference are available on the <strong>Company</strong>’s website: www.hysan.com.hk.<br />
<strong>Hysan</strong> <strong>Annual</strong> <strong>Report</strong> <strong>2011</strong> 57
Corporate Governance <strong>Report</strong><br />
What the Board has done during <strong>2011</strong><br />
During the year, 4 Board meetings were held. The focus of these meetings included the following topics of discussion<br />
and yielded the following results:<br />
1.<br />
Leadership<br />
• appointment of Non-executive Chairman<br />
• appointments of new Board members who<br />
bring new insights to the Board<br />
• reviewed composition of Board Committees<br />
2.<br />
Strategy<br />
• reviewed strategic plans for the Group’s core<br />
leasing (Office, Retail, and Residential segments)<br />
to meet short-term objectives and to strengthen<br />
medium-term competitiveness<br />
• ongoing assessment of <strong>Hysan</strong> Place project, with<br />
a view to enabling it to take the Group to another<br />
level of commercial success and sustainability<br />
• reviewed the positioning of our core property<br />
portfolio in Causeway Bay as a choice location<br />
for work and play; and management’s plan to<br />
further strengthen its branding and marketing<br />
• reviewed further opportunities in our core<br />
property portfolio with management<br />
Roles of Board<br />
• Strategic Planning<br />
• Internal Controls and<br />
Risk Management<br />
• Culture and Values<br />
• Capital Management<br />
• Corporate Governance<br />
• Board Succession<br />
3.<br />
Risk Management<br />
• Audit Committee received presentation on best<br />
practices in risk management and endorsed<br />
management’s plans to further strengthen the<br />
risk identification and assessment process, and<br />
to adopt more frequent and structured reporting<br />
to the Audit Committee and the Board<br />
• assessed effectiveness of financial controls, and<br />
other internal controls<br />
(Please refer to separate “Internal Controls and<br />
Risk Management <strong>Report</strong>”)<br />
• legal and regulatory compliance added as<br />
standing item for each Board meeting<br />
4.<br />
Relations with Shareholders<br />
• investor relations added as standing item<br />
for each Board meeting<br />
• investor relations reports describing<br />
investor and analyst opinions are provided<br />
regularly to the Board<br />
• enhanced investor relations programme to<br />
expand coverage by analysts<br />
58<br />
<strong>Hysan</strong> <strong>Annual</strong> <strong>Report</strong> <strong>2011</strong>
Governance Framework<br />
The Group operates within a clear governance structure, which is illustrated in the diagram that<br />
follows.<br />
Overview<br />
Shareholders<br />
Auditors<br />
Board of Directors<br />
Management<br />
Audit<br />
Committee<br />
Remuneration<br />
Committee<br />
Nomination<br />
Committee<br />
Strategy<br />
Committee<br />
We also ensure the presence of a capable and qualified Board with diverse backgrounds and<br />
skills. Over the years, the Board has developed, maintained and continues to supplement a<br />
robust set of governance policies and procedures as the basis of our governance system.<br />
<strong>Hysan</strong>’s governance framework serves as a guide for the Board and management in the<br />
performance and fulfillment of their respective obligations to <strong>Hysan</strong> and its stakeholders. The<br />
guidelines, policies, and procedures which form this framework (as listed below) work together<br />
to ensure the existence of a capable and qualified Board with diverse backgrounds and skills,<br />
the establishment of appropriate roles for the Board and various committees, and a<br />
collaborative and constructive relationship between the Board and management.<br />
As part of its ongoing review, the Board regularly assesses and enhances its governance<br />
practices and principles in light of regulatory regimes, international best practices, as well as<br />
<strong>Company</strong> needs.<br />
The following constitute key components of <strong>Hysan</strong>’s governance framework. They are posted on<br />
the <strong>Company</strong>’s website: www.hysan.com.hk.<br />
• Corporate Governance Guidelines<br />
• Board of Directors Mandate<br />
• Roles Requirements of Non-executive Directors<br />
• Terms of Reference of the various corporate governance related Board Committees<br />
• Code of Ethics for Employees<br />
• Auditor Service Policy<br />
• Corporate Disclosure Policy<br />
These are reviewed periodically and a comprehensive review is scheduled for early 2012 in<br />
light of Board changes and the coming on board of Executive Chairman and Non-executive<br />
Deputy Chairman as from March.<br />
Strategy in Action Corporate Governance Financial Statements and Valuation<br />
<strong>Hysan</strong> <strong>Annual</strong> <strong>Report</strong> <strong>2011</strong> 59
Corporate Governance <strong>Report</strong><br />
Board Leadership<br />
Board Size and Composition<br />
During the year, there are eleven Directors on the Board throughout: the Chairman, eight other<br />
Non-executive Directors (including three Independent non-executive Directors) and two<br />
Executive Directors. The roles of the Chairman and the Chief Executive Officer are currently<br />
separate. The Board will review its size and composition from time to time to ensure there is<br />
an appropriate and diverse mix of skills and experience.<br />
During the year, the following changes were made:<br />
• Sir David AKERS-JONES stepped down from the conclusion of the AGM held on 9 May <strong>2011</strong><br />
and was succeeded by Irene Yun Lien LEE.<br />
• Deanna Ruth Tak Yung RUDGARD also stepped down as Non-executive Director and<br />
Siu Chuen LAU was appointed Non-executive Director as from the conclusion of the <strong>2011</strong><br />
AGM.<br />
Further description of the backgrounds of the Non-executive Directors is set out in the section<br />
“Board Effectiveness – Skills and Balance” below.<br />
Non-executive Directors are appointed for a term of 3 years and are required to submit their<br />
candidacy for re-election at the first AGM following their appointment. Under the Group’s<br />
Articles of Association, every Director will be subject to retirement by rotation at least once<br />
every 3 years. Retiring Directors are eligible for re-election at the AGM at which he retires.<br />
There is no cumulative voting in Director elections. The election of each candidate is done<br />
through a separate resolution.<br />
At the AGM to be held on 14 May 2012, Nicholas Charles ALLEN, Philip Yan Hok FAN,<br />
Anthony Hsien Pin LEE and Siu Chuen LAU will retire and, being eligible, offer themselves for<br />
re-election. Gerry Lui Fai YIM will not seek re-election and will step down from the Board.<br />
Details with respect to the candidates standing for election as Directors are set out in the<br />
AGM circular to shareholders.<br />
60<br />
<strong>Hysan</strong> <strong>Annual</strong> <strong>Report</strong> <strong>2011</strong>
Board and Management<br />
At the core of our governance structure is our Board, which is accountable to shareholders for<br />
the long-term performance of the <strong>Company</strong>.<br />
The Board relies on management for the day-to-day operation of the business. It monitors what<br />
management is doing, and holds them accountable for the performance of the <strong>Company</strong> as<br />
measured against established targets. In terms of strategy formulation, the Board works<br />
closely with management in thinking through our direction and long-term plans, as well as the<br />
various opportunities and risks associated therewith and facing the <strong>Company</strong> generally.<br />
Overview<br />
The Non-executive Directors provide independent challenge and review, bringing a wide range of<br />
experiences, specific expertise, and fresh objective perspectives. As members of the various<br />
Board committees, they also undertake detailed governance work with a particular focus as<br />
noted under the respective terms of reference of the various Board committees.<br />
The Board and management fully appreciate their respective roles and are supportive of the<br />
development and maintenance of a healthy corporate governance culture.<br />
The role of the Board is governed by a formal Board of Directors Mandate (details are also<br />
available on the <strong>Company</strong>’s website: www.hysan.com.hk), which sets out the key<br />
responsibilities of the Board in fulfilling its stewardship roles. These are strategic planning,<br />
internal controls and risk management, culture and values, capital management, corporate<br />
governance, and Board succession.<br />
Best Corporate Governance Disclosure<br />
Awards <strong>2011</strong>: Non-Hang Seng Index<br />
(Large Market Capitalisation)<br />
Category – Platinum Award<br />
Organised by the Hong Kong Institute of Certified<br />
Public Accountants<br />
“The company’s mission and values prefaced the report, with its<br />
aim to be a responsible business, fostering the highest standard<br />
of ethics and accountability and developing thought leadership and<br />
partnerships with stakeholders, whilst giving back to the<br />
community.”<br />
- Judges’ <strong>Report</strong><br />
Strategy in Action Corporate Governance Financial Statements and Valuation<br />
<strong>Hysan</strong> <strong>Annual</strong> <strong>Report</strong> <strong>2011</strong> 61
Corporate Governance <strong>Report</strong><br />
Schedule of Corporate Matters Reserved for the Board<br />
A detailed list of Matters Reserved for Board Decisions sets out the key matters that are to<br />
be retained for the decision of the full Board. These include the following:<br />
General<br />
• Long term objectives and strategies<br />
• Extension of activities into new business areas / cease to operate any material part of<br />
existing business<br />
Structure and capital<br />
• Capital management framework and policy; material changes to capital structure<br />
• Changes to the <strong>Company</strong>’s listing status<br />
Financial reporting and controls<br />
• Announcements of results; annual report and accounts; dividends<br />
• Treasury policies; annual funding plan and annual treasury investment plan<br />
• Material banking facilities; material treasury investment transactions<br />
• <strong>Annual</strong> operating and capital expenditure budgets<br />
• Material acquisitions / disposals of fixed assets<br />
Internal controls and risk management<br />
Approval of resolutions and corresponding documentation for shareholder approval<br />
Board membership and other appointments<br />
Remuneration<br />
• Remuneration policy for Chairman, Executive Directors; and non-executive director fee<br />
• New share incentive plans or major changes<br />
• Major changes to rules of pension scheme<br />
• Key terms of new compensation and benefit plans with material financial, reputational or<br />
strategic impact<br />
Delegation of authority by Board<br />
Corporate governance matters<br />
Major prosecution, defence or settlement of litigation<br />
Where applicable, “materiality” thresholds are set at appropriate levels to ensure proper<br />
control while allowing for smooth day-to-day operations to be carried out by management.<br />
These thresholds are subject to review periodically and in any event, at least once a year.<br />
62<br />
<strong>Hysan</strong> <strong>Annual</strong> <strong>Report</strong> <strong>2011</strong>
Board Effectiveness<br />
Skills and Balance<br />
During <strong>2011</strong>, we have 9 Non-executive Directors, drawn from diverse and complementary<br />
backgrounds:<br />
Overview<br />
Primary Background<br />
General management<br />
Finance and investment<br />
Names<br />
Philip Yan Hok FAN, Irene Yun Lien LEE,<br />
Joseph Chung Yin POON<br />
Chien LEE, Anthony Hsien Pin LEE, Irene Yun Lien LEE,<br />
Joseph Chung Yin POON, Michael Tze Hau LEE,<br />
Siu Chuen LAU<br />
Consumer products,<br />
marketing and distribution<br />
Professional<br />
Hans Michael JEBSEN, Siu Chuen LAU<br />
Nicholas Charles ALLEN (accounting)<br />
(Directors’ full biographies are set out on pages 52 to 54 and are also available on the <strong>Company</strong>’s website:<br />
www.hysan.com.hk.)<br />
Independence<br />
The Board has established “independence” standards as contained in our Corporate<br />
Governance Guidelines. It considers “independence” to be a matter of judgment and<br />
conscience. A Director is considered to be independent only where he or she is free from any<br />
business or other relationship that might interfere with the exercise of his or her independent<br />
judgment.<br />
The Board makes a determination concerning the “independence” of a Director each year at<br />
the time the Board approves Director nominees for inclusion in the AGM circular. If a Director<br />
joins the Board mid-year, the Board makes a determination on the new Director’s independence<br />
at that time. Independent non-executive Directors are identified in our <strong>Annual</strong> and Interim<br />
<strong>Report</strong>s and other communications with shareholders.<br />
The Board carried out a detailed review of director independence in March 2012. It concluded<br />
that each of the 3 Independent non-executive Directors was independent as at that time. The<br />
Board will continually monitor and review whether there are relationships or circumstances that<br />
are likely to affect (or could appear to affect) independence.<br />
Strategy in Action Corporate Governance Financial Statements and Valuation<br />
<strong>Hysan</strong> <strong>Annual</strong> <strong>Report</strong> <strong>2011</strong> 63
Corporate Governance <strong>Report</strong><br />
Independence Status<br />
Name<br />
Sir David AKERS-JONES<br />
(up to 9 May <strong>2011</strong>)<br />
Nicholas Charles ALLEN<br />
Philip Yan Hok FAN<br />
Hans Michael JEBSEN<br />
Siu Chuen LAU<br />
Anthony Hsien Pin LEE<br />
Chien LEE<br />
Irene Yun Lien LEE<br />
Michael Tze Hau LEE<br />
Joseph Chung Yin POON<br />
Dr. Deanna Ruth Tak Yung<br />
RUDGARD<br />
(up to 9 May <strong>2011</strong>)<br />
Gerry Lui Fai YIM<br />
Wendy Wen Yee YUNG<br />
Not March 2012 Review-<br />
Management Independent Independent Reason for Independence Status<br />
✓<br />
N/A<br />
✓<br />
✓<br />
✓<br />
✓<br />
✓<br />
✓<br />
✓<br />
✓<br />
✓<br />
✓<br />
✓<br />
✓<br />
No business or other relationships<br />
with the Group or management<br />
No business or other relationships<br />
with the Group or management<br />
No business or other relationships<br />
with the Group or management<br />
Supply of Information<br />
The Board recognises the significance of providing timely and relevant information to<br />
Non-executive Directors so as to enable them to discharge their duties effectively.<br />
The Board regularly receives presentations, including from non-Board management members,<br />
on significant issues or new opportunities for the Group. This also facilitates the build-up of<br />
constructive relations and dialogue between the Board and the management team.<br />
Supply and access to information<br />
The Board receives detailed quarterly reports from members of management in respect of their<br />
areas of responsibility. Appropriate key performance indicators are used to facilitate<br />
benchmarking and peer group comparison. Financial plans, including budgets and forecasts,<br />
are regularly discussed at Board meetings. Monthly reports to Non-executive Directors are<br />
issued, covering financial and operating highlights.<br />
Directors are also kept updated of any material developments from time to time through<br />
notifications and circulars detailing the relevant background and explanatory information.<br />
Directors also have access to non-Director members of management and staff where<br />
appropriate. Collectively, these processes ensure that the Board receives the answers and<br />
information it needs to fulfill its obligations.<br />
64<br />
<strong>Hysan</strong> <strong>Annual</strong> <strong>Report</strong> <strong>2011</strong>
Independent Advice<br />
The Board recognises that there may be occasions when one or more Directors feel that it is<br />
necessary to obtain independent legal and/or financial advice for the purposes of fulfilling their<br />
obligations. Such advice may be obtained at the <strong>Company</strong>’s expense and there is an agreed<br />
upon procedure to enable Directors to obtain such advice, as stated in our Corporate<br />
Governance Guidelines.<br />
Overview<br />
Induction, Business Awareness and <strong>Development</strong><br />
Upon their appointment, Directors are advised on the legal and other duties and obligations<br />
they have as directors of a listed company. Newly appointed Directors receive a comprehensive<br />
induction package designed to provide a general understanding of the Group, its businesses,<br />
the operations of the Board and the main issues it faces, as well as an overview of the<br />
additional responsibilities of Non-executive Directors. Discussion sessions with key members<br />
of management are also held.<br />
Through the course of their directorship, Directors are updated on any developments or<br />
changes affecting the <strong>Company</strong> and their obligations to it at regular Board meetings.<br />
In order to ensure that Directors continue to further their understanding of the issues facing<br />
the Group, we shall further strengthen the provision of management presentations, visits, and<br />
training sessions to our Directors. These will include visits to our property portfolio,<br />
presentations on market environment affecting the property leasing industry, and expert<br />
presentations on regulatory issues.<br />
Evaluation<br />
<strong>Hysan</strong> evaluates the performance of the Board and members of management at meetings<br />
between the Chairman and Non-executive Directors without the presence of management.<br />
The table overleaf sets out the number of meetings of the Board and its committees in <strong>2011</strong>,<br />
individual attendance by Board and committee members at these meetings and the<br />
attendance of the Board members at the <strong>2011</strong> AGM.<br />
Strategy in Action Corporate Governance Financial Statements and Valuation<br />
<strong>Hysan</strong> <strong>Annual</strong> <strong>Report</strong> <strong>2011</strong> 65
Corporate Governance <strong>Report</strong><br />
Audit Remuneration Strategy<br />
Directors Board Committee Committee Committee AGM<br />
(Notes 1, 2) (Note 1) (Note 1) (Note 3) (Notes 1, 2)<br />
Executive<br />
Gerry Lui Fai YIM 4/4 3/3 1/1<br />
Wendy Wen Yee YUNG 4/4 2/2 1/1<br />
(as attendee)<br />
Independent non-executive<br />
Sir David AKERS-JONES (Note 4) 2/2 2/2 1/1 1/1<br />
Nicholas Charles ALLEN 4/4 4/4 3/3 1/1<br />
Philip Yan Hok FAN 4/4 4/4 2/2 3/3 1/1<br />
Joseph Chung Yin POON 3/4 2/2 1/1<br />
(as attendee)<br />
Non-executive<br />
Hans Michael JEBSEN 4/4 1/2 1/1<br />
(1 by alternate) (as attendee)<br />
Irene Yun Lien LEE 3/3 3/3 1/1<br />
Siu Chuen LAU 2/2 3/3 –<br />
Anthony Hsien Pin LEE 4/4 4/4 1/2 1/1<br />
(as attendee)<br />
Michael Tze Hau LEE 4/4 2/2 2/2 1/1<br />
(as attendee)<br />
Chien LEE 4/4 3/3 1/1<br />
Dr. Deanna Ruth Tak Yung RUDGARD 2/2 – 1/1<br />
(Note 4)<br />
(1 by alternate)<br />
Notes:<br />
1. The attendance figure represents actual attendance / the number of meetings a Director is entitled to attend.<br />
2. On 9 March <strong>2011</strong> and 9 May <strong>2011</strong>, Irene Yun Lien LEE and Siu Chuen LAU were appointed Directors<br />
respectively.<br />
3. The Strategy Committee convened its first meeting in March <strong>2011</strong>. Invitation to attend was extended to all<br />
Board members as from May <strong>2011</strong> onwards.<br />
4. Sir David AKERS-JONES stepped down as Board Chairman, Chairman of the Remuneration Committee,<br />
Nomination Committee and Strategy Committee on 9 May <strong>2011</strong>. Dr. Deanna Ruth Tak Yung RUDGARD<br />
stepped down as a Director on 9 May <strong>2011</strong>.<br />
Board Committees in <strong>2011</strong><br />
In order to provide effective oversight and leadership and pursuant to its Corporate Governance<br />
Guidelines, the Board has established 3 governance-related Board Committees as detailed<br />
below. Like the Board, each Committee has access to independent advice and counsel as<br />
required and each is supported by the <strong>Company</strong> Secretary. The terms of reference of these<br />
Committees are available on the <strong>Company</strong>’s website.<br />
In addition, the Board established a Strategy Committee to review the long-term strategy of the<br />
Group. It is currently chaired by Irene Yun Lien LEE, Board Chairman, and its other members<br />
are Nicholas Charles ALLEN, Philip Yan Hok FAN, Siu Chuen LAU, Chien LEE and Gerry Lui Fai YIM<br />
(Chief Executive Officer). During the year, 3 meetings were held, with invitations extended to all<br />
Board members as from May <strong>2011</strong>.<br />
66<br />
<strong>Hysan</strong> <strong>Annual</strong> <strong>Report</strong> <strong>2011</strong>
Audit Committee<br />
Composition and Meetings Schedule<br />
The Audit Committee is currently chaired by Nicholas Charles ALLEN (Independent<br />
non-executive Director), and its other members are Anthony Hsien Pin LEE and Philip<br />
Yan Hok FAN. There is an overall majority of Independent non-executive Directors. Nicholas<br />
Charles ALLEN (Chairman) is a Fellow of the Institute of Chartered Accountants in England and<br />
Wales and a member of the Hong Kong Institute of Certified Public Accountants. He has<br />
extensive experience in auditing and accounting, which he developed while working with a “Big<br />
Four” international firm. The Audit Committee had four meetings during the year and will have<br />
three scheduled meetings as for 2012. At the invitation of the Audit Committee, meetings are<br />
also attended by the Chairman and members of management (including the Chief Executive<br />
Officer and Chief Financial Officer).<br />
Pre-meeting sessions<br />
with external and<br />
internal auditors held<br />
without management<br />
presence<br />
Overview<br />
Roles and Authority<br />
<strong>Hysan</strong> believes a clear appreciation of the separate roles of management, the external auditors<br />
and Audit Committee members is crucial to the effective functioning of an audit committee.<br />
Management of <strong>Hysan</strong> is responsible for selecting appropriate accounting policies and the<br />
preparation of the financial statements. Formal statements of responsibilities of Directors in<br />
relation thereto are contained elsewhere in this <strong>Annual</strong> <strong>Report</strong>. The external auditors are<br />
responsible for auditing and attesting to the Group’s financial statements and evaluating the<br />
Group’s system of internal controls, to the extent that they consider necessary to support their<br />
audit report. The Audit Committee is responsible for overseeing the entire process.<br />
The Audit Committee also has the responsibility of reviewing the Group’s “whistle-blowing”<br />
procedures allowing employees to raise concerns, in confidence or anonymously, about<br />
possible breaches of the Group’s Code of Ethics and to ensure that these arrangements allow<br />
proportionate and independent investigation of such matters and appropriate follow up action.<br />
Activities and <strong>Report</strong> in <strong>2011</strong> and to date<br />
Full details of the activities of the Audit Committee are also set out in the “Audit Committee<br />
<strong>Report</strong>” on pages 89 and 90. Four meetings were held during the year. Attendance of Audit<br />
Committee meetings is set out in the table on page 66. In addition to reviewing and approving<br />
annual and interim financial statements, the Committee has placed a focus on further<br />
strengthening our risk identification and assessment process, and adopting more frequent and<br />
structured internal controls and risk management reporting to the Committee and the Board.<br />
Strategy in Action Corporate Governance Financial Statements and Valuation<br />
<strong>Hysan</strong> <strong>Annual</strong> <strong>Report</strong> <strong>2011</strong> 67
Corporate Governance <strong>Report</strong><br />
Remuneration Committee (formerly titled Emoluments Review<br />
Committee)<br />
Composition and Meetings Schedule<br />
The Group established the Remuneration Committee in 1987 to review the compensation of<br />
Executive Directors. The current Remuneration Committee is chaired by Philip Yan Hok FAN,<br />
Independent non-executive Director. The other members of the Remuneration Committee are<br />
Michael Tze Hau LEE and Joseph Chung Yin POON (Independent non-executive Director,<br />
appointed in March 2012). It currently has an overall majority of Independent non-executive<br />
Directors. The Remuneration Committee generally meets at least once every year.<br />
In-camera meetings held<br />
without management<br />
presence<br />
Roles and Authority<br />
Management makes recommendations to the Remuneration Committee on <strong>Hysan</strong>’s framework<br />
for, and cost of, the remuneration of Executive Directors and the Committee then reviews<br />
these, and makes recommendations to the Board. The Remuneration Committee also reviews<br />
the remuneration fee payable to (where applicable) the Chairman and Non-executive Directors<br />
respectively prior to its being submitted for approval at the AGM. In addition, it also reviews<br />
new share option plans, changes to key terms of pension plans, and key terms of new<br />
compensation and benefits plans with material financial reputational and strategic impact. No<br />
Director is involved in deciding his or her own remuneration.<br />
Activities and <strong>Report</strong> in <strong>2011</strong> and to date<br />
Full details of the activities of the Remuneration Committee are set out in the “Directors’<br />
Remuneration and Interests <strong>Report</strong>” on pages 81 to 88. Two meetings were held during the<br />
year. Attendance of Remuneration Committee meetings is set out in the table on page 66.<br />
Nomination Committee<br />
Composition and Meetings Schedule<br />
The Board established a Nomination Committee in 2005. The Nomination Committee is<br />
currently chaired by Irene Yun Lien LEE, Chairman of the Board and has a majority of Independent<br />
non-executive Directors. The other members of the Nomination Committee during the year are<br />
Philip Yan Hok FAN and Chien LEE. Nicholas Charles ALLEN and Joseph Chung Yin POON, both<br />
Independent non-executive Directors, were appointed in March 2012. Gerry Lui Fai YIM (Chief<br />
Executive Officer) resigned from the Committee at the same time, in line with good corporate<br />
governance practices. It currently has a majority of Independent non-executive Directors. The<br />
Nomination Committee meets when it is considered necessary.<br />
Roles and Authority<br />
The Nomination Committee is responsible for nominating candidates, for Board approval, to fill<br />
Board vacancies as and when they arise, and for evaluating the balance of skills, knowledge<br />
and experience of the Board. The terms of reference of the Nomination Committee clearly set<br />
out that the Chairman of the Board shall not chair the Nomination Committee when it is<br />
dealing with the matter of succession of the chairmanship.<br />
68<br />
<strong>Hysan</strong> <strong>Annual</strong> <strong>Report</strong> <strong>2011</strong>
Shareholders<br />
The Board and management fully recognise the significance and importance of having a<br />
governance framework that protects shareholder rights and their exercise of the same. At the<br />
same time, we aim to continually improve our communications with shareholders and to obtain<br />
their feedback.<br />
Overview<br />
Communication with Shareholders<br />
Accountability to Shareholders and Corporate <strong>Report</strong>ing<br />
Disciplined measurement of our performance is an important aspect of our strategy to achieve<br />
long-term success. Recognising that we are accountable to our stakeholders, reporting<br />
financial and non-financial results in a transparent fashion is critical. A number of formal<br />
communication channels are used to account to shareholders for the performance of the<br />
Group. These include the <strong>Annual</strong> <strong>Report</strong> and Accounts, Interim <strong>Report</strong> and Accounts and press<br />
releases/announcements.<br />
<strong>Hysan</strong>’s corporate website provides an additional channel for shareholders and other<br />
interested parties to access information about the Group. The Group’s key corporate<br />
governance policies and supporting documents, including the terms of reference of the various<br />
Board Committees, as well as the Group’s financial reports, press releases and announcements<br />
are available on the website. Shareholders are given the option of electing to receive corporate<br />
communications by electronic means. We continue to review how to better utilise the<br />
<strong>Company</strong>’s website for the purposes of timely disclosure and to enhance transparency.<br />
Shareholders may raise enquiries to the Board by contacting the Group’s Investor Relations<br />
function.<br />
The analyst briefing on the annual results is one of the effective channels of our stakeholder engagement<br />
Strategy in Action Corporate Governance Financial Statements and Valuation<br />
<strong>Hysan</strong> <strong>Annual</strong> <strong>Report</strong> <strong>2011</strong> 69
Corporate Governance <strong>Report</strong><br />
Institutional Shareholders<br />
We are committed to maintaining a continuing open dialogue with institutional investors, fund<br />
managers and analysts as a means of developing their understanding of our strategy,<br />
operations, management and plans, and enabling them to raise any issues they may have. The<br />
<strong>Company</strong> has an ongoing programme of dialogue and meetings between Chief Executive Officer,<br />
Chief Financial Officer, and institutional investors, fund managers and analysts. At these<br />
meetings, a wide range of relevant issues, including strategy, performance, management and<br />
governance, are discussed within the constraints of information already made public. There are<br />
presentations to or conference calls with analysts and investors at the time of announcement<br />
of results. During the year, we have further strengthened our programme and extended the<br />
scope of our coverage of investors and analysts, including attending overseas investor<br />
roadshows. To provide more detailed knowledge of the Group, the <strong>Company</strong> also arranged<br />
analyst visits to <strong>Company</strong> sites. Investor relations reports describing investor and analyst<br />
opinions are provided regularly to the Board.<br />
Constructive Use of AGM<br />
The Board is equally interested in the concerns of private shareholders. The <strong>Company</strong><br />
Secretary, on behalf of the Board, oversees communication with these investors. The Board<br />
recognises the significance of the constructive use of AGMs as a means to enter into a<br />
dialogue with private shareholders based on the mutual understanding of objectives. Individual<br />
shareholders can put questions to the Chairman at the AGM. The Chairmen of the various<br />
Board Committees, as provided under their respective terms of references, attend AGMs to<br />
respond to any shareholder questions on the activities of those Committees.<br />
Since 2004, to enable shareholders to gain a better understanding of our business activities,<br />
we have included a “business review” session to our AGMs, in addition to the statutory part of<br />
the meeting. Topics covered at the last AGM included the business environment in 2010, a<br />
review of business activities, and the <strong>Company</strong>’s outlook for <strong>2011</strong>. The <strong>Company</strong> values the<br />
contributions of its shareholders during the question and answer session following the<br />
statutory part of the meeting.<br />
Corporate Disclosure Policy<br />
We recognise the significance of consistent disclosure practices aimed at accurate, timely and<br />
broadly disseminated disclosure of material information about <strong>Hysan</strong>. The Group’s Corporate<br />
Disclosure Policy provides guidance for coordinating the disclosure of material information to<br />
investors, analysts and media as well as our processes for results announcements. This policy<br />
also identifies who may speak on <strong>Hysan</strong>’s behalf, and outlines the responsibilities for<br />
communications with various stakeholders groups. (Details of the Corporate Disclosure Policy<br />
are available at the <strong>Company</strong>’s website: www.hysan.com.hk).<br />
70<br />
<strong>Hysan</strong> <strong>Annual</strong> <strong>Report</strong> <strong>2011</strong>
Shareholder Rights<br />
Self-funded Programme to Proactively Forward Shareholder<br />
Communication Materials via Nominee Companies<br />
Shareholders must be furnished with sufficient and timely information concerning the <strong>Company</strong><br />
and any material developments. There is currently no requirement in Hong Kong providing for<br />
mandatory forwarding of shareholder communication materials by nominee companies to<br />
beneficial shareholders. Since 2005, we have initiated and funded a programme inviting major<br />
nominee companies to proactively forward communication materials to shareholders at our<br />
expense.<br />
Overview<br />
Provision of Sufficient and Timely Information<br />
We recognise the significance of providing information to shareholders to enable them to make<br />
an informed assessment for the purposes of voting on each of the items put before<br />
shareholders at the AGM. Copies of the <strong>Annual</strong> <strong>Report</strong>, and financial statements and related<br />
papers were dispatched to shareholders over 30 days prior to the AGM (statutory requirement:<br />
21 days). Comprehensive information on each resolution to be proposed is also provided.<br />
Voting<br />
We recognise shareholders’ rights in exercising control proportionate to their equity ownership<br />
and we support the principle of voting by poll. Since 2004, the <strong>Company</strong> has conducted all<br />
voting at its AGMs by poll. The poll is conducted by the <strong>Company</strong>’s Registrars and scrutinised<br />
by the Group’s auditors. Procedures for conducting a poll are included in the circular to<br />
shareholders accompanying the Notice of AGM and are again explained to the general meeting<br />
prior to the taking of the poll. Poll results are announced and posted on the websites of both<br />
the HKSE and the <strong>Company</strong>.<br />
The AGM provides a good opportunity for communications with shareholders<br />
Strategy in Action Corporate Governance Financial Statements and Valuation<br />
<strong>Hysan</strong> <strong>Annual</strong> <strong>Report</strong> <strong>2011</strong> 71
Corporate Governance <strong>Report</strong><br />
Relevant Provisions in Articles of Association and Hong Kong Law<br />
Under the Articles of Association of the <strong>Company</strong> and Hong Kong Companies Ordinance,<br />
shareholders holding not less than 5% of the paid up capital of the <strong>Company</strong> (“5%<br />
Shareholder”) may convene an extraordinary general meeting by requisition stating the objects<br />
of the meeting, and deposit the signed requisition at the <strong>Company</strong>’s registered office (49/F,<br />
The Lee Gardens, 33 <strong>Hysan</strong> Avenue, Hong Kong. Attention: The <strong>Company</strong> Secretary). Any 5%<br />
Shareholder may also requisition for the circulation of resolutions to be moved at a general<br />
meeting; and circulation of statements regarding resolution proposed. The special documents<br />
should be deposited at the <strong>Company</strong>’s registered address as detailed above.<br />
Hong Kong Companies Ordinance also provides for shareholder approval of decisions concerning<br />
fundamental corporate changes, including amendments to the Articles of Association, and<br />
extraordinary transactions, including the transfer of all or a substantial part of a company’s<br />
assets.<br />
There are no limitations imposed by Hong Kong law or the Articles of Association on the right of<br />
non-residents or foreign persons to hold or vote on the <strong>Company</strong>’s shares other than those<br />
limitations that would generally apply to all shareholders.<br />
72<br />
<strong>Hysan</strong> <strong>Annual</strong> <strong>Report</strong> <strong>2011</strong>
Directors’ <strong>Report</strong><br />
The Directors submit their report together with the audited financial statements for the year ended 31 December <strong>2011</strong>, which<br />
were approved by the Board of Directors (the “Board”) on 8 March 2012.<br />
PRINCIPAL ACTIVITIES<br />
The principal activities of the Group continued throughout <strong>2011</strong> to be property investment, management and development.<br />
Details of the Group’s principal subsidiaries and associates as at 31 December <strong>2011</strong> are set out in notes 18 and 19<br />
respectively to the financial statements.<br />
The turnover and results of the Group are principally derived from leasing of investment properties located in Hong Kong. The<br />
Group’s turnover and results by operating segment are set out in note 5. A detailed review of the development of the business<br />
of the Group during the year, and likely future developments, is set out in Chairman’s Statement and Management’s Discussion<br />
and Analysis of this <strong>Annual</strong> <strong>Report</strong>.<br />
RESULTS AND APPROPRIATIONS<br />
The results of the Group for the year ended 31 December <strong>2011</strong> are set out in the consolidated income statement on page 94.<br />
An interim dividend of HK15 cents per share, amounting to approximately HK$159 million, was paid to shareholders during the<br />
year.<br />
The Board recommends the payment of a final dividend of HK64 cents per share with a scrip alternative to the shareholders<br />
on the register of members on 18 May 2012, absorbing approximately HK$678 million. The dividends proposed and paid for<br />
ordinary shares in respect of the full year <strong>2011</strong> will absorb approximately HK$837 million, the balance of the profit will be<br />
retained.<br />
RESERVES<br />
Movements during the year in the reserves of the Group and the <strong>Company</strong> are set out in the consolidated statement of changes<br />
in equity on pages 98 and 99 and note 33 to the financial statements respectively.<br />
INVESTMENT PROPERTIES<br />
All of the Group’s investment properties were revalued by an independent professional valuer as at 31 December <strong>2011</strong> using<br />
the fair value model. Details of movements during the year in the investment properties of the Group are set out in note 16 to<br />
the financial statements.<br />
Details of the major investment properties of the Group as at 31 December <strong>2011</strong> are set out in the section under Schedule of<br />
Principal Properties of this <strong>Annual</strong> <strong>Report</strong>.<br />
PROPERTY, PLANT AND EQUIPMENT<br />
Details of movements during the year in the property, plant and equipment of the Group and the <strong>Company</strong> are set out in note 17<br />
to the financial statements.<br />
SHARE CAPITAL<br />
Details of movements in the share capital of the <strong>Company</strong> during the year are set out in note 32 to the financial statements.<br />
Overview<br />
Strategy in Action Corporate Governance Financial Statements and Valuation<br />
<strong>Hysan</strong> <strong>Annual</strong> <strong>Report</strong> <strong>2011</strong><br />
73
Directors’ <strong>Report</strong> continued<br />
CORPORATE GOVERNANCE<br />
The <strong>Company</strong> is committed to maintaining a high standard of corporate governance and, save as otherwise stated and explained<br />
in the Corporate Governance <strong>Report</strong>, meets the requirements of the code provisions of the Code on Corporate Governance<br />
Practice (the “Corporate Governance Code”) as set out in Appendix 14 of the Rules Governing the Listing of Securities (the “Listing<br />
Rules”) on The Stock Exchange of Hong Kong <strong>Limited</strong> (the “Stock Exchange”). Where appropriate, the <strong>Company</strong> has earlyadopted<br />
new code provisions effective 1 April 2012.<br />
Further information on the <strong>Company</strong>’s corporate governance practices is set out in the following separate reports:<br />
(a) “Corporate Governance <strong>Report</strong>” (pages 56 to 72) – it gives detailed information on the <strong>Company</strong>’s compliance with the<br />
Corporate Governance Code, and adoption of local and international best practices;<br />
(b) “Directors’ Remuneration and Interests <strong>Report</strong>” (pages 81 to 88) – it gives detailed information of Directors’ remuneration<br />
and interests (including information on Directors’ compensation, service contracts, Directors’ interests in shares; contracts<br />
and competing business);<br />
(c) “Audit Committee <strong>Report</strong>” (pages 89 and 90) – it sets out the terms of reference, work performed and findings of the Audit<br />
Committee for the year;<br />
(d) “Internal Controls and Risk Management <strong>Report</strong>” (pages 45 to 47) – it sets out the <strong>Company</strong>’s framework on internal<br />
controls and risks assessment including control environment, control activities, work done during the year and the focus for<br />
2012; and<br />
(e) “Corporate Responsibility <strong>Report</strong>” – it sets out the <strong>Company</strong>’s corporate responsibility policies and practices reflecting its<br />
commitment to maintaining a high standard of corporate governance.<br />
THE BOARD<br />
The Board is currently chaired by Irene Yun Lien LEE, Chairman, with Siu Chuen LAU as Non-executive Deputy Chairman. The<br />
other Executive Directors are Gerry Lui Fai YIM (Chief Executive Officer) and Wendy Wen Yee YUNG (Executive Director and<br />
<strong>Company</strong> Secretary). There are seven other Non-executive Directors.<br />
Irene Yun Lien LEE was appointed Non-executive Chairman as from the conclusion of the <strong>2011</strong> <strong>Annual</strong> General Meeting held on<br />
9 May <strong>2011</strong> (“<strong>2011</strong> AGM”). She succeeded Sir David AKERS-JONES, who stepped down following the <strong>2011</strong> AGM. Ms. Lee also<br />
serves as alternate Director to Anthony Hsien Pin LEE (as from 11 January <strong>2011</strong>), and was appointed Non-executive Director on<br />
9 March <strong>2011</strong>. She assumed an executive capacity as from 8 March 2012.<br />
Siu Chuen LAU was appointed Non-executive Director as from the conclusion of the <strong>2011</strong> AGM. He had previously served as<br />
alternate Director to Dr. Deanna Ruth Tak Yung RUDGARD, who stepped down as Non-executive Director as from the conclusion<br />
of the <strong>2011</strong> AGM. He was appointed Non-executive Deputy Chairman effective 8 March 2012.<br />
Kam Wing LI served as alternate Director throughout the year.<br />
Save as otherwise mentioned, other Directors whose names and biographies appear on pages 52 to 54 have been Directors of<br />
the <strong>Company</strong> throughout the year.<br />
74 <strong>Hysan</strong> <strong>Annual</strong> <strong>Report</strong> <strong>2011</strong>
THE BOARD continued<br />
According to Article 97 of the <strong>Company</strong>’s current Articles of Association, a Director appointed either to fill a casual vacancy or as<br />
an addition to the Board shall hold office only until the next following annual general meeting.<br />
Under Article 114 of the <strong>Company</strong>’s current Articles of Association, one-third (or such other number as may be required under<br />
applicable legislation) of the Directors; and where the applicable number is not an integral number, to be rounded upwards, who<br />
have been longest in office shall retire from office by rotation. A retiring Director is eligible for re-election.<br />
Overview<br />
Gerry Lui Fai YIM will step down as Chief Executive Officer and Executive Director as from the conclusion of annual general<br />
meeting to be held on 14 May 2012. Particulars of Directors seeking for re-election at the forthcoming annual general meeting<br />
are set out in the related circular to shareholders.<br />
The <strong>Company</strong> has received from each Independent non-executive Director an annual confirmation of his independence as<br />
regard each of the factors referred to in Rule 3.13 (1) to (8) of the Listing Rules and the <strong>Company</strong> considered all of them to be<br />
independent.<br />
DIRECTORS’ INTERESTS IN SHARES<br />
Details of the interests and short positions of the Directors in the shares, underlying shares or debentures of the <strong>Company</strong> and<br />
its associated corporations are set out in Directors’ Remuneration and Interests <strong>Report</strong> on pages 81 to 88.<br />
SUBSTANTIAL SHAREHOLDERS’ AND OTHER PERSONS’ INTERESTS IN SHARES<br />
As at 31 December <strong>2011</strong>, the interests or short positions of substantial shareholders and other persons of the <strong>Company</strong>, in<br />
the shares and underlying shares of the <strong>Company</strong> as recorded in the register required to be kept under section 336 of the<br />
Securities and Futures Ordinance (“SFO”), or as otherwise notified to the <strong>Company</strong>, were as follows:<br />
Aggregate long positions in shares and underlying shares of the <strong>Company</strong><br />
% of the<br />
Number of issued<br />
ordinary<br />
share<br />
Name Capacity shares held capital<br />
(Note a)<br />
Lee <strong>Hysan</strong> Estate <strong>Company</strong>, <strong>Limited</strong> Beneficial owner and 433,130,735 40.87<br />
interests of (Note b)<br />
controlled corporations<br />
Lee <strong>Hysan</strong> <strong>Company</strong> <strong>Limited</strong> Interests of controlled 433,130,735 40.87<br />
corporations (Note b)<br />
Silchester International Investors LLP Investment manager 85,161,000 8.04<br />
Notes:<br />
(a) The percentage has been compiled based on the total number of shares of the <strong>Company</strong> in issue as at 31 December <strong>2011</strong> (i.e.<br />
1,059,754,415 ordinary shares).<br />
(b) These interests represent the same block of shares of the <strong>Company</strong>. 270,118,724 shares were held by Lee <strong>Hysan</strong> Estate <strong>Company</strong>,<br />
<strong>Limited</strong> (“LHE”) and 163,012,011 shares were held by certain subsidiaries of LHE. LHE is a wholly-owned subsidiary of Lee <strong>Hysan</strong><br />
<strong>Company</strong> <strong>Limited</strong>.<br />
Apart from the above, no other interest or short position in the shares or underlying shares of the <strong>Company</strong> were recorded in<br />
the register required to be kept under section 336 of the SFO as at 31 December <strong>2011</strong>.<br />
Strategy in Action Corporate Governance Financial Statements and Valuation<br />
<strong>Hysan</strong> <strong>Annual</strong> <strong>Report</strong> <strong>2011</strong><br />
75
Directors’ <strong>Report</strong> continued<br />
RELATED PARTY TRANSACTIONS<br />
The Group entered into certain transactions with parties regarded as “Related Parties” under applicable accounting principles.<br />
These mainly relate to contracts entered into by the Group in the ordinary course of business, which contracts were negotiated<br />
on normal commercial terms and on an arm’s length basis. Further details are set out in note 39 to the financial statements.<br />
Some of these transactions also constitute “Continuing Connected Transactions” under the Listing Rules, as identified below.<br />
CONTINUING CONNECTED TRANSACTIONS<br />
Certain transactions entered into by the Group constituted continuing connected transactions (the “Transactions”) under<br />
Rule 14A.34 of the Listing Rules during the year. Details of the Transactions required to be disclosed are set out as follows:<br />
I. Leases granted by the Group<br />
(a) The Lee Gardens, 33 <strong>Hysan</strong> Avenue, Hong Kong (“The Lee Gardens”)<br />
The following lease arrangement was entered into by Perfect Win Properties <strong>Limited</strong>, a wholly-owned subsidiary of the<br />
<strong>Company</strong> and property owner of The Lee Gardens, as landlord, with Oxer <strong>Limited</strong> (“Oxer”), an associate of Michael Tze Hau<br />
LEE, Non-executive Director of the <strong>Company</strong>. Details of the lease arrangement are set out below:<br />
Connected person Date of agreement Terms Premises <strong>Annual</strong> consideration<br />
(Note a)<br />
Oxer <strong>Limited</strong> 14 June 2010 3 years commencing Rooms 3703 and <strong>2011</strong>: HK$1,638,876<br />
(Note b) (Lease and Carpark from 1 July 2010 3704 on the 2012: HK$1,638,876<br />
Licence 37th Floor and 2013: HK$819,438<br />
Agreement) 1 carparking space (on pro-rata basis)<br />
(b) Lee Gardens Two, 28 Yun Ping Road, Hong Kong (“Lee Gardens Two”)<br />
The following lease arrangements were entered into by Barrowgate <strong>Limited</strong> (“Barrowgate”), a 65.36% subsidiary of the<br />
<strong>Company</strong> and property owner of Lee Gardens Two, as landlord with the following connected persons:<br />
Connected person Date of agreement Terms Premises <strong>Annual</strong> consideration<br />
(Note a)<br />
(i) Jebsen and 31 March 2010 3 years commencing from Office units on the <strong>2011</strong>: HK$20,802,552<br />
<strong>Company</strong> 1 September 2010 28th, 30th and 2012: HK$20,802,552<br />
<strong>Limited</strong> 31st Floors 2013: HK$13,868,368<br />
(Note c)<br />
(on pro-rata basis)<br />
(ii) Hang Seng 15 October 2007 72 months commencing Shop G13A on the <strong>2011</strong>: HK$17,706,600<br />
Bank <strong>Limited</strong> (Note d) from 15 October 2007 Ground Floor and 2012: HK$17,869,680<br />
(Note c) (for Shops 2-10 on the Shops 2-10 and 2013: HK$14,074,775<br />
Lower Ground Floor) 11-12 on the (on pro-rata basis)<br />
68 months commencing Lower Ground (Notes f & g)<br />
from 15 February 2008 Floor<br />
(for Shop G13A on the<br />
Ground Floor and Shops<br />
11-12 on the Lower<br />
Ground Floor)<br />
(Note e)<br />
76 <strong>Hysan</strong> <strong>Annual</strong> <strong>Report</strong> <strong>2011</strong>
CONTINUING CONNECTED TRANSACTIONS continued<br />
I. Leases granted by the Group continued<br />
(b) Lee Gardens Two, 28 Yun Ping Road, Hong Kong (“Lee Gardens Two”) continued<br />
Connected person Date of agreement Terms Premises <strong>Annual</strong> consideration<br />
(Note a)<br />
Overview<br />
(iii) Pearl (1) 23 May 2008 3 years commencing from Room 1401C on the <strong>2011</strong>: HK$739,226<br />
Investments 15 May 2008 14th Floor (on pro-rata basis)<br />
(HK) <strong>Limited</strong><br />
(Note h)<br />
(2) 24 May <strong>2011</strong> 3 years commencing from Room 1401C on the <strong>2011</strong>: HK$1,294,231<br />
(Lease and 15 May <strong>2011</strong> 14th Floor and 1 (on pro-rata basis)<br />
Carpark Licence carparking space 2012: HK$2,057,496<br />
Agreement)<br />
2013: HK$2,057,496<br />
(renewal) 2014: HK$763,265<br />
(on pro-rata basis)<br />
(iv) MF Jebsen (1) 22 December 3 years commencing from Office units on <strong>2011</strong>: HK$1,127,761<br />
International 2008 1 February 2008 the 24th and (on pro-rata basis)<br />
<strong>Limited</strong><br />
25th Floors<br />
(Note i)<br />
(2) 7 September 3 years commencing from Office units on <strong>2011</strong>: HK$6,612,419<br />
2010 (renewal) 1 February <strong>2011</strong> the 25th Floor (on pro-rata basis)<br />
2012: HK$7,213,548<br />
2013: HK$7,213,548<br />
2014: HK$601,129<br />
(on pro-rata basis)<br />
(c) One <strong>Hysan</strong> Avenue, Causeway Bay, Hong Kong (“One <strong>Hysan</strong> Avenue”)<br />
The following lease arrangements were entered into by OHA Property <strong>Company</strong> <strong>Limited</strong>, a wholly-owned subsidiary of the<br />
<strong>Company</strong> and property owner of One <strong>Hysan</strong> Avenue, as landlord with Atlas Corporate Management <strong>Limited</strong>, a wholly-owned<br />
subsidiary of LHE, a substantial shareholder of the <strong>Company</strong> (holding 40.87% interest). Details of the lease are set out<br />
below:<br />
Connected person Date of agreement Terms Premises <strong>Annual</strong> consideration<br />
(Note a)<br />
Atlas Corporate (1) 14 November 3 years commencing from Whole of <strong>2011</strong>: HK$2,103,300<br />
Management 2008 1 November 2008 21st Floor (on pro-rata basis)<br />
<strong>Limited</strong><br />
(2) 4 November 3 years commencing from Whole of <strong>2011</strong>: HK$466,590<br />
<strong>2011</strong> (renewal) 1 November <strong>2011</strong> 21st Floor (on pro-rata basis)<br />
2012: HK$2,799,540<br />
2013: HK$2,799,540<br />
2014: HK$2,332,950<br />
(on pro-rata basis)<br />
Strategy in Action Corporate Governance Financial Statements and Valuation<br />
<strong>Hysan</strong> <strong>Annual</strong> <strong>Report</strong> <strong>2011</strong><br />
77
Directors’ <strong>Report</strong> continued<br />
CONTINUING CONNECTED TRANSACTIONS continued<br />
II. Provision of leasing and property management services to a non wholly-owned subsidiary regarding Lee Gardens Two<br />
(a) The following management agreement was entered into by <strong>Hysan</strong> Leasing <strong>Company</strong> <strong>Limited</strong>, a wholly-owned subsidiary of<br />
the <strong>Company</strong>, with Barrowgate for the provision of leasing, marketing and lease administration services to Lee Gardens<br />
Two:<br />
Connected person Date of agreement Terms Premises Consideration<br />
Barrowgate 31 March 2010 3 years commencing from Whole premises of HK$15,634,021<br />
<strong>Limited</strong> 1 April 2010 Lee Gardens Two (Note j)<br />
(b) The following management agreement was entered into by <strong>Hysan</strong> Property Management <strong>Limited</strong>, a wholly-owned subsidiary<br />
of the <strong>Company</strong>, with Barrowgate for the provision of property management services to Lee Gardens Two:<br />
Connected person Date of agreement Terms Premises Consideration<br />
Barrowgate 31 March 2010 3 years commencing from Whole premises of HK$3,039,590<br />
<strong>Limited</strong> 1 April 2010 Lee Gardens Two (Note j)<br />
Notes:<br />
(a) The annual considerations are based on current rates of rental, operating charges, (for retail premises) promotional levies and (for<br />
carparking spaces) licence fees for each of the relevant financial years as provided in the relevant agreements. The rental, operating<br />
charges, promotional levies and licence fees (as the case may be) are payable monthly in advance.<br />
(b) Oxer is a connected person of the <strong>Company</strong> by virtue of its being an associate of Michael Tze Hau LEE, Non-executive Director of the<br />
<strong>Company</strong>.<br />
(c) Jebsen and <strong>Company</strong> <strong>Limited</strong> (“Jebsen and <strong>Company</strong>”) and Hang Seng Bank <strong>Limited</strong> (“Hang Seng”) are beneficial substantial shareholders<br />
of Barrowgate and having equity interest of 10% and 24.64% respectively in Barrowgate.<br />
(d) Barrowgate and Hang Seng entered into an agreement for lease dated 15 October 2007. A formal lease agreement, a supplemental deed<br />
and an endorsement (following rent review as provided under the lease arrangements) in respect of the premises mentioned under I(b)(ii)<br />
above were entered on 15 February 2008, 13 May 2008 and 22 November 2010 respectively.<br />
(e) The term of the lease mentioned under I(b)(ii) above exceeds 3 years and, according to Listing Rules requirement, an independent financial<br />
adviser to the Board was engaged and it formed the view that the term of this lease with duration longer than 3 years was required and it<br />
was normal business practice for leases of this type to be of such duration.<br />
(f) Pursuant to an endorsement dated 22 November 2010 as mentioned in Note (d) above, the rent for the period from 15 October 2010 to<br />
14 October 2013 was revised at the then prevailing market rent.<br />
(g) The monthly operating charges were revised with effect from 1 January 2012 while the rental and promotional levies remained unchanged.<br />
(h) Pearl Investments (HK) <strong>Limited</strong> is a connected person of the <strong>Company</strong> by virtue of its being an associate of Chien LEE, Non-executive<br />
Director of the <strong>Company</strong>.<br />
(i) MF Jebsen International <strong>Limited</strong> is a connected person of the <strong>Company</strong> by virtue of its being controlled (more than 50%) by the brother of<br />
Hans Michael JEBSEN, Non-executive Director of the <strong>Company</strong>.<br />
(j) These represent the actual consideration received for the year ended 31 December <strong>2011</strong>, calculated on the basis of the fee schedules as<br />
prescribed in the respective management agreements.<br />
78 <strong>Hysan</strong> <strong>Annual</strong> <strong>Report</strong> <strong>2011</strong>
CONTINUING CONNECTED TRANSACTIONS continued<br />
All the Transactions were entered in the ordinary and usual course of business of the respective companies after due<br />
negotiations on an arm’s length basis with reference to the prevailing market conditions.<br />
Announcements were published regarding the Transactions in accordance with the Listing Rules. The <strong>Company</strong> confirms that<br />
it has complied with the disclosure requirements in accordance with Chapter 14A of the Listing Rules in so far as they are<br />
applicable.<br />
Overview<br />
Pursuant to Rule 14A.38 of the Listing Rules, the <strong>Company</strong>’s auditor was engaged to report on the Group’s continuing<br />
connected transactions in accordance with Hong Kong Standard on Assurance Engagements 3000 “Assurance Engagements<br />
Other Than Audits or Reviews of Historical Financial Information” and with reference to Practice Note 740 “Auditor’s Letter on<br />
Continuing Connected Transactions under the Hong Kong Listing Rules” issued by the Hong Kong Institute of Certified Public<br />
Accountants. The auditor has issued his unqualified letter containing his findings and conclusions in respect of the continuing<br />
connected transactions disclosed by the Group in pages 76 to 79 of the <strong>Annual</strong> <strong>Report</strong> in accordance with Rule 14A.38 of the<br />
Listing Rules. A copy of the auditor’s letter has been provided by the <strong>Company</strong> to the Stock Exchange.<br />
All Independent non-executive Directors of the <strong>Company</strong> have reviewed the Transactions and the report of the auditor and<br />
confirmed that the respective contracts and terms of the Transactions are:<br />
1. in the ordinary and usual course of business of the <strong>Company</strong>;<br />
2. on normal commercial terms; and<br />
3. in accordance with the relevant agreement governing them on terms that are fair and reasonable and in the commercial<br />
interests of the Group as a whole.<br />
INTEREST IN CONTRACTS OF SIGNIFICANCE<br />
The lease arrangement between Barrowgate and Jebsen and <strong>Company</strong> is considered contract of significance under paragraph<br />
15 of Appendix 16 of the Listing Rules due to the annual consideration of the lease having a percentage ratio of 1.18%<br />
from the calculation of the revenue test (the percentage ratios for assets ratio and consideration ratio are 0.04% and 0.08%<br />
respectively). Details of the transaction are set out under I(b)(i) of “Continuing Connected Transactions”.<br />
MAJOR CUSTOMERS AND SUPPLIERS<br />
During the year, both the aggregate amount of purchases attributable to the Group’s 5 largest suppliers and the aggregate<br />
amount of turnover attributable to the Group’s 5 largest customers were less than 30% of total purchases and turnover of the<br />
Group respectively.<br />
PURCHASE, SALE OR REDEMPTION OF THE COMPANY’S LISTED SECURITIES<br />
During the year, neither the <strong>Company</strong> nor its subsidiaries purchased, sold or redeemed any of the <strong>Company</strong>’s listed securities.<br />
PUBLIC FLOAT<br />
Based on the information that is publicly available to the <strong>Company</strong> and within the knowledge of the Directors, the <strong>Company</strong> has<br />
maintained the prescribed amount of public float during the year and up to the date of this report as required under the Listing<br />
Rules.<br />
Strategy in Action Corporate Governance Financial Statements and Valuation<br />
<strong>Hysan</strong> <strong>Annual</strong> <strong>Report</strong> <strong>2011</strong><br />
79
Directors’ <strong>Report</strong> continued<br />
Donations<br />
During the year, the Group made donations of approximately HK$0.5 million to charitable and non-profit-making organisations.<br />
Auditor<br />
A resolution for the re-appointment of Messrs. Deloitte Touche Tohmatsu as auditor of the <strong>Company</strong> is to be proposed at the<br />
2012 AGM.<br />
On behalf of the Board<br />
Irene Yun Lien LEE<br />
Chairman<br />
Hong Kong, 8 March 2012<br />
80 <strong>Hysan</strong> <strong>Annual</strong> <strong>Report</strong> <strong>2011</strong>
Directors’ Remuneration and Interests <strong>Report</strong><br />
DIRECTOR COMPENSATION<br />
Remuneration Committee<br />
The Board recognises the significance of having in place a transparent and objective process for determining Executive Director<br />
compensation. The Remuneration Committee (first established in 1987, formerly known as “Emoluments Review Committee”),<br />
reviews and determines the remuneration of Executive Directors as well as recommending for shareholder approval fees payable<br />
to the Chairman and Non-executive Directors.<br />
Overview<br />
The Remuneration Committee currently has 3 members (with a majority of Independent non-executive Directors). It is chaired<br />
by Philip Yan Hok FAN, Independent non-executive Director and the other members are Joseph Chung Yin POON, Independent<br />
non-executive Director and Michael Tze Hau LEE, Non-executive Director. Sir David AKERS-JONES stepped down as Independent<br />
non-executive Chairman as well as chairman of the Committee after the conclusion of the May <strong>2011</strong> <strong>Annual</strong> General Meeting.<br />
Management makes recommendations to the Committee on the <strong>Company</strong>’s framework for, and cost of, Executive Director<br />
remuneration and the Committee then reviews these recommendations. Fees payable to the Chairman and other Non-executive<br />
Directors are reviewed from time to time. Independent professional advice will be sought where appropriate. On matters other<br />
than those concerning him, the Chief Executive Officer may be invited to Committee meetings. No Director is involved in deciding<br />
his own remuneration.<br />
Executive Director Remuneration Policy<br />
The Group’s remuneration policy aims to provide a fair market remuneration in a form and value to attract, retain and motivate<br />
high quality staff. At the same time, such awards must be aligned with shareholder interests.<br />
The following principles had been established:<br />
Strategy in Action<br />
• Remuneration package will consist of several components: (i) fixed part (base salary and benefits); (ii) performance-based<br />
(bonus); (iii) long-term incentives (executive share options). The structure will reflect a fair system of reward for all the<br />
participants, emphasizing performance.<br />
• Remuneration packages are set at levels to ensure comparability and competitiveness with Hong Kong-based companies<br />
competing within a similar talent pool, with particular emphasis on the property industry. Independent professional advice<br />
will be sought to supplement internal resources where appropriate.<br />
• The Committee will determine the overall amount of each component of remuneration, taking into account both quantitative<br />
and qualitative assessment of performance.<br />
• Remuneration policy and practice will be as transparent as possible.<br />
• Executive Directors will develop a significant personal shareholding pursuant to the executive share options in order to<br />
align their interests with those of shareholders.<br />
• Pay and employment conditions elsewhere in the Group will be taken into account, especially in setting annual salary<br />
increases.<br />
• The remuneration policy for Executive Directors will be reviewed regularly, independently of executive management.<br />
Details of Director (including individual Executive Director) emoluments for year <strong>2011</strong> and options movement during the year are<br />
set out in notes 12 and 40 respectively to the financial statements.<br />
Non-executive Director Remuneration Policy<br />
Key elements of our Non-executive Director remuneration policy include:<br />
• Remuneration should be sufficient to attract and retain first class non-executive talent.<br />
• Remuneration of Non-executive Directors is (subject to shareholder approval) set by the Board and should be proportional<br />
to their contribution towards the interests of the <strong>Company</strong>.<br />
• Remuneration practice should be consistent with recognised best practice standards for Non-executive Directors’<br />
remuneration.<br />
• Remuneration should be in the form of cash fees, payable annually.<br />
• Non-executive Directors do not receive share options from the <strong>Company</strong>.<br />
Corporate Governance Financial Statements and Valuation<br />
<strong>Hysan</strong> <strong>Annual</strong> <strong>Report</strong> <strong>2011</strong><br />
81
Directors’ Remuneration and Interests <strong>Report</strong> continued<br />
DIRECTOR COMPENSATION continued<br />
Non-executive Director Remuneration Policy continued<br />
Non-executive Directors received no other compensation from the Group except for the fees disclosed below. None of the<br />
Non-executive Directors receives any pension benefits from the <strong>Company</strong>, nor do they participate in any bonus or incentive<br />
schemes.<br />
Non-executive Directors (including the Independent non-executive Directors) received fees totalling HK$2,119,643.78 for <strong>2011</strong>.<br />
<strong>2011</strong> Review<br />
The Committee met twice in March <strong>2011</strong> with all members being present. The first meeting reviewed <strong>2011</strong> Executive Director<br />
compensation packages. The second meeting focused on reviewing (i) its terms of reference; and (ii) fee levels for<br />
Non-executive Directors and Board Committee members.<br />
The executive packages and fee levels were set at levels to ensure comparability and competitiveness with Hong Kong based<br />
companies competing within a similar talent pool, with particular emphasis on the property industry. Clear performance targets<br />
were set for Executive Directors.<br />
The Committee’s terms of reference were refined to include reviewing the fee levels of Non-executive Directors (including<br />
additional fees for serving as Board Committee members). Taking into consideration the level of responsibility, experience,<br />
abilities required of the Directors, level of care and amount of time needed to be spent, and fees offered for similar positions<br />
in companies competing for the same talent, new fee levels of Non-executive Directors and Board Committee members were<br />
proposed and approved at the May <strong>2011</strong> <strong>Annual</strong> General Meeting. Effective 1 June <strong>2011</strong>, Executive Directors will not receive<br />
Director fees.<br />
March 2012 Review<br />
The Committee met in March 2012 to review 2012 Executive Director compensation packages, including new package of the<br />
Chairman (who will assume an executive capacity as from 8 March 2012). New package of the Chairman was set at the same<br />
level as the former executive Chairman, with inflationary adjustment since 2010. Independent professional advice was also<br />
sought. All members attended the meeting.<br />
Current Director Fee Levels<br />
Director fees are subject to shareholder approval at general meeting. The current fee scale for Directors and Board Committee<br />
members are set out below. Executive Directors will not receive any fee.<br />
Per annum<br />
HK$<br />
Board of Directors<br />
Chairman 400,000<br />
Director 200,000<br />
Audit Committee<br />
Chairman 100,000<br />
Member 60,000<br />
Remuneration Committee<br />
Chairman 50,000<br />
Member 40,000<br />
Other Committees<br />
Chairman 30,000<br />
Member 20,000<br />
82 <strong>Hysan</strong> <strong>Annual</strong> <strong>Report</strong> <strong>2011</strong>
DIRECTOR COMPENSATION continued<br />
Long-term incentives: Share Option Schemes<br />
The <strong>Company</strong> has granted options under 2 executive share option schemes. The purpose of both schemes was to strengthen<br />
the link between individual staff and shareholder interests. The power of grant to Executive Directors is vested in the<br />
Remuneration Committee and endorsed by all Independent non-executive Directors as required under the Rules Governing the<br />
Listing of Securities (the “Listing Rules”) on The Stock Exchange of Hong Kong <strong>Limited</strong> (the “Stock Exchange”). The Chairman<br />
or the Chief Executive Officer may make grants to management staff below Executive Director level.<br />
Key terms of the share option schemes of the <strong>Company</strong> are summarised as follows:<br />
The 1995 Share Option Scheme (the “1995 Scheme”)<br />
The 1995 Scheme was approved by shareholders on 28 April 1995 and had a term of 10 years. It expired on 28 April 2005. As<br />
at 31 December <strong>2011</strong>, all options granted under the 1995 Scheme had been exercised.<br />
The maximum entitlement of each participant is substantially below the limit set out under the scheme rules (being 25% of the<br />
maximum number of shares in respect of which options may at any time be granted under the 1995 Scheme). For the options<br />
granted under the 1995 Scheme that are currently outstanding, the basis for determining the exercise price is the highest of (i)<br />
the closing price of the shares as stated in the Stock Exchange’s daily quotations sheet on the date of grant; (ii) the average of<br />
the closing prices of the shares as stated in the Stock Exchange’s daily quotations sheets for the 5 business days immediately<br />
preceding the date of grant; and (iii) the nominal value of the shares. Consideration on each grant of option was HK$1 and was<br />
paid within 30 days from the date of grant of option, with full payment for exercise price to be made on exercise of the relevant<br />
option.<br />
The 2005 Share Option Scheme (the “2005 Scheme”)<br />
The <strong>Company</strong> adopted the 2005 Scheme at its <strong>Annual</strong> General Meeting (“AGM”) held on 10 May 2005, which has a term of 10<br />
years and will be expiring on 9 May 2015 (together with the 1995 Scheme are referred to as the “Schemes”).<br />
The maximum number of shares in respect of which options may be granted under the 2005 Scheme and any other share<br />
option scheme of the <strong>Company</strong> shall not exceed such number of shares as required under the Listing Rules, currently being<br />
10% of the shares in issue as at 10 May 2005, the date of the AGM approving the 2005 Scheme (being 104,996,365 shares).<br />
Under the Listing Rules, a listed issuer may seek approval by its shareholders in general meeting for “refreshing” the 10% limit<br />
under the scheme. The limit on the number of shares which may be issued upon exercise of all outstanding options granted and<br />
yet to be exercised under the 2005 Scheme and any other share option scheme of the <strong>Company</strong> must not exceed 30% of the<br />
shares in issue from time to time (or such number of shares as required under the Listing Rules). No options may be granted if<br />
such grant will result in this 30% limit being exceeded.<br />
The maximum entitlement of each participant under the 2005 Scheme must not during any 12-month period exceed such<br />
number of shares as required under the Listing Rules (which is 1% of the total shares in issue as at the date of shareholder<br />
approval, being 10,499,636 shares). The exercise price shall be at least the highest of (i) the closing price of the shares as<br />
stated in the Stock Exchange’s daily quotations sheet on the date of grant; (ii) the average of the closing prices of the shares as<br />
stated in the Stock Exchange’s daily quotations sheets for the 5 business days immediately preceding the date of grant; and (iii)<br />
the nominal value of the shares. Consideration on each grant of option is HK$1 and is required to be paid within 30 days from<br />
the date of grant of option, with full payment for exercise price to be made on exercise of the relevant option.<br />
Grant and vesting structures<br />
Under the <strong>Company</strong>’s current policy, grants will be made on a periodic basis. Vesting period is 3 years in equal proportions. Size<br />
of grant will be determined by reference to base salary multiple and job grades. A clear performance criterion will be a key driver.<br />
The Board will review the grant and vesting structures from time to time.<br />
Overview Strategy in Action<br />
Corporate Governance Financial Statements and Valuation<br />
<strong>Hysan</strong> <strong>Annual</strong> <strong>Report</strong> <strong>2011</strong><br />
83
Directors’ Remuneration and Interests <strong>Report</strong> continued<br />
DIRECTOR COMPENSATION continued<br />
Long-term incentives: Share Option Schemes continued<br />
Movement of share options<br />
During the year, a total of 713,000 shares options were granted under the 2005 Scheme.<br />
As at 31 December <strong>2011</strong>, an aggregate of 2,294,669 shares are issuable for options granted under the Schemes, representing<br />
approximately 0.22% of the issued share capital of the <strong>Company</strong>.<br />
As at the date of this <strong>Report</strong>, 97,202,433 shares are issuable under the Schemes representing 9.17% of the issued share<br />
capital.<br />
Details of options granted, exercised, cancelled/lapsed and outstanding under the Schemes during the year are as follows:<br />
Changes during the year<br />
Balance<br />
Balance<br />
Exercise Exercisable as at Cancelled/ as at<br />
Name Date of grant price period 1.1.<strong>2011</strong> Granted Exercised lapsed 31.12.<strong>2011</strong><br />
HK$ (Note a)<br />
1995 Scheme<br />
Executive Director<br />
Wendy Wen Yee YUNG 30.3.2005 15.850 30.3.2005 – 96,000 – (96,000) – –<br />
29.3.2015 (Note b)<br />
2005 Scheme<br />
Executive Directors<br />
Peter Ting Chang LEE 6.3.2007 21.380 6.3.2007 – 235,000 – (235,000) – –<br />
(Note c) 16.1.<strong>2011</strong> (Note d)<br />
13.3.2008 21.450 13.3.2008 – 260,000 – (173,333) (86,667) –<br />
16.1.<strong>2011</strong> (Note d)<br />
11.3.2009 11.760 11.3.2009 – 500,000 – (166,666) (333,334) –<br />
16.1.<strong>2011</strong> (Note d)<br />
Gerry Lui Fai YIM 1.12.2009 22.800 1.12.2009 – 218,000 – – – 218,000<br />
30.11.2019<br />
10.3.<strong>2011</strong> 35.710 10.3.<strong>2011</strong> – – 217,000 – – 217,000<br />
(Note e) 9.3.2021<br />
Wendy Wen Yee YUNG 26.6.2006 20.110 26.6.2006 – 110,000 – (110,000) – –<br />
25.6.2016 (Note b)<br />
30.3.2007 21.250 30.3.2007 – 95,000 – – – 95,000<br />
29.3.2017<br />
31.3.2008 21.960 31.3.2008 – 100,000 – – – 100,000<br />
30.3.2018<br />
11.3.2009 11.760 11.3.2009 – 300,000 – (200,000) – 100,000<br />
10.3.2019 (Note b)<br />
11.3.2010 22.100 11.3.2010 – 185,000 – – – 185,000<br />
10.3.2020<br />
10.3.<strong>2011</strong> 35.710 10.3.<strong>2011</strong> – – 103,000 – – 103,000<br />
(Note e) 9.3.2021<br />
84 <strong>Hysan</strong> <strong>Annual</strong> <strong>Report</strong> <strong>2011</strong>
DIRECTOR COMPENSATION continued<br />
Long-term incentives: Share Option Schemes continued<br />
Movement of share options continued<br />
Changes during the year<br />
Balance<br />
Balance<br />
Exercise Exercisable as at Cancelled/ as at<br />
Name Date of grant price period 1.1.<strong>2011</strong> Granted Exercised lapsed 31.12.<strong>2011</strong><br />
HK$ (Note a)<br />
2005 Scheme continued<br />
Eligible employees 30.3.2006 22.000 30.3.2006 – 15,000 – (15,000) – –<br />
(Note f) 29.3.2016 (Note g)<br />
30.3.2007 21.250 30.3.2007 – 15,000 – (15,000) – –<br />
29.3.2017 (Note h)<br />
31.3.2008 21.960 31.3.2008 – 78,000 – (55,000) – 23,000<br />
30.3.2018 (Note i)<br />
2.5.2008 23.900 2.5.2008 – 95,000 – – – 95,000<br />
1.5.2018<br />
2.10.2008 20.106 2.10.2008 – 85,000 – – – 85,000<br />
1.10.2018<br />
31.3.2009 13.300 31.3.2009 – 363,334 – (86,999) (13,667) 262,668<br />
30.3.2019 (Note j) (Note k)<br />
31.3.2010 22.450 31.3.2010 – 523,000 – (37,999) (44,000) 441,001<br />
30.3.2020 (Note l) (Note k)<br />
31.3.<strong>2011</strong> 32.000 31.3.<strong>2011</strong> – – 393,000 – (23,000) 370,000<br />
(Note m) 30.3.2021 (Note k)<br />
3,273,334 713,000 (1,190,997) (500,668) 2,294,669<br />
Notes:<br />
(a) All options granted have a vesting period of 3 years in equal proportions.<br />
(b) The weighted average closing price of the shares of the <strong>Company</strong> immediately before the date on which the options were exercised was<br />
HK$34.25.<br />
(c) The late Chairman, Peter Ting Chang LEE, passed away on 17 October 2009. An extension in time (to 16 January <strong>2011</strong>) for exercising<br />
his options was granted to his legal personal representative pursuant to the 2005 Scheme. Share options of 235,000, 173,333 and<br />
166,666, which were granted to him on 6 March 2007, 13 March 2008 and 11 March 2009 respectively, were exercised by the sole<br />
executrix to his estate on 3 January <strong>2011</strong>. The unvested share options of 420,001 lapsed on 17 January <strong>2011</strong>.<br />
(d) The weighted average closing price of the shares of the <strong>Company</strong> immediately before the date on which the options were exercised was<br />
HK$36.60.<br />
(e) The closing price of the shares of the <strong>Company</strong> immediately before the date of grant (i.e. as of 9 March <strong>2011</strong>) was HK$35.70.<br />
(f) Eligible employees are working under employment contracts that are regarded as “continuous contracts” for the purposes of the<br />
Employment Ordinance.<br />
(g) The weighted average closing price of the shares of the <strong>Company</strong> immediately before the date on which the options were exercised was<br />
HK$33.65.<br />
(h) The weighted average closing price of the shares of the <strong>Company</strong> immediately before the date on which the options were exercised was<br />
HK$36.25.<br />
(i) The weighted average closing price of the shares of the <strong>Company</strong> immediately before the date on which the options were exercised was<br />
HK$34.68.<br />
Overview Strategy in Action<br />
Corporate Governance Financial Statements and Valuation<br />
<strong>Hysan</strong> <strong>Annual</strong> <strong>Report</strong> <strong>2011</strong><br />
85
Directors’ Remuneration and Interests <strong>Report</strong> continued<br />
DIRECTOR COMPENSATION continued<br />
Long-term incentives: Share Option Schemes continued<br />
Movement of share options continued<br />
(j) The weighted average closing price of the shares of the <strong>Company</strong> immediately before the date on which the options were exercised was<br />
HK$34.98.<br />
(k) The unvested options lapsed during the year upon resignations of certain eligible employees.<br />
(l) The weighted average closing price of the shares of the <strong>Company</strong> immediately before the date on which the options were exercised was<br />
HK$35.06.<br />
(m) The closing price of the shares of the <strong>Company</strong> immediately before the date of grant (i.e. as of 30 March <strong>2011</strong>) was HK$31.95.<br />
Apart from the above, the <strong>Company</strong> had not granted any share option under the Schemes to any other persons as required to<br />
be disclosed under Rule 17.07 of the Listing Rules.<br />
Particulars of the Schemes are set out in note 40 to the financial statements.<br />
Value of share options<br />
Pursuant to Rule 17.08 of the Listing Rules, the value of the share options granted during the year is to be expensed through<br />
the Group’s income statement over the three-year vesting period of the options.<br />
The fair values of share options granted by the <strong>Company</strong> were determined by using Black-Scholes option pricing model<br />
(the “Model”). The Model is one of the commonly used models to estimate the fair value of an option. The variables and<br />
assumptions used in computing the fair value of the share options are based on the management’s best estimate. The value<br />
of an option varies with different variables of a number of subjective assumptions. Any change in the variables so adopted may<br />
materially affect the estimation of the fair value of an option.<br />
The inputs into the Model were as follows:<br />
Date of grant 31.3.<strong>2011</strong> 10.3.<strong>2011</strong><br />
Closing share price at the date of grant HK$32.000 HK$34.000<br />
Exercise price HK$32.000 HK$35.710<br />
Risk free rate (Note a) 2.687% 2.717%<br />
Expected life of option (Note b) 10 years 10 years<br />
Expected volatility (Note c) 34.151% 34.026%<br />
Expected dividend per annum (Note d) HK$0.640 HK$0.640<br />
Estimated fair values per share option HK$12.409 HK$12.553<br />
Notes:<br />
(a) Risk free rate: being the approximate yields of 10-year Exchange Fund Notes traded on the date of grant, matching the expected life of<br />
each option.<br />
(b) Expected life of option: being the period of 10 years commencing on the date of grant, based on management’s best estimates for the<br />
effects of non-transferability, exercise restriction and behavioural consideration.<br />
(c) Expected volatility: being the approximate historical volatility of closing prices of the shares of the <strong>Company</strong> in the past 10 years<br />
immediately before the date of grant, matching the expected life of the options of 10 years.<br />
(d) Expected dividend per annum: being the approximate average annual cash dividend for the past 5 financial years.<br />
Service Contracts<br />
No Director proposed for re-election at the forthcoming AGM has a service contract with the <strong>Company</strong> or any of its subsidiaries<br />
that is not determinable by the Group within 1 year without payment of compensation (other than statutory compensation).<br />
86 <strong>Hysan</strong> <strong>Annual</strong> <strong>Report</strong> <strong>2011</strong>
DIRECTORS’ INTERESTS IN SHARES<br />
As at 31 December <strong>2011</strong>, the interests and short positions of the Directors in the shares, underlying shares or debentures of<br />
the <strong>Company</strong> and its associated corporations (within the meaning of Part XV of the Securities and Futures Ordinance (“SFO”))<br />
as recorded in the register required to be kept under section 352 of the SFO; or as otherwise notified to the <strong>Company</strong> and the<br />
Stock Exchange pursuant to the Model Code for Securities Transactions by Directors of Listed Issuers (the “Model Code”), are<br />
set out below:<br />
Aggregate long positions in shares and underlying shares of the <strong>Company</strong><br />
Number of ordinary shares held<br />
Personal Family Corporate Other % of the issued<br />
Name interests interests interests interests Total share capital<br />
(Note a)<br />
Hans Michael JEBSEN 60,984 – 2,473,316 – 2,534,300 0.239<br />
(Note b)<br />
Chien LEE 800,000 – – – 800,000 0.075<br />
Gerry Lui Fai YIM 40,000 – – – 40,000 0.004<br />
Wendy Wen Yee YUNG 378,000 – – – 378,000 0.036<br />
Siu Chuen LAU – – 20,115 – 20,115 0.002<br />
(Note c)<br />
Notes:<br />
(a) This percentage has been compiled based on the total number of shares of the <strong>Company</strong> in issue (i.e. 1,059,754,415 ordinary shares)<br />
as at 31 December <strong>2011</strong>.<br />
(b) Such shares were held through a corporation in which Hans Michael JEBSEN was a member entitled to exercise no less than one-third of<br />
the voting power at general meeting.<br />
(c) Such shares were held through a corporation in which Siu Chuen LAU and his wife were members and each entitled to exercise no less<br />
than one-third of the voting power at general meeting.<br />
Certain Executive Directors of the <strong>Company</strong> have been granted share options under the Schemes (details are set out in the<br />
section headed “Long-term incentives: Share Option Schemes” above). These constitute interests in underlying shares of equity<br />
derivatives of the <strong>Company</strong> under the SFO.<br />
Aggregate long positions in shares of associated corporations<br />
Listed below is a Director’s interest in the shares of Barrowgate <strong>Limited</strong> (“Barrowgate”), a 65.36% subsidiary of the <strong>Company</strong>:<br />
Number of ordinary shares held<br />
Corporate Other % of the issued<br />
Name interests interests Total share capital<br />
Hans Michael JEBSEN 1,000 – 1,000 10<br />
(Note)<br />
Note:<br />
Jebsen and <strong>Company</strong> <strong>Limited</strong> (“Jebsen and <strong>Company</strong>”) held a 10% interest in the issued share capital in Barrowgate through a wholly-owned<br />
subsidiary. Hans Michael JEBSEN was deemed to be interested in the shares of Barrowgate by virtue of being a controlling shareholder of<br />
Jebsen and <strong>Company</strong>.<br />
Apart from the above, no other interest or short position in the shares, underlying shares or debentures of the <strong>Company</strong> or any<br />
associated corporations as at 31 December <strong>2011</strong> were recorded in the register required to be kept under Section 352 of the<br />
SFO; or as otherwise notified to the <strong>Company</strong> and the Stock Exchange pursuant to the Model Code.<br />
Overview Strategy in Action<br />
Corporate Governance Financial Statements and Valuation<br />
<strong>Hysan</strong> <strong>Annual</strong> <strong>Report</strong> <strong>2011</strong><br />
87
Directors’ Remuneration and Interests <strong>Report</strong> continued<br />
Directors’ Interests in Shares continued<br />
Compliance of the Model Code for Securities Transactions by Directors of Listed Issuers<br />
The <strong>Company</strong> has adopted the Model Code set out in Appendix 10 to the Listing Rules as its own code of conduct regarding<br />
Director’s securities transactions. All Directors have confirmed, following specific enquiry by the <strong>Company</strong>, that they have<br />
complied with the required standards set out in the Model Code throughout the year.<br />
Directors’ Interests in Contracts<br />
During the year, certain Directors have interests, directly or indirectly, in contracts with the Group. These contracts constitute<br />
Related Party Transactions, Connected Transactions or Contracts of Significance under applicable accounting or regulatory rules<br />
(details are disclosed in the Directors’ <strong>Report</strong>).<br />
Directors’ Interests in Competing Business<br />
The Group is engaged principally in the property investment, development and management of high quality investment properties<br />
in Hong Kong. The following Directors (excluding Independent non-executive Directors) are considered to have interests in other<br />
activities (the “Deemed Competing Business”) that compete or are likely to compete with the said core business of the Group,<br />
all within the meaning of the Listing Rules:<br />
(i)<br />
Irene Yun Lien LEE, Anthony Hsien Pin LEE, Chien LEE, Michael Tze Hau LEE and Siu Chuen LAU are members of the<br />
founding Lee family whose range of general investment activities include property investments in Hong Kong and overseas.<br />
In light of the size and dominance of the portfolio of the Group, such disclosed Deemed Competing Business is considered<br />
immaterial.<br />
(ii) Hans Michael JEBSEN and his alternate, Kam Wing LI, hold the offices of directors in each of Jebsen and <strong>Company</strong><br />
and Jebsen China Services <strong>Limited</strong> and some of their subsidiaries, of which their business activities include, inter alia,<br />
investment holding and property investment in both the People’s Republic of China and Hong Kong. Mr. Jebsen is also a<br />
substantial shareholder of the companies.<br />
Mr. Jebsen is an independent non-executive director of The Wharf (Holdings) <strong>Limited</strong> whose business includes, inter alia,<br />
property investment, development and management in both the People’s Republic of China and Hong Kong.<br />
(iii) Chien LEE is an independent non-executive director of Swire Pacific <strong>Limited</strong> whose business includes, inter alia, property<br />
investment and trading in Hong Kong, the People’s Republic of China and the United States of America.<br />
The <strong>Company</strong>’s management team is separate and independent from that of the companies identified above. In addition, save<br />
and except Irene Yun Lien LEE, the relevant Directors have non-executive roles and are not involved in the <strong>Company</strong>’s day-to-day<br />
operations and management.<br />
For the reasons stated above, and coupled with the diligence of the Group’s Independent non-executive Directors and the Audit<br />
Committee, the Group is capable of carrying on its business independent of and at arm’s length from the Deemed Competing<br />
Business.<br />
By Order of the Board<br />
Wendy W.Y. YUNG<br />
Executive Director and <strong>Company</strong> Secretary<br />
Hong Kong, 8 March 2012<br />
88 <strong>Hysan</strong> <strong>Annual</strong> <strong>Report</strong> <strong>2011</strong>
Audit Committee <strong>Report</strong><br />
The Audit Committee has 3 members (with a majority of Independent non-executive Directors). Currently, it is chaired by Nicholas<br />
Charles ALLEN, Independent non-executive Director and the other members are Philip Yan Hok FAN, Independent non-executive<br />
Director and Anthony Hsien Pin LEE, Non-executive Director.<br />
Under its terms of reference, the Committee oversees the <strong>Company</strong>’s financial reporting process; it also reviews the <strong>Company</strong>’s<br />
internal controls and risk management systems and its relationship with external auditor. The Committee also has the<br />
responsibility to review the adequacy of resources, qualifications and experience of staff of the Group’s accounting and financial<br />
reporting function, and their training programmes and budget. The Committee Chairman reports to the Board on its findings<br />
after each Committee meeting.<br />
The Committee held 4 meetings during the year, on 7 March, 11 May, 8 August and 8 November <strong>2011</strong>. All the meetings were<br />
attended by Nicholas Charles ALLEN, Philip Yan Hok FAN and Anthony Hsien Pin LEE. The meetings in March <strong>2011</strong> and August<br />
<strong>2011</strong> were held to consider the financial statements for the 2010 annual report and <strong>2011</strong> interim report respectively. Additional<br />
meetings were held in May and November to review the Group’s risk management process, with a view to further strengthening<br />
the same and determining the appropriate system way forward. Management responses to improvement areas relating to<br />
controls recommended by Internal Audit were also reviewed. The Committee last met on 5 March 2012 to consider the financial<br />
statements for the year ended 31 December <strong>2011</strong>.<br />
Details on the meeting held in March <strong>2011</strong> were set out in the 2010 <strong>Annual</strong> <strong>Report</strong>. Significant matters, as reviewed and<br />
discussed in the other meetings, include the following:<br />
Financial <strong>Report</strong>ing<br />
In the process of financial reporting, management is responsible for the preparation of Group financial statements including<br />
the selection of suitable accounting policies. The external auditor is responsible for auditing and attesting to Group financial<br />
statements and evaluating the Group’s system of internal controls in such regard. The Committee oversees the respective work<br />
of management and the external auditor to endorse the processes and safeguards employed by them.<br />
• August <strong>2011</strong> : The Committee reviewed and recommended to the Board for approval of the unaudited financial<br />
statements for the first 6 months of <strong>2011</strong>, prior to public announcement and filing. The Committee<br />
received reports from and met with the external auditor to discuss the scope of their review and<br />
findings. The Committee had discussions with management on significant judgments affecting<br />
Group’s financial statements.<br />
• March 2012 : The Committee reviewed and discussed with management and external auditor the <strong>2011</strong> financial<br />
statements included in the <strong>2011</strong> <strong>Annual</strong> <strong>Report</strong>, prior to public announcement and filing. The<br />
Committee received reports from and met with external auditor and internal auditor to discuss<br />
the general scope of their respective work and findings. The Committee had discussions with<br />
management with regard to significant judgments affecting the Group financial statements. Based<br />
on these review and discussions, and the report of the external auditor, the Audit Committee<br />
recommended to the Board approval of the financial statements for the year ended 31 December<br />
<strong>2011</strong>, with the Independent Auditor’s <strong>Report</strong> thereon.<br />
Review of Internal Controls and Risk Management Systems<br />
• May and August : The Committee considered the reports of Internal Audit, including status in implementing its<br />
<strong>2011</strong> recommendations.<br />
• November <strong>2011</strong> : The Committee received a presentation by an external consultant on the best practices on risk<br />
management. It is satisfied that given the nature of the Group’s business, the oversight and<br />
management of risk should be embedded in the existing operating functions instead of establishing<br />
a separate enterprise risk management team.<br />
The Committee considered and endorsed management’s proposals to further strengthen the risk<br />
identification and assessment process; communications with Internal Audit; future reporting to Audit<br />
Committee on key risks (by adopting a more structured approach). In this light, it was decided that<br />
three Audit Committee meetings would be held every year.<br />
Overview Strategy in Action<br />
Corporate Governance Financial Statements and Valuation<br />
<strong>Hysan</strong> <strong>Annual</strong> <strong>Report</strong> <strong>2011</strong><br />
89
Audit Committee <strong>Report</strong> continued<br />
Review of Internal Controls and Risk Management Systems continued<br />
• March 2012 : <strong>2011</strong> annual internal controls review – the Committee considered reports from and upon receiving<br />
confirmation of management and Internal Audit, was satisfied as to the effectiveness of the<br />
<strong>Company</strong>’s internal controls system (including the adequacy of resources, qualifications and<br />
experience of staff of the Group’s accounting and financial reporting function, and their training<br />
programmes and budget). There were no matters of material concern relating to financial, operational,<br />
or compliance controls.<br />
Relationship with External Auditor<br />
• August <strong>2011</strong> : The Committee reviewed and considered the terms of engagement of the external auditor in respect<br />
of the <strong>2011</strong> annual audit and the related results announcement and annual confirmation.<br />
• March 2012 : The Committee assessed the auditor’s independence and objectivity. Factors considered include the<br />
arrangement for lead audit partner rotation, and the provision of non-audit services by the auditor.<br />
The Committee recommended to the Board that the shareholders be asked to re-appoint Deloitte<br />
Touche Tohmatsu as the Group’s external auditor for 2012.<br />
The Committee also reviewed and considered the terms of engagement of the external auditor in<br />
respect of the 2012 interim results review.<br />
For the year ended 31 December <strong>2011</strong>, external auditor received a total fee of HK$2,242,000 (audit<br />
services: HK$1,910,000 and non-audit services: HK$332,000).<br />
Members of the Audit Committee<br />
Nicholas Charles ALLEN (Chairman)<br />
Philip Yan Hok FAN<br />
Anthony Hsien Pin LEE<br />
Hong Kong, 8 March 2012<br />
90 <strong>Hysan</strong> <strong>Annual</strong> <strong>Report</strong> <strong>2011</strong>
Overview<br />
4<br />
Financial Statements<br />
and Valuation<br />
92 Directors’ Responsibility for the Financial Statements<br />
93 Independent Auditor’s <strong>Report</strong><br />
94 Consolidated Income Statement<br />
95 Consolidated Statement of Comprehensive Income<br />
96 Consolidated Statement of Financial Position<br />
97 Statement of Financial Position<br />
98 Consolidated Statement of Changes in Equity<br />
100 Consolidated Statement of Cash Flows<br />
102 Significant Accounting Policies<br />
112 Notes to the Financial Statements<br />
160 Financial Risk Management<br />
170 Five-Year Financial Summary<br />
172 <strong>Report</strong> of the Valuer<br />
173 Schedule of Principal Properties<br />
175 Shareholding Analysis<br />
176 Shareholder Information<br />
Strategy in Action Corporate Governance Financial Statements and Valuation<br />
<strong>Hysan</strong> <strong>Annual</strong> <strong>Report</strong> <strong>2011</strong><br />
91
Directors’ Responsibility for the Financial Statements<br />
The Companies Ordinance requires the Directors to prepare financial statements for each financial year which give a true and<br />
fair view of the state of affairs of the <strong>Company</strong> and of the Group as at the end of the financial year and of their respective profit<br />
or loss for the year then ended. In preparing the financial statements, the Directors are required to:<br />
(a) select suitable accounting policies and apply them on a consistent basis, making judgments and estimates that are<br />
prudent, fair and reasonable;<br />
(b) state the reasons for any significant departure from accounting standards; and<br />
(c) prepare the financial statements on the going concern basis, unless it is not appropriate to presume that the <strong>Company</strong> and<br />
the Group will continue in business for the foreseeable future.<br />
The Directors are responsible for keeping proper accounting records, for safeguarding the assets of the <strong>Company</strong> and of the<br />
Group and for taking reasonable steps for the prevention and detection of fraud and other irregularities.<br />
92 <strong>Hysan</strong> <strong>Annual</strong> <strong>Report</strong> <strong>2011</strong>
Independent Auditor’s <strong>Report</strong><br />
Overview<br />
To the Members of <strong>Hysan</strong> <strong>Development</strong> <strong>Company</strong> <strong>Limited</strong><br />
(incorporated in Hong Kong with limited liability)<br />
We have audited the consolidated financial statements of <strong>Hysan</strong> <strong>Development</strong> <strong>Company</strong> <strong>Limited</strong> (the “<strong>Company</strong>”) and its<br />
subsidiaries (collectively referred to as the “Group”) set out on pages 94 to 169, which comprise the consolidated and<br />
<strong>Company</strong>’s statements of financial position as at 31 December <strong>2011</strong>, and the consolidated income statement, consolidated<br />
statement of comprehensive income, consolidated statement of changes in equity and consolidated statement of cash flows for<br />
the year then ended, and a summary of significant accounting policies and other explanatory information.<br />
Directors’ Responsibility for the Consolidated Financial Statements<br />
The directors of the <strong>Company</strong> are responsible for the preparation of consolidated financial statements that give a true and<br />
fair view in accordance with Hong Kong Financial <strong>Report</strong>ing Standards issued by the Hong Kong Institute of Certified Public<br />
Accountants and the Hong Kong Companies Ordinance, and for such internal control as the directors determine is necessary to<br />
enable the preparation of consolidated financial statements that are free from material misstatement, whether due to fraud or<br />
error.<br />
Auditor’s Responsibility<br />
Our responsibility is to express an opinion on these consolidated financial statements based on our audit and to report our<br />
opinion solely to you, as a body, in accordance with section 141 of the Hong Kong Companies Ordinance, and for no other<br />
purpose. We do not assume responsibility towards or accept liability to any other person for the contents of this report. We<br />
conducted our audit in accordance with Hong Kong Standards on Auditing issued by the Hong Kong Institute of Certified Public<br />
Accountants. Those standards require that we comply with ethical requirements and plan and perform the audit to obtain<br />
reasonable assurance about whether the consolidated financial statements are free from material misstatement.<br />
An audit involves performing procedures to obtain audit evidence about the amounts and disclosures in the consolidated<br />
financial statements. The procedures selected depend on the auditor’s judgment, including the assessment of the risks<br />
of material misstatement of the consolidated financial statements, whether due to fraud or error. In making those risk<br />
assessments, the auditor considers internal control relevant to the entity’s preparation of consolidated financial statements that<br />
give a true and fair view in order to design audit procedures that are appropriate in the circumstances, but not for the purpose of<br />
expressing an opinion on the effectiveness of the entity’s internal control. An audit also includes evaluating the appropriateness<br />
of accounting policies used and the reasonableness of accounting estimates made by the directors, as well as evaluating the<br />
overall presentation of the consolidated financial statements.<br />
We believe that the audit evidence we have obtained is sufficient and appropriate to provide a basis for our audit opinion.<br />
Opinion<br />
In our opinion, the consolidated financial statements give a true and fair view of the state of affairs of the <strong>Company</strong> and of the<br />
Group as at 31 December <strong>2011</strong>, and of the Group’s profit and cash flows for the year then ended in accordance with Hong Kong<br />
Financial <strong>Report</strong>ing Standards and have been properly prepared in accordance with the Hong Kong Companies Ordinance.<br />
Deloitte Touche Tohmatsu<br />
Certified Public Accountants<br />
Hong Kong<br />
8 March 2012<br />
Strategy in Action Corporate Governance Financial Statements and Valuation<br />
<strong>Hysan</strong> <strong>Annual</strong> <strong>Report</strong> <strong>2011</strong><br />
93
Consolidated Income Statement<br />
For the year ended 31 December <strong>2011</strong><br />
<strong>2011</strong> 2010<br />
Notes HK$ million HK$ million<br />
Turnover 4 1,922 1,764<br />
Property expenses (262) (250)<br />
Gross profit 1,660 1,514<br />
Investment income 6 90 49<br />
Other gains and losses 7 (34) (42)<br />
Administrative expenses (173) (140)<br />
Finance costs 8 (122) (117)<br />
Change in fair value of investment properties 7,532 2,594<br />
Share of results of associates 254 394<br />
Profit before taxation 9,207 4,252<br />
Taxation 9 (217) (201)<br />
Profit for the year 10 8,990 4,051<br />
Profit for the year attributable to:<br />
Owners of the <strong>Company</strong> 8,545 3,844<br />
Non-controlling interests 445 207<br />
8,990 4,051<br />
Earnings per share (expressed in HK cents) 15<br />
Basic 808.34 365.47<br />
Diluted 807.71 365.16<br />
94 <strong>Hysan</strong> <strong>Annual</strong> <strong>Report</strong> <strong>2011</strong>
Consolidated Statement of Comprehensive Income<br />
For the year ended 31 December <strong>2011</strong><br />
<strong>2011</strong> 2010<br />
Note HK$ million HK$ million<br />
Profit for the year 8,990 4,051<br />
Other comprehensive income: 11<br />
Losses arising from equity investments designated as at fair value<br />
through other comprehensive income (121) –<br />
Gains arising from available-for-sale investments – 150<br />
Net gains (losses) on cash flow hedges 4 (22)<br />
Gain on revaluation of properties held for own use 71 29<br />
Share of translation reserve of an associate 155 103<br />
Other comprehensive income for the year (net of tax) 109 260<br />
Total comprehensive income for the year 9,099 4,311<br />
Total comprehensive income attributable to:<br />
Owners of the <strong>Company</strong> 8,654 4,104<br />
Non-controlling interests 445 207<br />
9,099 4,311<br />
Overview<br />
Strategy in Action Corporate Governance Financial Statements and Valuation<br />
<strong>Hysan</strong> <strong>Annual</strong> <strong>Report</strong> <strong>2011</strong><br />
95
Consolidated Statement of Financial Position<br />
At 31 December <strong>2011</strong><br />
<strong>2011</strong> 2010<br />
Notes HK$ million HK$ million<br />
Non-current assets<br />
Investment properties 16 49,969 40,833<br />
Property, plant and equipment 17 530 429<br />
Investments in associates 19 3,423 3,014<br />
Principal-protected investments 20 365 378<br />
Term notes 21 259 168<br />
Equity investments 22 989 –<br />
Available-for-sale investments 22 – 1,152<br />
Other financial assets 23 68 90<br />
Other receivables 163 79<br />
55,766 46,143<br />
Current assets<br />
Accounts receivable and other receivables 24 134 98<br />
Amount due from an associate 26 – 139<br />
Principal-protected investments 20 265 84<br />
Term notes 21 171 95<br />
Other financial assets 23 71 2<br />
Time deposits 27 2,899 1,930<br />
Cash and bank balances 27 62 63<br />
3,602 2,411<br />
Current liabilities<br />
Accounts payable and accruals 28 532 433<br />
Rental deposits from tenants 170 175<br />
Amounts due to non-controlling interests 29 327 327<br />
Borrowings 30 1,507 650<br />
Other financial liabilities 23 19 –<br />
Taxation payable 73 50<br />
2,628 1,635<br />
Net current assets 974 776<br />
Total assets less current liabilities 56,740 46,919<br />
Non-current liabilities<br />
Borrowings 30 5,156 3,937<br />
Other financial liabilities 23 50 52<br />
Rental deposits from tenants 430 276<br />
Deferred taxation 31 360 337<br />
5,996 4,602<br />
Net assets 50,744 42,317<br />
Capital and reserves<br />
Share capital 32 5,299 5,267<br />
Reserves 43,454 35,410<br />
Equity attributable to owners of the <strong>Company</strong> 48,753 40,677<br />
Non-controlling interests 1,991 1,640<br />
Total equity 50,744 42,317<br />
The consolidated financial statements on pages 94 to 169 were approved and authorised for issue by the Board of Directors on<br />
8 March 2012 and are signed on its behalf by:<br />
96 <strong>Hysan</strong> <strong>Annual</strong> <strong>Report</strong> <strong>2011</strong><br />
Irene Y.L. LEE<br />
Director<br />
Gerry L.F. YIM<br />
Director
Statement of Financial Position<br />
At 31 December <strong>2011</strong><br />
<strong>2011</strong> 2010<br />
Notes HK$ million HK$ million<br />
Non-current assets<br />
Property, plant and equipment 17 10 9<br />
Investments in subsidiaries 18 1,904 –<br />
Available-for-sale investments 22 – 2<br />
Other financial assets 23 2 –<br />
Amounts due from subsidiaries 25 5,126 –<br />
7,042 11<br />
Current assets<br />
Other receivables 5 5<br />
Amounts due from subsidiaries 25 6,088 12,671<br />
Time deposits 27 466 547<br />
Cash and bank balances 27 25 33<br />
6,584 13,256<br />
Current liabilities<br />
Other payable and accruals 36 38<br />
Amounts due to subsidiaries 25 480 175<br />
Taxation payable 5 2<br />
521 215<br />
Net current assets 6,063 13,041<br />
Total assets less current liabilities 13,105 13,052<br />
Non-current liability<br />
Deferred taxation 31 1 –<br />
Net assets 13,104 13,052<br />
Capital and reserves<br />
Share capital 32 5,299 5,267<br />
Reserves 33 7,805 7,785<br />
Total equity 13,104 13,052<br />
The financial statements on pages 94 to 169 were approved and authorised for issue by the Board of Directors on 8 March<br />
2012 and are signed on its behalf by:<br />
Irene Y.L. LEE<br />
Director<br />
Gerry L.F. YIM<br />
Director<br />
Overview<br />
Strategy in Action Corporate Governance Financial Statements and Valuation<br />
<strong>Hysan</strong> <strong>Annual</strong> <strong>Report</strong> <strong>2011</strong><br />
97
Consolidated Statement of Changes in Equity<br />
For the year ended 31 December <strong>2011</strong><br />
Attributable to owners of the <strong>Company</strong><br />
Share Capital<br />
Share Share options redemption<br />
capital premium reserve reserve<br />
HK$ million HK$ million HK$ million HK$ million<br />
At 1 January 2010 5,253 1,703 10 276<br />
Profit for the year – – – –<br />
Change in fair value of available-for-sale investments – – – –<br />
Change in fair value of derivatives designated as cash flow hedges – – – –<br />
Transfer to profit and loss for cash flow hedges – – – –<br />
Gain on revaluation of properties held for own use – – – –<br />
Deferred taxation arising on revaluation of properties held for own use – – – –<br />
Share of translation reserve of an associate – – – –<br />
Total comprehensive income (expenses) for the year – – – –<br />
Issue of shares pursuant to scrip dividend schemes 14 50 – –<br />
Issue of shares under share option schemes – 1 – –<br />
Recognition of equity-settled share-based payments – – 6 –<br />
Dividends paid during the year (note 14) – – – –<br />
At 31 December 2010 5,267 1,754 16 276<br />
Profit for the year – – – –<br />
Change in fair value of equity investments – – – –<br />
Change in fair value of derivatives designated as cash flow hedges – – – –<br />
Transfer to profit and loss for cash flow hedges – – – –<br />
Gain on revaluation of properties held for own use – – – –<br />
Deferred taxation arising on revaluation of properties held for own use – – – –<br />
Share of translation reserve of an associate – – – –<br />
Total comprehensive (expenses) income for the year – – – –<br />
Issue of shares pursuant to scrip dividend schemes 26 159 – –<br />
Issue of shares under share option schemes 6 21 (6) –<br />
Recognition of equity-settled share-based payments – – 7 –<br />
Forfeiture of share options – – (2) –<br />
Dividends paid during the year (note 14) – – – –<br />
Transfer to retained profits upon disposal of equity investments – – – –<br />
At 31 December <strong>2011</strong> 5,299 1,934 15 276<br />
98 <strong>Hysan</strong> <strong>Annual</strong> <strong>Report</strong> <strong>2011</strong>
Attributable to owners of the <strong>Company</strong><br />
Investments<br />
Properties<br />
General revaluation Hedging revaluation Translation Retained Non-controlling<br />
reserve reserve reserve reserve reserve profits Total interests Total<br />
HK$ million HK$ million HK$ million HK$ million HK$ million HK$ million HK$ million HK$ million HK$ million<br />
Overview<br />
100 809 (22) 175 153 28,759 37,216 1,516 38,732<br />
– – – – – 3,844 3,844 207 4,051<br />
– 150 – – – – 150 – 150<br />
– – (40) – – – (40) – (40)<br />
– – 18 – – – 18 – 18<br />
– – – 34 – – 34 – 34<br />
– – – (5) – – (5) – (5)<br />
– – – – 103 – 103 – 103<br />
– 150 (22) 29 103 3,844 4,104 207 4,311<br />
– – – – – – 64 – 64<br />
– – – – – – 1 – 1<br />
– – – – – – 6 – 6<br />
– – – – – (714) (714) (83) (797)<br />
100 959 (44) 204 256 31,889 40,677 1,640 42,317<br />
– – – – – 8,545 8,545 445 8,990<br />
– (121) – – – – (121) – (121)<br />
– – (25) – – – (25) – (25)<br />
– – 29 – – – 29 – 29<br />
– – – 85 – – 85 – 85<br />
– – – (14) – – (14) – (14)<br />
– – – – 155 – 155 – 155<br />
– (121) 4 71 155 8,545 8,654 445 9,099<br />
– – – – – – 185 – 185<br />
– – – – – – 21 – 21<br />
– – – – – – 7 – 7<br />
– – – – – 2 – – –<br />
– – – – – (791) (791) (94) (885)<br />
– (33) – – – 33 – – –<br />
100 805 (40) 275 411 39,678 48,753 1,991 50,744<br />
Strategy in Action Corporate Governance Financial Statements and Valuation<br />
<strong>Hysan</strong> <strong>Annual</strong> <strong>Report</strong> <strong>2011</strong><br />
99
Consolidated Statement of Cash Flows<br />
For the year ended 31 December <strong>2011</strong><br />
<strong>2011</strong> 2010<br />
Note HK$ million HK$ million<br />
Operating activities<br />
Profit before taxation 9,207 4,252<br />
Adjustments for:<br />
Other gains and losses 34 42<br />
Finance costs 122 117<br />
Change in fair value of investment properties (7,532) (2,594)<br />
Share of results of associates (254) (394)<br />
Dividend income (54) (34)<br />
Interest income (36) (15)<br />
Depreciation of property, plant and equipment 8 8<br />
Share-based payment expenses 7 6<br />
Operating cash flows before movements in working capital 1,502 1,388<br />
Increase in accounts receivable and other receivables (28) (45)<br />
(Decrease) increase in accounts payable and accruals (31) 66<br />
Increase in rental deposits from tenants 149 51<br />
Cash generated from operations 1,592 1,460<br />
Hong Kong profits tax paid (185) (171)<br />
Hong Kong profits tax refund – 10<br />
Net cash from operating activities 1,407 1,299<br />
Investing activities<br />
Interest received 40 12<br />
Dividends received from equity investments 54 –<br />
Dividends received from available-for-sale investments – 34<br />
Proceeds on disposal of an investment property – 50<br />
Proceeds on disposal of equity investments 40 –<br />
Proceeds upon maturity of principal-protected investments 85 169<br />
Proceeds upon maturity of term notes 91 –<br />
Proceeds upon maturity of time deposits with original maturity over three months 1,928 2,225<br />
Repayment from an associate 139 230<br />
Payments in respect of investment properties (1,520) (871)<br />
Purchases of property, plant and equipment (8) (7)<br />
Purchases of term notes (264) (266)<br />
Purchases of other financial assets (60) –<br />
Additions to principal-protected investments (251) (432)<br />
Acquisition of a subsidiary 34 (19) –<br />
Additions to time deposits with original maturity over three months (2,802) (2,107)<br />
Net cash used in investing activities (2,547) (963)<br />
100 <strong>Hysan</strong> <strong>Annual</strong> <strong>Report</strong> <strong>2011</strong>
<strong>2011</strong> 2010<br />
Note HK$ million HK$ million<br />
Financing activities<br />
Interest paid (128) (97)<br />
Payment of other finance costs (12) (11)<br />
Medium Term Note Programme expenses (2) (1)<br />
Dividends paid (606) (650)<br />
Dividends paid to non-controlling interests of a subsidiary (94) (83)<br />
Repayment of bank loans (849) (600)<br />
Redemption of fixed rate notes – (68)<br />
New bank loans 2,350 500<br />
Issue of fixed rate notes 554 800<br />
Proceeds on exercise of share options 21 1<br />
Net cash from (used in) financing activities 1,234 (209)<br />
Net increase in cash and cash equivalents 94 127<br />
Cash and cash equivalents at 1 January 560 433<br />
Cash and cash equivalents at 31 December 27 654 560<br />
Overview<br />
Strategy in Action Corporate Governance Financial Statements and Valuation<br />
<strong>Hysan</strong> <strong>Annual</strong> <strong>Report</strong> <strong>2011</strong><br />
101
Significant Accounting Policies<br />
For the year ended 31 December <strong>2011</strong><br />
These financial statements have been prepared on the historical cost basis except for certain properties and financial<br />
instruments, which are measured at revalued amounts or fair values, as explained in the accounting policies set out below.<br />
These financial statements have been prepared in accordance with Hong Kong Financial <strong>Report</strong>ing Standards issued by the<br />
Hong Kong Institute of Certified Public Accountants and the Hong Kong Companies Ordinance. In addition, these financial<br />
statements include applicable disclosures required by the Rules Governing the Listing of Securities on The Stock Exchange of<br />
Hong Kong <strong>Limited</strong>. The principal accounting policies adopted are as follows:<br />
1. Basis of Consolidation<br />
The consolidated financial statements incorporate the financial statements of the <strong>Company</strong> and entities controlled by the<br />
<strong>Company</strong> (its subsidiaries). Control is achieved where the <strong>Company</strong> has the power to govern the financial and operating policies<br />
of an entity so as to obtain benefits from its activities.<br />
The results of subsidiaries acquired or disposed of during the year are included in the consolidated income statement from the<br />
effective date of acquisition or up to the effective date of disposal, as appropriate.<br />
Where necessary, adjustments are made to the financial statements of subsidiaries to bring their accounting policies into line<br />
with those used by other members of the Group.<br />
All intra-group transactions, balances, income and expenses are eliminated in full on consolidation.<br />
Non-controlling interests in subsidiaries are presented separately from the Group’s equity therein.<br />
Total comprehensive income and expenses of a subsidiary are attributed to the owners of the <strong>Company</strong> and to the noncontrolling<br />
interests even if this results in the non-controlling interests having a deficit balance. Prior to 1 January 2010, losses<br />
applicable to the non-controlling interests in excess of the non-controlling interests in the subsidiary’s equity were allocated<br />
against the interests of the Group except to the extent that the non-controlling interests had a binding obligation and were able<br />
to make an additional investment to cover the losses.<br />
2. Investments in Subsidiaries<br />
Investments in subsidiaries are included in the <strong>Company</strong>’s statement of financial position at cost (including deemed capital<br />
contribution) less any identified impairment loss. The results of subsidiaries are accounted for by the <strong>Company</strong> on the basis of<br />
dividends received and receivable during the year.<br />
3. Investments in Associates<br />
An associate is an entity over which the Group has significant influence and that is neither a subsidiary nor an interest in a joint<br />
venture. Significant influence is the power to participate in the financial and operating policy decisions of the investee but is not<br />
control or joint control over those policies.<br />
The results, assets and liabilities of associates are incorporated in the consolidated financial statements using the equity<br />
method of accounting. Under the equity method, investments in associates are initially recognised in the consolidated<br />
statement of financial position at cost and adjusted thereafter to recognise the Group’s share of the profit or loss and other<br />
comprehensive income of the associates. When the Group’s share of losses of an associate equals or exceeds its interest<br />
in that associate (which includes any long-term interests that, in substance, form part of the Group’s net investment in the<br />
associate), the Group discontinues recognising its share of further losses. Additional losses are recognised only to the extent<br />
that the Group has incurred legal or constructive obligations or made payments on behalf of that associate.<br />
Where a group entity transacts with its associate, profits and losses resulting from the transactions with the associate are<br />
recognised in the Group’s consolidated financial statements only to the extent of the interests in the associate that are not<br />
related to the Group.<br />
102 <strong>Hysan</strong> <strong>Annual</strong> <strong>Report</strong> <strong>2011</strong>
4. Investment Properties<br />
Investment properties are properties held to earn rental and/or for capital appreciation including properties under<br />
redevelopment for such proposes.<br />
Investment properties are initially measured at cost, including any directly attributable expenditure. Subsequent to initial<br />
recognition, investment properties are measured at their fair values using the fair value model. Gains or losses arising<br />
from changes in the fair value of investment properties are included in profit or loss for the period in which they arise. If<br />
an investment property becomes an item of property, plant and equipment because its use has changed as evidenced by<br />
commencement of owner-occupation, the property’s deemed cost for subsequent accounting is its fair value at the date of<br />
change in use.<br />
Overview<br />
Construction costs incurred for investment properties under redevelopment are capitalised as part of the carrying amount of<br />
the investment properties under redevelopment. Investment properties under redevelopment are measured at fair value at the<br />
end of the reporting period. Any difference between the fair value of the investment properties under redevelopment and their<br />
carrying amount is recognised in profit or loss in the period in which they arise.<br />
An investment property is derecognised upon disposal or when the investment property is permanently withdrawn from use or<br />
no future economic benefits are expected from its disposal. Any gain or loss arising on derecognition of the asset (calculated as<br />
the difference between the net disposal proceeds and the carrying amount of the asset) is included in the profit or loss in the<br />
period in which the item is derecognised.<br />
5. PROPERTY, PLANT AND EQUIPMENT<br />
Property, plant and equipment including land and buildings held for use in the production or supply of goods or services, or<br />
for administrative purposes are stated at cost or fair value less subsequent accumulated depreciation and accumulated<br />
impairment losses.<br />
Any revaluation increase arising on revaluation of land and buildings is recognised in other comprehensive income and<br />
accumulated in the properties revaluation reserve, except to the extent that it reverses a revaluation decrease of the same<br />
asset previously recognised in profit or loss, in which case the increase is credited to profit or loss to the extent of the decrease<br />
previously charged. A decrease in net carrying amount arising on revaluation of an asset is recognised in profit or loss to the<br />
extent that it exceeds the balance, if any, on the properties revaluation reserve relating to a previous revaluation of that asset.<br />
On the subsequent sale or retirement of a revalued asset, the corresponding revaluation surplus is transferred to retained<br />
profits.<br />
Depreciation is recognised so as to write off the cost or fair value of items of property, plant and equipment less their estimated<br />
residual values over their estimated useful lives, using the straight-line method. The estimated useful lives, residual values and<br />
depreciation method are reviewed at the end of the reporting period, with the effect of any changes in estimate accounted for<br />
on a prospective basis.<br />
If an item of property, plant and equipment becomes an investment property because its use has changed as evidenced by<br />
end of owner-occupation, any difference between the carrying amount and the fair value of that item at the date of transfer<br />
is recognised in other comprehensive income and accumulated in property revaluation reserve. On the subsequent sale or<br />
retirement of the asset, the relevant revaluation reserve will be transferred directly to retained profits.<br />
An item of property, plant and equipment is derecognised upon disposal or when no future economic benefits are expected to<br />
arise from the continued use of the asset. Any gain or loss arising on the disposal or retirement of an item of property, plant and<br />
equipment is determined as the difference between the sales proceeds and the carrying amount of the asset and is recognised<br />
in profit or loss.<br />
Strategy in Action Corporate Governance Financial Statements and Valuation<br />
<strong>Hysan</strong> <strong>Annual</strong> <strong>Report</strong> <strong>2011</strong><br />
103
Significant Accounting Policies continued<br />
For the year ended 31 December <strong>2011</strong><br />
6. IMPAIRMENT OF NON-FINANCIAL ASSETS<br />
At the end of the reporting period, the Group or the <strong>Company</strong> reviews the carrying amounts of their assets to determine whether<br />
there is any indication that those assets have suffered an impairment loss. If any such indication exists, the recoverable<br />
amount of the asset is estimated in order to determine the extent of the impairment loss. If the recoverable amount of an asset<br />
is estimated to be less than its carrying amount, the carrying amount of the asset is reduced to its recoverable amount. An<br />
impairment loss is recognised as an expense immediately in profit or loss, unless the relevant asset is carried at a revalued<br />
amount, in which case the impairment loss is treated as a revaluation decrease.<br />
Where an impairment loss subsequently reverses, the carrying amount of the asset is increased to the revised estimate of its<br />
recoverable amount, but so that the increased carrying amount does not exceed the carrying amount that would have been<br />
determined had no impairment loss been recognised for the asset in prior years. A reversal of an impairment loss is recognised<br />
as income immediately in profit or loss, unless the relevant asset is carried at revalued amount, in which case the reversal of<br />
the impairment loss is treated as a revaluation increase.<br />
7. FINANCIAL INSTRUMENTS<br />
Financial assets and financial liabilities are recognised in the statement of financial position when a group entity becomes<br />
a party to the contractual provisions of the instrument. Financial assets and financial liabilities are initially measured at fair<br />
value. Transaction costs that are directly attributable to the acquisition or issue of financial assets and financial liabilities (other<br />
than financial assets and financial liabilities at fair value through profit or loss) are added to or deducted from the fair value<br />
of the financial assets or financial liabilities, as appropriate, on initial recognition. Transaction costs directly attributable to the<br />
acquisition of financial assets or financial liabilities at fair value through profit or loss are recognised immediately in profit or<br />
loss.<br />
Financial assets<br />
(a) Classification and measurement prior to 1 January <strong>2011</strong><br />
The Group’s financial assets are classified into one of the four categories, including (i) financial assets at fair value through<br />
profit or loss (“FVTPL”), (ii) loans and receivables, (iii) held-to-maturity investments and (iv) available-for-sale financial assets.<br />
The <strong>Company</strong>’s financial assets are classified into (i) loans and receivables and (ii) available-for-sale financial assets. The<br />
classification depends on the nature and purpose of the financial assets and is determined at the time of initial recognition.<br />
All regular way purchases or sales of financial assets are recognised and derecognised on a trade date basis. Regular way<br />
purchases or sales are purchases or sales of financial assets that require delivery of assets within the time frame established<br />
by regulation or convention in the marketplace. The accounting policies adopted in respect of each category of financial assets<br />
are set out below.<br />
(i) Financial assets at FVTPL<br />
Financial assets are classified as at FVTPL where the financial asset is either held for trading or it is designated as at FVTPL.<br />
A financial asset is classified as held for trading if it has been acquired principally for the purpose of selling in the near future or<br />
it is a derivative that is not designated and effective as a hedging instrument.<br />
A financial asset other than the one held for trading may be designated as at FVTPL upon initial recognition if it contains one or<br />
more embedded derivatives and Hong Kong Accounting Standard (“HKAS”) 39 permits the entire combined contract (asset or<br />
liability) to be designated as at FVTPL.<br />
Financial assets at FVTPL are measured at fair value, with changes in fair value arising from remeasurement recognised directly<br />
in profit or loss in the period in which they arise. The net gain or loss recognised in profit or loss includes any dividend or<br />
interest earned on the financial assets.<br />
(ii) Loans and receivables<br />
Loans and receivables are non-derivative financial assets with fixed or determinable payments that are not quoted in an active<br />
market. Subsequent to initial recognition, loans and receivables (including accounts receivable and other receivables, amounts<br />
due from subsidiaries, amount due from an associate, unlisted debt securities (see note 21 of the Notes to the Financial<br />
Statements section), time deposits and bank balances) are carried at amortised cost using the effective interest method, less<br />
any identified impairment losses (see accounting policy on impairment of financial assets below).<br />
104 <strong>Hysan</strong> <strong>Annual</strong> <strong>Report</strong> <strong>2011</strong>
7. FINANCIAL INSTRUMENTS continued<br />
Financial assets continued<br />
(a) Classification and measurement prior to 1 January <strong>2011</strong> continued<br />
(iii) Held-to-maturity investments<br />
Held-to-maturity investments are non-derivative financial assets with fixed or determinable payments and fixed maturities that<br />
the Group’s management has the positive intention and ability to hold to maturity. The Group classified its listed debt securities,<br />
which are denominated in US dollars (“USD”) (see note 21 of the Notes to the Financial Statements section), as held-to-maturity<br />
investments. Subsequent to initial recognition, held-to-maturity investments are measured at amortised cost using the effective<br />
interest method, less any identified impairment losses (see accounting policy on impairment of financial assets below).<br />
(iv) Available-for-sale financial assets<br />
Available-for-sale financial assets are non-derivatives that are either designated as such or not classified as financial assets<br />
at FVTPL, loans and receivables or held-to-maturity investments. The Group or the <strong>Company</strong> designated investments in equity<br />
securities and club debentures (if any) as available-for-sale financial assets. Subsequent to initial recognition, available-for-sale<br />
financial assets (including certain equity securities investments and club debentures) are measured at fair value. Changes in<br />
fair value are recognised in other comprehensive income and accumulated in the investments revaluation reserve, until the<br />
financial asset is disposed of or is determined to be impaired, at which time, the cumulative gain or loss previously accumulated<br />
in the investments revaluation reserve is reclassified to profit or loss (see accounting policy on impairment of financial assets<br />
below).<br />
Subsequent to initial recognition, for available-for-sale equity investments that do not have a quoted market price in an active<br />
market and whose fair value cannot be reliably measured, they are measured at cost less any identified impairment losses (see<br />
accounting policy on impairment of financial assets below).<br />
(v) Effective interest method<br />
The effective interest method is a method of calculating the amortised cost of a financial asset and of allocating interest<br />
income over the relevant period. The effective interest rate is the rate that exactly discounts estimated future cash receipts<br />
(including all fees paid or received that form an integral part of the effective interest rate, transaction costs and other premiums<br />
or discounts) through the expected life of the financial asset or, where appropriate, a shorter period to the net carrying amount<br />
on initial recognition.<br />
Interest income is recognised on an effective interest basis for debt instruments, other than those financial assets classified<br />
as at FVTPL for which interest income is included in other gains and losses as disclosed in note 7 of the Notes to the Financial<br />
Statements section.<br />
(b) Classification and measurement on and after 1 January <strong>2011</strong><br />
All recognised financial assets are subsequently measured in their entirety at either amortised cost or fair value, depending on<br />
the classification of the financial assets.<br />
(i) Classification of financial assets<br />
Debt instruments and hybrid contracts that meet the following conditions are subsequently measured at amortised cost less<br />
impairment loss (except for debt investments that are designated as at fair value through profit or loss on initial recognition):<br />
• the asset is held within a business model whose objective is to hold assets in order to collect contractual cash flows; and<br />
• the contractual terms of the instrument give rise on specified dates to cash flows that are solely payments of principal and<br />
interest on the principal amount outstanding.<br />
All other financial assets are subsequently measured at fair value.<br />
(ii) Amortised cost and effective interest method<br />
The effective interest method is a method of calculating the amortised cost of a debt instrument and of allocating interest<br />
income over the relevant period. The effective interest rate is the rate that exactly discounts estimated future cash receipts<br />
(including all fees and points paid or received that form an integral part of the effective interest rate, transaction costs and<br />
other premiums or discounts) through the expected life of the debt instrument, or, where appropriate, a shorter period, to the<br />
net carrying amount on initial recognition.<br />
Interest income is recognised on an effective interest basis for debt instruments measured subsequently at amortised cost.<br />
Interest income is recognised in profit or loss and is included in the investment income as disclosed in note 6 of the Notes to<br />
the Financial Statements section.<br />
Overview<br />
Strategy in Action Corporate Governance Financial Statements and Valuation<br />
<strong>Hysan</strong> <strong>Annual</strong> <strong>Report</strong> <strong>2011</strong><br />
105
Significant Accounting Policies continued<br />
For the year ended 31 December <strong>2011</strong><br />
7. FINANCIAL INSTRUMENTS continued<br />
Financial assets continued<br />
(b) Classification and measurement on and after 1 January <strong>2011</strong> continued<br />
(iii) Financial assets at FVTPL<br />
Investments in equity instruments are classified as at FVTPL, unless the Group designates such investment that is not held for<br />
trading as at fair value through other comprehensive income (FVTOCI) on initial recognition (see (b)(iv) below).<br />
Debt instruments that do not meet the amortised cost criteria (see (b)(i) above) are measured at FVTPL. In addition, debt<br />
instruments that meet the amortised cost criteria but are designated as at FVTPL are measured at FVTPL. A debt instrument<br />
may be designated as at FVTPL upon initial recognition if such designation eliminates or significantly reduces a measurement or<br />
recognition inconsistency that would arise from measuring assets or liabilities or recognising the gains and losses on them on<br />
different bases. The Group or the <strong>Company</strong> has not designated any debt instrument as at FVTPL on initial application of Hong<br />
Kong Financial <strong>Report</strong>ing Standard (“HKFRS”) 9 and during the year.<br />
Debt instruments are reclassified from amortised cost to FVTPL when the business model is changed such that the amortised<br />
cost criteria are no longer met. Reclassification of debt instruments that are designated as at FVTPL on initial recognition is not<br />
allowed.<br />
Financial assets at FVTPL are measured at fair value at the end of each reporting period, with any gains or losses arising<br />
on remeasurement recognised in profit or loss. The net gain or loss recognised in profit or loss is included in other gains<br />
and losses as disclosed in note 7 of the Notes to the Financial Statements section. Fair value is determined in the manner<br />
described in note 3 of the notes to the Financial Risk Management section.<br />
Interest income on debt instruments as at FVTPL is included in other gains and losses described above.<br />
(iv) Financial assets at FVTOCI<br />
On initial recognition, the Group or the <strong>Company</strong> can make an irrevocable election (on an instrument-by-instrument basis) to<br />
designate investments in equity instruments as at FVTOCI. Designation at FVTOCI is not permitted if the equity investment is<br />
held for trading.<br />
A financial asset is held for trading if it has been acquired principally for the purpose of selling it in the near term or it is a<br />
derivative that is not designated and effective as a hedging instrument.<br />
Investments in equity instruments at FVTOCI are initially measured at fair value plus transaction costs. Subsequently, they are<br />
measured at fair value with gains and losses arising from changes in fair value recognised in other comprehensive income and<br />
accumulated in the investments revaluation reserve. The cumulative gain or loss will not be reclassified to profit or loss on<br />
disposal of the investments.<br />
The Group or the <strong>Company</strong> has designated all investments in equity instruments (listed or unlisted) that are not held for trading<br />
as at FVTOCI on initial application of HKFRS 9 and during the year (see note 22 of the Notes to the Financial Statements<br />
section).<br />
Dividends on these investments in equity instruments are recognised in profit or loss when the Group’s or the <strong>Company</strong>’s<br />
right to receive the dividends is established in accordance with HKAS 18 “Revenue”, unless the dividends clearly represent a<br />
recovery of part of the cost of the investment. Dividends earned are recognised in profit or loss and are included in investment<br />
income as disclosed in note 6 of the Notes to the Financial Statements section.<br />
(c) Impairment of financial assets<br />
Financial assets, other than those at FVTPL and FVTOCI, are assessed for indicators of impairment at the end of the reporting<br />
period. Financial assets are impaired when there is objective evidence that, as a result of one or more events that occurred<br />
after the initial recognition of the financial asset, the estimated future cash flows of the financial assets have been affected.<br />
Prior to 1 January <strong>2011</strong>, for an available-for-sale equity investment, a significant or prolonged decline in the fair value of that<br />
investment below its cost is considered to be objective evidence of impairment. When an available-for-sale financial asset is<br />
considered to be impaired, cumulative gains or losses previously recognised in other comprehensive income are reclassified<br />
to profit or loss in the period in which the impairment takes place. Impairment losses for available-for-sale equity investments<br />
will not be reversed through profit or loss in subsequent periods. Any increase in fair value subsequent to impairment loss<br />
is recognised directly in other comprehensive income and accumulated in investments revaluation reserve. For available-forsale<br />
debt investments, impairment losses are subsequently reversed if an increase in the fair value of the investment can be<br />
objectively related to an event occurring after the recognition of the impairment loss.<br />
106 <strong>Hysan</strong> <strong>Annual</strong> <strong>Report</strong> <strong>2011</strong>
7. FINANCIAL INSTRUMENTS continued<br />
Financial assets continued<br />
(c) Impairment of financial assets continued<br />
For all other financial assets, objective evidence of impairment could include:<br />
Overview<br />
• significant financial difficulty of the issuer or counterparty; or<br />
• breach of contract, such as default or delinquency in interest or principal payments; or<br />
• it becoming probable that the borrower will enter bankruptcy or financial re-organisation; or<br />
• the disappearance of an active market for that financial asset because of financial difficulties.<br />
For certain categories of financial asset, such as accounts receivable, assets that are assessed not to be impaired individually<br />
are subsequently assessed for impairment on a collective basis. Objective evidence of impairment for a portfolio of receivables<br />
could include the Group’s past experience of collecting payments, an increase in the number of delayed payments in the<br />
portfolio past the average credit period, observable changes in national or local economic conditions that correlate with default<br />
on receivables.<br />
For financial assets carried at amortised cost, an impairment loss is recognised in profit or loss when there is objective<br />
evidence that the asset is impaired, and is measured as the difference between the asset’s carrying amount and the present<br />
value of the estimated future cash flows discounted at the original effective interest rate.<br />
Prior to 1 January <strong>2011</strong>, for financial assets carried at cost, the amount of the impairment loss is measured as the difference<br />
between the asset’s carrying amount and the present value of the estimated future cash flows discounted at the current market<br />
rate of return for a similar financial asset. Such impairment loss will not be reversed in subsequent periods.<br />
The carrying amount of the financial asset is reduced by the impairment loss directly for all financial assets with the exception<br />
of accounts receivable and amounts due from subsidiaries and an associate, where the carrying amount is reduced through the<br />
use of an allowance account. Changes in the carrying amount of the allowance account are recognised in profit or loss. When<br />
an account receivable or an amount due from a subsidiary or an associate is considered uncollectible, it is written off against<br />
the allowance account. Subsequent recoveries of amounts previously written off are credited to profit or loss.<br />
For financial assets measured at amortised cost, if, in a subsequent period, the amount of impairment loss decreases and the<br />
decrease can be related objectively to an event occurring after the impairment losses was recognised, the previously recognised<br />
impairment loss is reversed through profit or loss to the extent that the carrying amount of the asset at the date of impairment<br />
is reversed does not exceed what the amortised cost would have been had the impairment not been recognised.<br />
(d) Derecognition of financial assets<br />
Financial assets are derecognised when the contractual rights to receive cash flows from the assets expire or, the financial<br />
assets are transferred and the Group or the <strong>Company</strong> has transferred substantially all the risks and rewards of ownership of the<br />
financial assets.<br />
On derecognition of a financial asset in its entirely, except for a financial asset that is classified as at FVTOCI, the difference<br />
between the asset’s carrying amount and the sum of the consideration received and receivable and the cumulative gain or loss<br />
that had been recognised in other comprehensive income and accumulated in investments revaluation reserve is recognised in<br />
profit or loss.<br />
On derecognition of a financial asset that is classified as at FVTOCI, the cumulative gain or loss previously accumulated in the<br />
investments revaluation reserve is not reclassified to profit or loss, but is transferred to retained profits.<br />
Financial liabilities and equity<br />
(a) Classification and measurement<br />
Financial liabilities and equity instruments issued by a group entity are classified according to the substance of the contractual<br />
arrangements entered into and the definitions of a financial liability and an equity instrument.<br />
An equity instrument is any contract that evidences a residual interest in the assets of the Group or the <strong>Company</strong> after<br />
deducting all of its liabilities. The Group’s financial liabilities are generally classified into (i) financial liabilities at FVTPL and (ii)<br />
other financial liabilities subsequently measured at amortised cost. The <strong>Company</strong>’s financial liabilities are generally classified<br />
into other financial liabilities subsequently measured at amortised cost. The accounting policies adopted in respect of financial<br />
liabilities and equity instruments are set out below.<br />
Strategy in Action Corporate Governance Financial Statements and Valuation<br />
<strong>Hysan</strong> <strong>Annual</strong> <strong>Report</strong> <strong>2011</strong><br />
107
Significant Accounting Policies continued<br />
For the year ended 31 December <strong>2011</strong><br />
7. FINANCIAL INSTRUMENTS continued<br />
Financial liabilities and equity continued<br />
(a) Classification and measurement continued<br />
(i) Financial liabilities at FVTPL<br />
Financial liabilities at FVTPL, representing those as held for trading, comprise derivatives that are not designated and effective<br />
as hedging instruments.<br />
Financial liabilities at FVTPL are measured at fair value, with changes in fair value arising on remeasurement recognised directly<br />
in profit or loss in the period in which they arise. The net gain or loss recognised in profit or loss includes any interest paid on<br />
the financial liabilities and is included in other gains and losses as disclosed in note 7 of the Notes to the Financial Statements<br />
section.<br />
(ii) Other financial liabilities subsequently measured at amortised cost<br />
Other financial liabilities (including accounts payable and accruals, other payable, amounts due to subsidiaries, amounts due<br />
to non-controlling interests and borrowings) are subsequently measured at amortised cost, using the effective interest method.<br />
Interest expense that is not capitalised as part of costs of an asset is included in finance costs as disclosed in note 8 of the<br />
Notes to the Financial Statements section.<br />
(iii) Equity instruments<br />
Equity instruments issued by the <strong>Company</strong> are recorded at the proceeds received, net of direct issue costs.<br />
Consideration paid to repurchase the <strong>Company</strong>’s own equity instruments is deducted from equity. No gain or loss is recognised<br />
in profit or loss on the purchase, sale, issue or cancellation of the <strong>Company</strong>’s own equity instruments.<br />
(iv) Effective interest method<br />
The effective interest method is a method of calculating the amortised cost of a financial liability and of allocating interest<br />
expense over the relevant period. The effective interest rate is the rate that exactly discounts estimated future cash payments<br />
through the expected life of the financial liability, or, where appropriate, a shorter period to the net carrying amount on initial<br />
recognition.<br />
Interest expense is recognised on an effective interest basis for financial liabilities, other than those financial liabilities at<br />
FVTPL, of which the interest expense is included in other gains and losses as disclosed in note 7 of the Notes to the Financial<br />
Statements section.<br />
(b) Derecognition of financial liabilities<br />
Financial liabilities are derecognised when the obligation specified in the relevant contract is discharged, cancelled or expires.<br />
The difference between the carrying amount of the financial liability derecognised and the consideration paid and payable is<br />
recognised in profit or loss.<br />
Derivative financial instruments and hedging<br />
The Group enters into a variety of derivative financial instruments to manage its exposure to interest rate and foreign exchange<br />
rate risks, including foreign exchange forward contracts and interest rate swaps. Further details of derivative financial<br />
instruments are disclosed in note 23 of the Notes to the Financial Statements section.<br />
Derivatives are initially recognised at fair value at the date a derivative contract is entered into and are subsequently remeasured<br />
to their fair values at the end of the reporting period. The resulting gain or loss is recognised in profit or loss immediately unless<br />
the derivative is designated and effective as a hedging instrument, in which event the timing of the recognition in profit or loss<br />
depends on the nature of the hedge relationship.<br />
Embedded derivatives<br />
Derivatives embedded in non-derivative host contracts that are not financial assets within the scope of HKFRS 9 (e.g. financial<br />
liabilities) are treated as separate derivatives when their risks and characteristics are not closely related to those of the host<br />
contracts and the host contracts are not measured at FVTPL. Derivatives embedded in hybrid contracts that contain financial<br />
asset hosts within the scope of HKFRS 9 are not separated. The entire hybrid contracts are classified and subsequently<br />
measured as either amortised cost or FVTPL as appropriate.<br />
Prior to 1 January <strong>2011</strong>, derivatives embedded in non-derivative host contracts are treated as separate derivatives when their<br />
risks and characteristics are not closely related to those of the host contracts and the host contracts are not measured at fair<br />
value with changes in fair value recognised in profit or loss.<br />
108 <strong>Hysan</strong> <strong>Annual</strong> <strong>Report</strong> <strong>2011</strong>
7. FINANCIAL INSTRUMENTS continued<br />
Hedge accounting<br />
The Group designates certain derivatives as hedging instruments as either fair value hedges or cash flow hedges.<br />
At the inception of the hedging relationship, the Group documents the relationship between the hedging instrument and<br />
the hedged item, along with its risk management objectives and its strategy for undertaking various hedge transactions.<br />
Furthermore, at the inception of the hedge and on an ongoing basis, the Group documents whether the hedging instrument<br />
that is used in a hedging relationship is highly effective in offsetting changes in fair values or cash flows of the hedged item<br />
attributable to the hedged risk.<br />
Overview<br />
Note 23 of the Notes to the Financial Statements section sets out details of the fair values of the derivative instruments used<br />
for hedging purposes.<br />
(a) Fair value hedges<br />
Changes in the fair values of derivatives that are designated and qualify as fair value hedges are recorded in profit or loss<br />
immediately, together with any changes in the fair values of the hedged items that are attributable to the hedged risk. The<br />
adjustment to the carrying amount of the hedged item for which the effective interest is used is amortised to profit or loss when<br />
the hedged item ceases to be adjusted for changes in its fair value attributable to the risk being hedged. The adjustment is<br />
based on a recalculated effective interest rate at the date the amortisation begins.<br />
Hedge accounting is discontinued when the Group revokes the hedging relationship, when the hedging instrument expires or is<br />
sold, terminated, or exercised, or when it no longer qualifies for hedge accounting.<br />
(b) Cash flow hedges<br />
The effective portion of changes in the fair values of derivatives that are designated and qualify as cash flow hedges are<br />
recognised in other comprehensive income and accumulated in hedging reserve. The gain or loss relating to the ineffective<br />
portion is recognised immediately in profit or loss, and is included in other gains and losses as disclosed in note 7 of the Notes<br />
to the Financial Statements section.<br />
Amounts previously recognised in other comprehensive income and accumulated in hedging reserve are reclassified to profit or<br />
loss in the periods when the hedged item is recognised in profit or loss, in the same line of the consolidated income statement<br />
as the recognised hedged item.<br />
Hedge accounting is discontinued when the Group revokes the hedging relationship, when the hedging instrument expires or is<br />
sold, terminated, or exercised, or when it no longer qualifies for hedge accounting. Any cumulative gain or loss accumulated in<br />
hedging reserve at that time remains in equity and is recognised when the forecast transaction is ultimately recognised in profit<br />
or loss. When a forecast transaction is no longer expected to occur, the cumulative gain or loss accumulated in hedging reserve<br />
is recognised immediately in profit or loss.<br />
8. REVENUE RECOGNITION<br />
Revenue is measured at the fair value of the consideration received or receivable.<br />
Rental income is recognised on a straight-line basis over the term of the relevant lease. Turnover rent is recognised when<br />
earned.<br />
Management fee income and security service income are recognised when services are rendered.<br />
Dividends on investments in equity instruments are recognised in profit or loss when the shareholders’ right to receive<br />
payments has been established (provided that it is probable that the economic benefits will flow to the Group or the <strong>Company</strong><br />
and the amount of revenue can be measured reliably), unless the dividends clearly represent a recovery of part of the cost of<br />
the investment in equity instruments designated as at FVTOCI.<br />
Interest income from a financial asset is recognised when it is probable that the economic benefits will flow to the Group or the<br />
<strong>Company</strong> and the amount of revenue can be measured reliably. Interest income from a financial asset excluding financial assets<br />
at FVTPL is accrued on a time basis, by reference to the principal outstanding and at the effective interest rate applicable, which<br />
is the rate that exactly discounts the estimated future cash receipts through the expected life of the financial asset to that<br />
asset’s net carrying amount on initial recognition.<br />
Strategy in Action Corporate Governance Financial Statements and Valuation<br />
<strong>Hysan</strong> <strong>Annual</strong> <strong>Report</strong> <strong>2011</strong><br />
109
Significant Accounting Policies continued<br />
For the year ended 31 December <strong>2011</strong><br />
9. LEASES<br />
Leases are classified as finance leases whenever the terms of the lease transfer substantially all the risks and rewards of<br />
ownership to the lessee. All other leases are classified as operating leases.<br />
The Group as lessor<br />
Rental income from operating leases is recognised in profit or loss on a straight-line basis over the term of the relevant lease.<br />
Initial direct costs incurred in negotiating and arranging an operating lease are added to the carrying amount of the leased<br />
asset and recognised as an expense on a straight-line basis over the lease term.<br />
The <strong>Company</strong> as lessee<br />
Operating lease payments are recognised as an expense on a straight-line basis over the term of the relevant lease. In the<br />
event that lease incentives are received to enter into operating leases, such incentives are recognised as a liability. The<br />
aggregate benefit of incentives is recognised as a reduction of rental expense over the lease term on a straight-line basis.<br />
10. FOREIGN CURRENCIES<br />
In preparing the financial statements of each individual group entity, transactions in currencies other than the functional currency<br />
of that entity (foreign currencies) are recorded in its functional currency (i.e. the currency of the primary economic environment<br />
in which the entity operates) at the rates of exchanges prevailing on the dates of the transactions. At the end of the reporting<br />
period, monetary items denominated in foreign currencies are retranslated at the rates prevailing at that date. Non-monetary<br />
items that are measured in terms of historical cost in a foreign currency are not retranslated.<br />
Exchange differences arising on the settlement of monetary items, and on the retranslation of monetary items, are recognised<br />
in profit or loss in the period in which they arise, except for exchange differences arising on a monetary item that forms<br />
part of the Group’s net investment in a foreign operation, in which case, such exchange differences are recognised in other<br />
comprehensive income and accumulated in translation reserve and will be reclassified from translation reserve to profit or loss<br />
on disposal of the foreign operation.<br />
For the purposes of presenting the consolidated financial statements, the assets and liabilities of the Group’s foreign operations<br />
are translated into the presentation currency of the Group (i.e. Hong Kong dollars) at the rate of exchange prevailing at the<br />
end of the reporting period, and their income and expenses are translated at the average exchange rates for the year, unless<br />
exchange rates fluctuate significantly during the period, in which case, the exchange rates prevailing at the dates of transactions<br />
are used. Exchange differences arising, if any, are recognised in other comprehensive income and accumulated in translation<br />
reserve.<br />
11. BORROWING COSTS<br />
Borrowing costs directly attributable to the acquisition, construction or production of qualifying assets, which are assets that<br />
necessarily take a substantial period of time to get ready for their intended use or sale, are added to the cost of those assets<br />
until such time as the assets are substantially ready for their intended use or sale. Investment income earned on the temporary<br />
investment of specific borrowings pending their expenditure on qualifying assets is deducted from the borrowing costs eligible<br />
for capitalisation.<br />
All other borrowing costs are recognised in profit or loss in the period in which they are incurred.<br />
12. RETIREMENT BENEFIT COSTS<br />
Payments to the Mandatory Provident Fund Scheme are charged as an expense when employees have rendered service entitling<br />
them to the contributions.<br />
13. TAXATION<br />
Income tax expense represents the sum of the tax currently payable and deferred tax.<br />
Current tax<br />
The tax currently payable is based on taxable profit for the year. Taxable profit differs from profit as reported in the consolidated<br />
income statement because it excludes items of income or expense that are taxable or deductible in other years and it further<br />
excludes items that are never taxable or deductible. The Group’s or the <strong>Company</strong>’s liability for current tax is calculated using tax<br />
rates that have been enacted or substantively enacted by the end of the reporting period.<br />
110 <strong>Hysan</strong> <strong>Annual</strong> <strong>Report</strong> <strong>2011</strong>
13. TAXATION continued<br />
Deferred tax<br />
Deferred tax is recognised on temporary differences between the carrying amounts of assets and liabilities in the financial<br />
statements and the corresponding tax bases used in the computation of taxable profit. Deferred tax liabilities are generally<br />
recognised for all taxable temporary differences and deferred tax assets are generally recognised to the extent that it is<br />
probable that taxable profits will be available against which deductible temporary differences can be utilised. Such assets<br />
and liabilities are not recognised if the temporary difference arises from goodwill or from the initial recognition (other than in a<br />
business combination) of other assets and liabilities in a transaction that affects neither the taxable profit nor the accounting<br />
profit.<br />
Deferred tax liabilities are recognised for taxable temporary differences associated with investments in subsidiaries and<br />
associates, except where the Group or the <strong>Company</strong> is able to control the reversal of the temporary difference and it is probable<br />
that the temporary difference will not reverse in the foreseeable future. Deferred tax assets arising from deductible temporary<br />
differences associated with such investments and interests are only recognised to the extent that it is probable that there will<br />
be sufficient taxable profits against which to utilise the benefits of the temporary differences and they are expected to reverse<br />
in the foreseeable future.<br />
The carrying amount of deferred tax assets is reviewed at the end of the reporting period and reduced to the extent that it is no<br />
longer probable that sufficient taxable profits will be available to allow all or part of the asset to be recovered.<br />
Deferred tax assets and liabilities are measured at the tax rates that are expected to apply in the period when the liability is<br />
settled or the asset is realised, based on tax rate (and tax laws) that have been enacted or substantively enacted by the end of<br />
the reporting period.<br />
The measurement of deferred tax liabilities and assets reflects the tax consequences that would follow from the manner in<br />
which the Group or the <strong>Company</strong> expects, at the end of the reporting period, to recover or settle the carrying amount of its<br />
assets and liabilities. For the purposes of measuring deferred tax liabilities and deferred tax assets for investment properties<br />
that are measured using the fair value model in accordance with HKAS 40 “Investment Property”, such properties’ value are<br />
presumed to be recovered through sale. Such a presumption is rebutted when the investment property is depreciable and is<br />
held within a business model of the Group or the <strong>Company</strong> whose business objective is to consume substantially all of the<br />
economic benefits embodied in the investment property over time, rather than through sale. If the presumption is rebutted,<br />
deferred tax liabilities and deferred tax assets for such investment properties are measured in accordance with the above<br />
general principles set out in HKAS 12 (i.e based on the expected manner as to how the properties will be recovered).<br />
Deferred tax is recognised in profit or loss, except when it relates to items that are recognised in other comprehensive income<br />
or directly in equity, in which case the deferred tax is also recognised in other comprehensive income or directly in equity<br />
respectively.<br />
14. EQUITY-SETTLED SHARE-BASED PAYMENT TRANSACTIONS<br />
Share options granted to employees<br />
The fair value of services received determined by reference to the fair value of share options granted at the grant date is<br />
expensed on a straight-line basis over the vesting period, with a corresponding increase in share options reserve.<br />
At the end of the reporting period, the Group and the <strong>Company</strong> revise their estimates of the number of options that are expected<br />
to ultimately vest. The impact of the revision of the estimates during the vesting period, if any, is recognised in profit or loss,<br />
with a corresponding adjustment to share options reserve.<br />
At the time when the share options are exercised, the amount previously recognised in share options reserve will be transferred<br />
to share premium. When the share options are forfeited after the vesting date or are still not exercised at the expiry date, the<br />
amount previously recognised in share options reserve will be transferred to retained profits.<br />
Overview<br />
Strategy in Action Corporate Governance Financial Statements and Valuation<br />
<strong>Hysan</strong> <strong>Annual</strong> <strong>Report</strong> <strong>2011</strong><br />
111
Notes to the Financial Statements<br />
For the year ended 31 December <strong>2011</strong><br />
1. GENERAL<br />
The <strong>Company</strong> is a public listed company incorporated in Hong Kong and its shares are listed on The Stock Exchange of Hong<br />
Kong <strong>Limited</strong> (the “Stock Exchange”). The addresses of the registered office and principal place of business of the <strong>Company</strong><br />
are disclosed in the “Shareholder Information” section of the annual report.<br />
The principal activities of the <strong>Company</strong> and its subsidiaries (collectively referred to as the “Group”) are property investment,<br />
management and development.<br />
These financial statements are presented in Hong Kong dollars (“HKD”), which is the same as the functional currency of the<br />
<strong>Company</strong>.<br />
2. APPLICATION OF NEW AND REVISED HONG KONG FINANCIAL REPORTING STANDARDS<br />
(“HKFRSs”)<br />
In the current year, the Group and the <strong>Company</strong> have applied all of the new and revised Standards, Amendments to Standards<br />
and Interpretations (“new and revised HKFRSs”) issued by the Hong Kong Institute of Certified Public Accountants (“HKICPA”)<br />
that are relevant to its operations and effective for the financial year beginning on 1 January <strong>2011</strong>. In addition, the Group<br />
and the <strong>Company</strong> have applied Hong Kong Financial <strong>Report</strong>ing Standard (“HKFRS”) 9 “Financial Instruments” (as revised in<br />
December <strong>2011</strong>) in advance of its effective date of 1 January 2015 in the current year.<br />
Except as described below, the adoption of these new and revised HKFRSs had no other material effect on the financial<br />
statements of the Group or the <strong>Company</strong> for the current and/or prior accounting years.<br />
HKFRS 9 “Financial Instruments” (as revised in December <strong>2011</strong>)<br />
In the current year, the Group and the <strong>Company</strong> have applied HKFRS 9 in its entirety and the related consequential Amendments<br />
in advance of its effective date. The Group and the <strong>Company</strong> have chosen 1 January <strong>2011</strong> as its date of initial application<br />
(i.e. the date on which the Group and the <strong>Company</strong> have reassessed the classification of its financial assets and financial<br />
liabilities in accordance with requirements of HKFRS 9). The classification is based on the facts and circumstances as at 1<br />
January <strong>2011</strong>. In accordance with transition provisions set out in HKFRS 9, the Group and the <strong>Company</strong> have chosen not to<br />
restate comparative information, any difference between the carrying amount previously measured under Hong Kong Accounting<br />
Standard (“HKAS”) 39 “Financial Instruments: Recognition and Measurement” and the carrying amount subsequently measured<br />
under HKFRS 9 as at 1 January <strong>2011</strong> is recognised in the opening retained profits at the date of initial application. HKFRS 9<br />
does not apply to financial assets and financial liabilities that have already been derecognised at date of initial application.<br />
Other than the changes in classification of certain financial assets, the changes in accounting policies had no material financial<br />
impact on the amounts recognised on the statement of financial position of the Group or the <strong>Company</strong> as at 1 January <strong>2011</strong>.<br />
Accordingly, the statement of financial position of the Group or the <strong>Company</strong> as at 1 January 2010 is not presented.<br />
112 <strong>Hysan</strong> <strong>Annual</strong> <strong>Report</strong> <strong>2011</strong>
2. APPLICATION OF NEW AND REVISED HONG KONG FINANCIAL REPORTING STANDARDS<br />
(“HKFRSs”) continued<br />
HKFRS 9 “Financial Instruments” (as revised in December <strong>2011</strong>) continued<br />
Financial assets<br />
HKFRS 9 introduces new classification and measurement requirements for financial assets that are within the scope of HKAS<br />
39. Specifically, HKFRS 9 requires all financial assets to be classified and subsequently measured at either amortised cost or<br />
fair value on the basis of the Group’s or the <strong>Company</strong>’s business model for managing the financial assets and the contractual<br />
cash flow characteristics of the financial assets.<br />
Overview<br />
As required by HKFRS 9, debt instruments and hybrid contracts are subsequently measured at amortised cost only if (i) the<br />
asset is held within a business model whose objective is to hold assets in order to collect contractual cash flows and (ii) the<br />
contractual terms of the financial asset give rise on specified dates to cash flows that are solely payments of principal and<br />
interest on the principal amount outstanding (collectively referred to as the “amortised cost criteria”). All other financial assets<br />
are subsequently measured at fair value.<br />
However, the Group or the <strong>Company</strong> may choose at initial recognition to designate a debt instrument that meets the amortised<br />
cost criteria as at fair value through profit or loss (“FVTPL”) if doing so eliminates or significantly reduces an accounting<br />
mismatch. Debt instruments that are subsequently measured at amortised cost are subject to impairment. Investments in<br />
equity instruments are classified and measured as at FVTPL except when the equity investment is not held for trading and is<br />
designated by the Group as at fair value through other comprehensive income (“FVTOCI”). If the equity investment is designated<br />
as at FVTOCI, all gains and losses are recognised in other comprehensive income and are not subsequently reclassified to profit<br />
or loss except for dividend income, which is recognised in profit or loss in accordance with HKAS 18 “Revenue” unless the<br />
dividend income clearly represents a recovery of part of the cost of the investments.<br />
As at 1 January <strong>2011</strong>, the Directors of the <strong>Company</strong> have reviewed and reassessed the Group’s financial assets on that date.<br />
The initial application of HKFRS 9 has had impacts on the following financial assets of the Group:<br />
(i)<br />
the Group’s investments in listed equity securities (not held for trading) of HK$1,147 million that were previously classified<br />
as available-for-sale investments and measured at fair value at each reporting date under HKAS 39 have been designated<br />
as at FVTOCI; and<br />
(ii) the Group’s investments in unlisted equity securities (not held for trading) of HK$3 million that were previously classified<br />
as available-for-sale investments and measured at cost less impairment at each reporting date under HKAS 39 have been<br />
designated as at FVTOCI.<br />
Strategy in Action Corporate Governance Financial Statements and Valuation<br />
<strong>Hysan</strong> <strong>Annual</strong> <strong>Report</strong> <strong>2011</strong><br />
113
Notes to the Financial Statements continued<br />
For the year ended 31 December <strong>2011</strong><br />
2. APPLICATION OF NEW AND REVISED HONG KONG FINANCIAL REPORTING STANDARDS<br />
(“HKFRSs”) continued<br />
HKFRS 9 “Financial Instruments” (as revised in December <strong>2011</strong>) continued<br />
Financial assets continued<br />
The list below illustrates the classification and measurement of the financial assets under HKAS 39 and HKFRS 9 at the date<br />
of initial application.<br />
Original<br />
New<br />
Original measurement New measurement carrying carrying<br />
category under category under amount under amount under<br />
HKAS 39 HKFRS 9 HKAS 39 HKFRS 9<br />
HK$ million HK$ million<br />
Principal-protected Financial assets Financial assets 462 462<br />
investments (Note 20) designated as at FVTPL at FVTPL<br />
Term notes (Note 21) Held-to-maturity Financial assets 263 263<br />
investments/loans<br />
at amortised cost<br />
and receivables<br />
Investments in listed Available-for-sale Financial assets 1,147 1,147<br />
equity securities (Note 22) investments designated as<br />
at FVTOCI<br />
Investments in unlisted Available-for-sale Financial assets 3 3<br />
equity securities (Note 22) investments designated as<br />
at FVTOCI<br />
Investments in club Available-for-sale Financial assets 2 2<br />
debentures investments (Note 22) at FVTPL (Note 23)<br />
Other financial assets: Derivatives designated Derivatives designated 1 1<br />
Forward foreign exchange as hedging instruments as hedging instruments<br />
contracts under cash flow<br />
hedges (Note 23)<br />
Other financial assets: Derivatives designated Derivatives designated 2 2<br />
Cross currency swaps as hedging instruments as hedging instruments<br />
under cash flow<br />
hedges (Note 23)<br />
Other financial assets: Derivatives designated Derivatives designated 1 1<br />
Basis swaps under cash as hedging instruments as hedging instruments<br />
flow hedges (Note 23)<br />
Other financial assets: Derivatives designated Derivatives designated 50 50<br />
Interest rate swaps as hedging instruments as hedging instruments<br />
under fair value<br />
hedges (Note 23)<br />
Other financial assets: Financial assets at FVTPL Financial assets at FVTPL 38 38<br />
Cross currency swaps<br />
classified as held for<br />
trading (not under hedge<br />
accounting) (Note 23)<br />
Accounts receivable and Loans and receivables Financial assets 177 177<br />
other receivables (Note 24)<br />
at amortised cost<br />
Amount due from Loans and receivables Financial assets 139 139<br />
an associate (Note 26)<br />
at amortised cost<br />
Time deposits (Note 27) Loans and receivables Financial assets 1,930 1,930<br />
at amortised cost<br />
Cash and bank Loans and receivables Financial assets 63 63<br />
balances (Note 27)<br />
at amortised cost<br />
114 <strong>Hysan</strong> <strong>Annual</strong> <strong>Report</strong> <strong>2011</strong>
2. APPLICATION OF NEW AND REVISED HONG KONG FINANCIAL REPORTING STANDARDS<br />
(“HKFRSs”) continued<br />
HKFRS 9 “Financial Instruments” (as revised in December <strong>2011</strong>) continued<br />
Financial assets continued<br />
The application of HKFRS 9 affected the Group’s result in the current year as follows:<br />
Overview<br />
(i)<br />
The cumulative gain resulted upon disposal of investments in listed equity securities of HK$33 million that would have<br />
been reclassified from investments revaluation reserve to profit or loss under HKAS 39 is now recognised as a transfer<br />
from investments revaluation reserve to retained profits. Accordingly, both the investment income and profit reported for<br />
the year ended 31 December <strong>2011</strong> have been decreased by HK$33 million as a result of the change in accounting policy,<br />
resulting in a decrease on both the Group’s basic and diluted earnings per share by HK3.12 cents for the year ended 31<br />
December <strong>2011</strong>.<br />
(ii) The Group’s unlisted equity securities previously measured at cost less impairment under HKAS 39 are now measured<br />
at fair value under HKFRS 9 and have been designated as at FVTOCI. The carrying amounts of these investments<br />
approximated their fair values as at 1 January <strong>2011</strong>. During the year ended 31 December <strong>2011</strong>, net fair value losses<br />
of HK$2 million, which would have been recognised as impairment losses in profit or loss under HKAS 39, have been<br />
recognised as other comprehensive expense. Accordingly, both the investment income and profit reported for the year<br />
ended 31 December <strong>2011</strong> have been increased by HK$2 million as a result of the change in accounting policy, resulting<br />
in an increase on both the Group’s basic and diluted earnings per share by HK0.19 cents for the year ended 31 December<br />
<strong>2011</strong>.<br />
The fair value measurements of the Group’s unlisted equity securities are grouped into Level 3, which are derived from valuation<br />
techniques that include inputs for the assets that are not based on observable market data (unobservable inputs).<br />
Financial liabilities<br />
HKFRS 9 also contains requirements for the classification and measurement of financial liabilities. One major change in the<br />
classification and measurement of financial liabilities relates to the accounting for changes in fair value of a financial liability<br />
(designated as at FVTPL) attributable to changes in the credit risk of that liability.<br />
Strategy in Action Corporate Governance Financial Statements and Valuation<br />
<strong>Hysan</strong> <strong>Annual</strong> <strong>Report</strong> <strong>2011</strong><br />
115
Notes to the Financial Statements continued<br />
For the year ended 31 December <strong>2011</strong><br />
2. APPLICATION OF NEW AND REVISED HONG KONG FINANCIAL REPORTING STANDARDS<br />
(“HKFRSs”) continued<br />
HKFRS 9 “Financial Instruments” (as revised in December <strong>2011</strong>) continued<br />
Financial liabilities continued<br />
The list below illustrates the classification and measurement of the financial liabilities under HKAS 39 and HKFRS 9 at the date<br />
of initial application.<br />
Original<br />
New<br />
Original measurement New measurement carrying carrying<br />
category under category under amount under amount under<br />
HKAS 39 HKFRS 9 HKAS 39 HKFRS 9<br />
HK$ million HK$ million<br />
Accounts payable Financial liabilities Financial liabilities 433 433<br />
and accruals (Note 28) at amortised cost at amortised cost<br />
Amounts due to Financial liabilities Financial liabilities 327 327<br />
non-controlling at amortised cost at amortised cost<br />
interests (Note 29)<br />
Borrowings (Note 30) Financial liabilities Financial liabilities 4,587 4,587<br />
at amortised cost<br />
at amortised cost<br />
Other financial liabilities: Financial liabilities Financial liabilities 48 48<br />
Interest rate swaps at FVTPL at FVTPL<br />
under cash flow hedges<br />
(Note 23)<br />
Other financial liabilities: Financial liabilities Financial liabilities 4 4<br />
Net basis swaps at FVTPL at FVTPL<br />
classified as held for<br />
trading (not under hedge<br />
accounting) (Note 23)<br />
The Group and the <strong>Company</strong> have not early applied the following new and revised Standards, Amendments to Standards and<br />
Interpretations that have been issued but are not yet effective.<br />
HKAS 1 (Amendments) Presentation of Items of Other Comprehensive Income 1<br />
HKAS 19 (<strong>2011</strong>) Employee Benefits 2<br />
HKAS 27 (<strong>2011</strong>) Separate Financial Statements 2<br />
HKAS 28 (<strong>2011</strong>) Investments in Associates and Joint Ventures 2<br />
HKAS 32 (Amendments) Offsetting Financial Assets and Financial Liabilities 3<br />
HKFRS 7 (Amendments) Disclosure – Transfers of Financial Assets 4<br />
Disclosure – Offsetting Financial Assets and Financial Liabilities 2<br />
HKFRS 10 Consolidated Financial Statements 2<br />
HKFRS 11 Joint Arrangements 2<br />
HKFRS 12 Disclosure of Interests in Other Entities 2<br />
HKFRS 13 Fair Value Measurement 2<br />
HK(IFRIC) – Int 20 Stripping Costs in the Production Phase of a Surface Mine 2<br />
1<br />
Effective for annual periods beginning on or after 1 July 2012.<br />
2<br />
Effective for annual periods beginning on or after 1 January 2013.<br />
3<br />
Effective for annual periods beginning on or after 1 January 2014.<br />
4<br />
Effective for annual periods beginning on or after 1 July <strong>2011</strong>.<br />
116 <strong>Hysan</strong> <strong>Annual</strong> <strong>Report</strong> <strong>2011</strong>
2. APPLICATION OF NEW AND REVISED HONG KONG FINANCIAL REPORTING STANDARDS<br />
(“HKFRSs”) continued<br />
Amendments to HKAS 32 “Offsetting Financial Assets and Financial Liabilities” and<br />
Amendments to HKFRS 7 “Disclosures – Offsetting Financial Assets and Financial Liabilities”<br />
The amendments to HKAS 32 clarify existing application issues relating to the offsetting requirements. Specifically, the<br />
amendments clarify the meaning of “currently has a legally enforceable right of set-off” and “simultaneous realisation and<br />
settlement”.<br />
Overview<br />
The amendments to HKFRS 7 require entities to disclose information about rights of offset and related arrangements (such<br />
as collateral posting requirements) for financial instruments under an enforceable master netting agreement or similar<br />
arrangement.<br />
The amended offsetting disclosures are required for annual periods beginning on or after 1 January 2013 and interim periods<br />
within those annual periods. The disclosures should also be provided retrospectively for all comparative periods. However,<br />
the amendments to HKAS 32 are not effective until annual periods beginning on or after 1 January 2014, with retrospective<br />
application required.<br />
HKFRS 13 “Fair Value Measurement”<br />
HKFRS 13 establishes a single source of guidance for fair value measurements and disclosures about fair value measurements.<br />
The Standard defines fair value, establishes a framework for measuring fair value, and requires disclosures about fair value<br />
measurements. The scope of HKFRS 13 is broad; it applies to both financial instrument items and non-financial instrument<br />
items for which other HKFRSs require or permit fair value measurements and disclosures about fair value measurements,<br />
except in specified circumstances. In general, the disclosure requirements in HKFRS 13 are more extensive than those in the<br />
current standards. For example, quantitative and qualitative disclosures based on the three-level fair value hierarchy currently<br />
required for financial instruments only under HKFRS 7 “Financial Instruments: Disclosures” will be extended by HKFRS 13 to<br />
cover all assets and liabilities within its scope.<br />
HKFRS 13 is effective for annual periods beginning on or after 1 January 2013, with earlier application permitted.<br />
The Directors of the <strong>Company</strong> anticipate that the application of this new Standard may result in more extensive disclosures in<br />
the consolidated financial statements.<br />
Other than as described above, the Directors of the <strong>Company</strong> anticipate that the application of the other new and revised<br />
Standards, Amendments to Standards and Interpretations will have no material impact on the results and the financial position<br />
of the Group or the <strong>Company</strong>.<br />
Strategy in Action Corporate Governance Financial Statements and Valuation<br />
<strong>Hysan</strong> <strong>Annual</strong> <strong>Report</strong> <strong>2011</strong><br />
117
Notes to the Financial Statements continued<br />
For the year ended 31 December <strong>2011</strong><br />
3. KEY SOURCES OF ESTIMATION UNCERTAINTY<br />
In the application of the Group’s accounting policies, which are described in the “Significant Accounting Policies” section, the<br />
management of the <strong>Company</strong> is required to make estimates and assumptions about the carrying amounts of assets and<br />
liabilities that are not readily apparent from other sources. The estimates and associated assumptions are based on historical<br />
experience and other factors that are considered to be relevant. Actual results may differ from these estimates.<br />
The estimates and underlying assumptions are reviewed on an ongoing basis. Revisions to accounting estimates are recognised<br />
in the period in which the estimate is revised if the revision affects only that period or in the period of the revision and future<br />
periods if the revision affects both current and future periods.<br />
The following are the key assumptions concerning the future, and other key sources of estimation uncertainty at the end of the<br />
reporting period, that have a significant risk of causing a material adjustment to the carrying amounts of assets and liabilities<br />
within the next financial year.<br />
Fair value of investment properties<br />
At the end of the reporting period, the Group’s investment properties are stated at fair value of HK$49,969 million (2010:<br />
HK$40,833 million) based on the valuation performed by an independent qualified professional valuer. In determining the fair<br />
value, the valuers have applied a market value basis which involves, inter-alia, certain estimates, including comparable market<br />
transactions, appropriate capitalisation rates and reversionary income potential and redevelopment potential. In relying on the<br />
valuation, management has exercised their judgment and is satisfied that the method of valuation is reflective of the current<br />
market conditions.<br />
Fair value of financial instruments<br />
Financial instruments, such as interest rate swaps, cross currency swaps and foreign exchange derivatives, are carried in the<br />
consolidated statement of financial position at fair value, as disclosed in note 23. The management of the <strong>Company</strong> uses its<br />
judgment in selecting an appropriate valuation technique for financial instruments not quoted in an active market. Valuation<br />
techniques commonly used by market practitioners are applied. For derivative financial instruments, assumptions are made<br />
based on quoted market rates. Most of the financial instruments are valued using a discounted cash flow analysis based on<br />
assumptions supported, where possible, by observable market prices or rates. Details of the assumptions used and of the<br />
results of sensitivity analyses regarding these assumptions are provided in the “Financial Risk Management” section.<br />
4. TURNOVER<br />
Turnover represents gross rental income from investment properties and management fee income for the year.<br />
The Group’s principal activities are property investment, management and development, and its turnover and results are<br />
principally derived from investment properties located in Hong Kong.<br />
5. SEGMENT INFORMATION<br />
Based on the internal reports about components of the Group that are regularly reviewed by the chief operating decision maker<br />
(i.e. Chief Executive Officer of the Group) in order to allocate resources to segments and to assess their performance, the<br />
Group’s operating segments are as follows:<br />
Office segment – leasing of high quality office space and related facilities<br />
Retail segment – leasing of space and related facilities to a variety of retail and leisure operators<br />
Residential segment – leasing of luxury residential properties and related facilities<br />
118 <strong>Hysan</strong> <strong>Annual</strong> <strong>Report</strong> <strong>2011</strong>
5. SEGMENT INFORMATION continued<br />
Segment turnover and results<br />
The following is an analysis of the Group’s turnover and results by operating segment.<br />
Office Retail Residential Consolidated<br />
HK$ million HK$ million HK$ million HK$ million<br />
Overview<br />
For the year ended 31 December <strong>2011</strong><br />
Turnover<br />
Gross rental income from investment properties 701 721 283 1,705<br />
Management fee income 119 68 30 217<br />
Segment revenue 820 789 313 1,922<br />
Property expenses (102) (104) (56) (262)<br />
Segment profit 718 685 257 1,660<br />
Investment income 90<br />
Other gains and losses (34)<br />
Administrative expenses (173)<br />
Finance costs (122)<br />
Change in fair value of investment properties 7,532<br />
Share of results of associates 254<br />
Profit before taxation 9,207<br />
For the year ended 31 December 2010<br />
Turnover<br />
Gross rental income from investment properties 654 636 264 1,554<br />
Management fee income 116 64 30 210<br />
Segment revenue 770 700 294 1,764<br />
Property expenses (119) (81) (50) (250)<br />
Segment profit 651 619 244 1,514<br />
Investment income 49<br />
Other gains and losses (42)<br />
Administrative expenses (140)<br />
Finance costs (117)<br />
Change in fair value of investment properties 2,594<br />
Share of results of associates 394<br />
Profit before taxation 4,252<br />
All of the segment turnover reported above is from external customers.<br />
The accounting policies of the operating segments are the same as the Group’s accounting policies described in the “Significant<br />
Accounting Policies” section. Segment profit represents the profit earned by each segment without allocation of investment<br />
income, central administration costs and directors’ salaries, other gains and losses, finance costs, change in fair value of<br />
investment properties and share of results of associates. This is the measure reported to the Chief Executive Officer of the<br />
Group for the purpose of resource allocation and performance assessment.<br />
Strategy in Action Corporate Governance Financial Statements and Valuation<br />
<strong>Hysan</strong> <strong>Annual</strong> <strong>Report</strong> <strong>2011</strong><br />
119
Notes to the Financial Statements continued<br />
For the year ended 31 December <strong>2011</strong><br />
5. SEGMENT INFORMATION continued<br />
Segment assets<br />
The following is an analysis of the Group’s assets by operating segment.<br />
As at 31 December <strong>2011</strong><br />
Office Retail Residential Consolidated<br />
HK$ million HK$ million HK$ million HK$ million<br />
Segment assets 16,957 15,092 8,426 40,475<br />
Investment properties under redevelopment 9,500<br />
Investments in associates 3,423<br />
Other assets 5,970<br />
Consolidated assets 59,368<br />
As at 31 December 2010<br />
Segment assets 14,708 11,900 7,822 34,430<br />
Investment properties under redevelopment 6,408<br />
Investments in associates 3,014<br />
Other assets 4,702<br />
Consolidated assets 48,554<br />
Segment assets represented the fair value of investment properties and accounts receivable of each segment without allocation<br />
of property, plant and equipment, investments in associates, amount due from an associate, financial instruments, other<br />
receivables, time deposits, cash and bank balances. This is the measure reported to the Group’s management for the purpose<br />
of monitoring segment performances and allocating resources between segments. The investment properties are included in<br />
segment assets at their fair values whilst the change in fair value of investment properties is not included in segment profit. No<br />
segment liabilities analysis is presented as the Group’s management monitors and manages all the liabilities on a group basis.<br />
Other than the investments in associates, which operated in the People’s Republic of China (the “PRC”) and Singapore with<br />
carrying amounts of HK$3,420 million (2010: HK$3,011 million) and HK$3 million (2010: HK$3 million) respectively, all the<br />
Group’s assets are located in Hong Kong.<br />
Other segment information<br />
Office Retail Residential Consolidated<br />
HK$ million HK$ million HK$ million HK$ million<br />
For the year ended 31 December <strong>2011</strong><br />
Additions to non-current assets 37 444 21 502<br />
Additions to investment properties under redevelopment 1,118<br />
For the year ended 31 December 2010<br />
Additions to non-current assets 88 326 10 424<br />
Additions to investment properties under redevelopment 502<br />
1,620<br />
926<br />
120 <strong>Hysan</strong> <strong>Annual</strong> <strong>Report</strong> <strong>2011</strong>
6. INVESTMENT INCOME<br />
Investment income comprises:<br />
<strong>2011</strong> 2010<br />
HK$ million HK$ million<br />
Dividends from<br />
– listed investments 43 34<br />
– unlisted investments 11 –<br />
Interest income 36 15<br />
90 49<br />
Overview<br />
The following is an analysis of investment income:<br />
<strong>2011</strong> 2010<br />
HK$ million HK$ million<br />
Held-to-maturity investments – 1<br />
Available-for-sale equity investments – 34<br />
Loans and receivables (including term notes, time deposits and bank balances) – 14<br />
Dividends from equity investments designated as at FVTOCI 54 –<br />
Financial assets measured at amortised cost 40 –<br />
Reclassification of losses from hedging reserve on financial instruments designated<br />
as cash flow hedges (4) –<br />
90 49<br />
Fair value gains and losses and interest income on financial assets classified or designated as at FVTPL are disclosed in note 7.<br />
7. OTHER GAINS AND LOSSES<br />
Other gains and losses comprise:<br />
<strong>2011</strong> 2010<br />
HK$ million HK$ million<br />
Change in fair value of financial assets or financial liabilities classified as at FVTPL (33) –<br />
Change in fair value of financial assets designated as at FVTPL – (1)<br />
Change in fair value of financial assets or financial liabilities classified as held<br />
for trading – (18)<br />
Gains on hedging instruments under fair value hedge 16 19<br />
Losses on adjustment for hedged items under fair value hedge (17) (19)<br />
Amortisation of fair value gain adjusted to hedged items under fair value hedge<br />
in prior years – (23)<br />
(34) (42)<br />
Strategy in Action Corporate Governance Financial Statements and Valuation<br />
<strong>Hysan</strong> <strong>Annual</strong> <strong>Report</strong> <strong>2011</strong><br />
121
Notes to the Financial Statements continued<br />
For the year ended 31 December <strong>2011</strong><br />
8. FINANCE COSTS<br />
<strong>2011</strong> 2010<br />
HK$ million HK$ million<br />
Finance costs comprise:<br />
Interest on bank loans and overdrafts wholly repayable within five years 24 13<br />
Interest on floating rate notes wholly repayable within five years 2 3<br />
Interest on fixed rate notes wholly repayable within five years 116 116<br />
Interest on fixed rate notes not wholly repayable within five years 44 18<br />
Imputed interest on zero coupon notes not wholly repayable within five years 14 13<br />
Total interest expenses 200 163<br />
Other finance costs 7 10<br />
Less: Amounts capitalised (Note) (44) (12)<br />
163 161<br />
Net interest receipts on interest rate swaps and cross currency swaps (68) (69)<br />
Reclassification of losses from hedging reserve on<br />
financial instruments designated as cash flow hedges 25 18<br />
Premium on redemption of fixed rate notes – 6<br />
Medium Term Note Programme expenses 2 1<br />
122 117<br />
Note:<br />
Interest expenses have been capitalised to investment properties under redevelopment at an average interest rate of 2.88% (2010: 1.60%) per<br />
annum.<br />
9. TAXATION<br />
<strong>2011</strong> 2010<br />
HK$ million HK$ million<br />
Current tax<br />
Hong Kong profits tax<br />
– current year 207 172<br />
– underprovision (overprovision) in prior years 1 (6)<br />
208 166<br />
Deferred tax (note 31) 9 35<br />
Hong Kong Profits Tax is calculated at 16.5% of the estimated assessable profit for both years.<br />
217 201<br />
122 <strong>Hysan</strong> <strong>Annual</strong> <strong>Report</strong> <strong>2011</strong>
9. TAXATION continued<br />
The taxation for the year can be reconciled to the profit before taxation per the consolidated income statement as follows:<br />
<strong>2011</strong> 2010<br />
HK$ million HK$ million<br />
Overview<br />
Profit before taxation 9,207 4,252<br />
Tax at Hong Kong profits tax rate of 16.5% 1,519 701<br />
Tax effect of share of results of associates (42) (65)<br />
Tax effect of expenses not deductible for tax purposes 46 18<br />
Tax effect of income not taxable for tax purposes (1,298) (447)<br />
Tax effect of estimated tax losses not recognised 3 1<br />
Tax effect of previously unrecognised unused tax losses<br />
now recognised as deferred tax assets (10) –<br />
Reversal of previously recognised taxable temporary differences (2) –<br />
Utilisation of estimated tax losses previously not recognised – (1)<br />
Underprovision (overprovision) in prior years 1 (6)<br />
Taxation for the year 217 201<br />
In addition to the amount charged to the consolidated income statement, deferred tax relating to the revaluation of the Group’s<br />
properties held for own use has been charged directly to properties valuation reserve (see note 31).<br />
10. PROFIT FOR THE YEAR<br />
Profit for the year has been arrived at after charging (crediting):<br />
<strong>2011</strong> 2010<br />
HK$ million HK$ million<br />
Auditor’s remuneration 2 2<br />
Depreciation of property, plant and equipment 8 8<br />
Gross rental income from investment properties<br />
including contingent rentals of HK$89 million<br />
(2010: HK$54 million) (1,705) (1,554)<br />
Less:<br />
– Direct operating expenses arising from properties that generated rental income 233 247<br />
– Direct operating expenses arising from properties that did not generate rental income 29 3<br />
(1,443) (1,304)<br />
Staff costs, comprising:<br />
– Directors’ emoluments (note 12) 21 14<br />
– Share-based payments 4 4<br />
– Other staff costs 168 147<br />
193 165<br />
Share of income tax of an associate (included in share of results of associates) 92 153<br />
Strategy in Action Corporate Governance Financial Statements and Valuation<br />
<strong>Hysan</strong> <strong>Annual</strong> <strong>Report</strong> <strong>2011</strong><br />
123
Notes to the Financial Statements continued<br />
For the year ended 31 December <strong>2011</strong><br />
11. OTHER COMPREHENSIVE INCOME<br />
<strong>2011</strong> 2010<br />
HK$ million HK$ million<br />
Other comprehensive income comprises:<br />
Losses arising from equity investments designated as at FVTOCI (121) –<br />
Gain arising from available-for-sale investments – 150<br />
Cash flow hedges:<br />
– Losses arising during the year (25) (40)<br />
– Reclassification adjustments for losses included in profit or loss 29 18<br />
4 (22)<br />
Gain on revaluation of properties held for own use 85 34<br />
Share of translation reserve of an associate 155 103<br />
Other comprehensive income (before tax) 123 265<br />
Income tax relating to components of other comprehensive income (see below) (14) (5)<br />
Other comprehensive income for the year (net of tax) 109 260<br />
Tax effect relating to other comprehensive income:<br />
<strong>2011</strong> 2010<br />
Before-tax Tax Net-of-tax Before-tax Tax Net-of-tax<br />
amount expense amount amount expense amount<br />
HK$ million HK$ million HK$ million HK$ million HK$ million HK$ million<br />
Fair value losses arising from equity investments (121) – (121) – – –<br />
Fair value gains arising from<br />
available-for-sale investments – – – 150 – 150<br />
Net gains (losses) on cash flow hedges 4 – 4 (22) – (22)<br />
Gain on revaluation of properties held for own use 85 (14) 71 34 (5) 29<br />
Share of translation reserve of an associate 155 – 155 103 – 103<br />
123 (14) 109 265 (5) 260<br />
12. DIRECTORS’ EMOLUMENTS<br />
<strong>2011</strong> 2010<br />
HK$ million HK$ million<br />
Directors’ fees 2 2<br />
Other emoluments<br />
Basic salaries, housing and other allowances 8 8<br />
Bonus 7 2<br />
Share-based payments (note 40) 3 2<br />
Retirement benefits scheme contributions 1 –<br />
21 14<br />
124 <strong>Hysan</strong> <strong>Annual</strong> <strong>Report</strong> <strong>2011</strong>
12. DIRECTORS’ EMOLUMENTS continued<br />
The emoluments paid or payable to each of the Directors of the <strong>Company</strong> for the two years ended 31 December <strong>2011</strong>,<br />
calculated with reference to their employment as Directors of the <strong>Company</strong>, are set out below:<br />
Basic salaries,<br />
Retirement<br />
housing<br />
benefits<br />
Directors’ and other Share-based scheme<br />
fees allowances Bonus payments contributions Total<br />
HK$’000 HK$’000 HK$’000 HK$’000 HK$’000 HK$’000<br />
(Note a) (Note b) (Note b) (Note c)<br />
Overview<br />
For the year ended 31 December <strong>2011</strong><br />
Executive Directors<br />
Gerry Lui Fai YIM (Note d) 57 5,255 4,424 1,880 12 11,628<br />
Wendy Wen Yee YUNG 38 2,977 2,520 1,351 274 7,160<br />
Non-executive Directors<br />
Irene Yun Lien LEE (Note e) 318 – – – – 318<br />
Hans Michael JEBSEN 159 – – – – 159<br />
Siu Chuen LAU (Note f) 140 – – – – 140<br />
Anthony Hsien Pin LEE 206 – – – – 206<br />
Chien LEE (Note d) 201 – – – – 201<br />
Michael Tze Hau LEE 191 – – – – 191<br />
Dr. Deanna Ruth Tak Yung RUDGARD (Note g) 35 – – – – 35<br />
Independent non-executive Directors<br />
Sir David AKERS-JONES (Notes d & h) 177 – – – – 177<br />
Nicholas Charles ALLEN (Note d) 265 – – – – 265<br />
Philip Yan Hok FAN (Note d) 281 – – – – 281<br />
Joseph Chung Yin POON 159 – – – – 159<br />
For the year ended 31 December 2010<br />
2,227 8,232 6,944 3,231 286 20,920<br />
Executive Directors<br />
Gerry Lui Fai YIM (Note i) 108 4,854 – 1,089 13 6,064<br />
Wendy Wen Yee YUNG 100 2,805 1,476 1,293 259 5,933<br />
Non-executive Directors<br />
Hans Michael JEBSEN 107 – – – – 107<br />
Anthony Hsien Pin LEE (Note j) 130 – – – – 130<br />
Chien LEE (Note k) 119 – – – – 119<br />
Michael Tze Hau LEE (Note l) 105 – – – – 105<br />
Dr. Deanna Ruth Tak Yung RUDGARD 100 – – – – 100<br />
Independent non-executive Directors<br />
Sir David AKERS-JONES (Note m) 652 – – – – 652<br />
Fa-kuang HU (Note n) 43 – – – – 43<br />
Dr. Geoffrey Meou-tsen YEH (Note o) 61 – – – – 61<br />
Nicholas Charles ALLEN 160 – – – – 160<br />
Philip Yan Hok FAN (Note p) 132 – – – – 132<br />
Joseph Chung Yin POON (Note q) 97 – – – – 97<br />
1,914 7,659 1,476 2,382 272 13,703<br />
Strategy in Action Corporate Governance Financial Statements and Valuation<br />
<strong>Hysan</strong> <strong>Annual</strong> <strong>Report</strong> <strong>2011</strong><br />
125
Notes to the Financial Statements continued<br />
For the year ended 31 December <strong>2011</strong><br />
12. DIRECTORS’ EMOLUMENTS continued<br />
Notes:<br />
(a)<br />
Directors fees scales for Board and Board Committees were revised and approved by shareholders at the annual general meeting held on<br />
9 May <strong>2011</strong> and took effect on 1 June <strong>2011</strong>. Details are set out in Directors’ Remuneration and Interests <strong>Report</strong>.<br />
Director’s fees are paid on annual basis. For Directors not having served the full year on a position, the fees will be paid on pro rata basis.<br />
Breakdown of Directors’ fees of each of the Directors of the <strong>Company</strong> for the year ended 31 December <strong>2011</strong> is set out below:<br />
Audit Remuneration Strategy Nomination <strong>2011</strong> 2010<br />
Board Committee Committee Committee Committee Total Total<br />
HK$’000 HK$’000 HK$’000 HK$’000 HK$’000 HK$’000 HK$’000<br />
Executive Directors<br />
Gerry Lui Fai YIM (Note d) 38 – – 11 8 57 108<br />
Wendy Wen Yee YUNG 38 – – – – 38 100<br />
Non-executive Directors<br />
Irene Yun Lien LEE (Note e) 276 – – 23 19 318 –<br />
Hans Michael JEBSEN 159 – – – – 159 107<br />
Siu Chuen LAU (Note f) 124 – – 16 – 140 –<br />
Anthony Hsien Pin LEE 159 47 – – – 206 130<br />
Chien LEE (Note d) 159 – – 22 20 201 119<br />
Michael Tze Hau LEE 159 – 32 – – 191 105<br />
Dr. Deanna Ruth Tak Yung RUDGARD (Note g) 35 – – – – 35 100<br />
Independent non-executive Directors<br />
Sir David AKERS-JONES (Notes d & h) 141 – 11 14 11 177 652<br />
Nicholas Charles ALLEN (Note d) 159 84 – 22 – 265 160<br />
Philip Yan Hok FAN (Note d) 159 48 32 22 20 281 132<br />
Joseph Chung Yin POON 159 – – – – 159 97<br />
Fa-kuang HU (Note n) – – – – – – 43<br />
Dr. Geoffrey Meou-tsen YEH (Note o) – – – – – – 61<br />
1,765 179 75 130 78 2,227 1,914<br />
(b) Year <strong>2011</strong>:<br />
The Remuneration Committee reviewed the <strong>2011</strong> fixed base salary of the <strong>Company</strong>’s executive Directors and determined their 2010<br />
performance-based bonus in March <strong>2011</strong>. The stated bonus figures show the 2010 performance-based bonus approved by the Committee<br />
and paid to Executive Directors, namely HK$4,424,000 for Gerry Lui Fai YIM and HK$2,520,000 for Wendy Wen Yee YUNG respectively.<br />
Year 2010:<br />
The Remuneration Committee reviewed the 2010 fixed base salary of the <strong>Company</strong>’s executive Directors and determined their 2009<br />
performance-based bonus in March 2010. In reviewing their 2010 compensation structure, changes in their roles and responsibilities<br />
were also taken into consideration. Their base salary was raised as from April 2010. The stated bonus figures show the 2009<br />
performance-based bonus approved by the Committee and paid to Executive Director, namely HK$1,475,512 for Wendy Wen Yee YUNG.<br />
(c) Share-based payments are the fair values of share options granted to Directors, which are determined at the date of grant and expensed<br />
over the vesting period, regardless of whether the Directors exercise the share options or not during the year.<br />
(d) The Strategy Committee was formed on 16 November 2010. Sir David AKERS-JONES was appointed Chairman of the Committee.<br />
Gerry Lui Fai YIM, Chien LEE, Nicholas Charles ALLEN and Philip Yan Hok FAN were appointed members of the Committee on the same<br />
date.<br />
(e) Irene Yun Lien LEE was appointed Non-executive Director and member of Strategy Committee on 9 March <strong>2011</strong>. She was appointed<br />
Non-executive Chairman of the Board, Chairman of the Nomination Committee and the Strategy Committee respectively as from the<br />
conclusion of <strong>2011</strong> <strong>Annual</strong> General Meeting held on 9 May <strong>2011</strong>.<br />
(f) Siu Chuen LAU (as alternate to Deanna Ruth Tak Yung RUDGARD) was appointed member of Strategy Committee on 9 March <strong>2011</strong>. He<br />
was also appointed Non-executive Director as from the conclusion of <strong>2011</strong> <strong>Annual</strong> General Meeting held on 9 May <strong>2011</strong>.<br />
(g) Dr. Deanna Ruth Tak Yung RUDGARD stepped down as Non-executive Director as from the conclusion of <strong>2011</strong> <strong>Annual</strong> General Meeting<br />
held on 9 May <strong>2011</strong>.<br />
(h) Sir David AKERS-JONES stepped down as Independent non-executive Chairman and Chairman of the Remuneration Committee, the<br />
Nomination Committee and the Strategy Committee respectively as from the conclusion of <strong>2011</strong> <strong>Annual</strong> General Meeting held on 9 May<br />
<strong>2011</strong>.<br />
126 <strong>Hysan</strong> <strong>Annual</strong> <strong>Report</strong> <strong>2011</strong>
12. DIRECTORS’ EMOLUMENTS continued<br />
(i) Gerry Lui Fai YIM was appointed Chief Executive Officer on 10 March 2010 and member of the Nomination Committee on 10 August<br />
2010.<br />
(j) Anthony Hsien Pin LEE was appointed member of the Audit Committee as from the conclusion of 2010 <strong>Annual</strong> General Meeting held on<br />
11 May 2010.<br />
(k) Chien LEE was appointed member of the Nomination Committee on 10 August 2010.<br />
(l) Michael Tze Hau LEE was appointed Non-executive Director and member of the Remuneration Committee on 11 January 2010 and<br />
10 August 2010 respectively.<br />
(m) Sir David AKERS-JONES was appointed Independent non-executive Chairman on 11 January 2010. A special fee of HK$300,000 was<br />
granted to Sir David AKERS-JONES in recognition of his special roles during the period from 18 October 2009 to the appointment of the<br />
Chief Executive Officer on 10 March 2010. The annual fee for the Independent non-executive Chairman was revised from HK$140,000 to<br />
HK$400,000 effective from 1 June 2010.<br />
(n) Fa-kuang HU stepped down as Independent non-executive Director and member of the Remuneration Committee as from the conclusion of<br />
2010 <strong>Annual</strong> General Meeting held on 11 May 2010.<br />
(o) Dr. Geoffrey Meou-tsen YEH stepped down as Independent non-executive Director and member of the Audit Committee, Remuneration<br />
Committee and Nomination Committee as from the conclusion of 2010 <strong>Annual</strong> General Meeting held on 11 May 2010.<br />
(p) Philip Yan Hok FAN was appointed Independent non-executive Director on 11 January 2010 and member of the Audit Committee as from<br />
11 May 2010. He was also appointed member of the Remuneration Committee and the Nomination Committee on 10 August 2010.<br />
(q) Joseph Chung Yin POON was appointed Independent non-executive Director on 11 January 2010.<br />
13. EMPLOYEES’ EMOLUMENTS<br />
Of the five individuals with the highest emoluments in the Group, two (2010: two) were Directors of the <strong>Company</strong>, details of<br />
whose emoluments are included in note 12 above. The emoluments of all of the five individuals with the highest emoluments<br />
for the year ended 31 December <strong>2011</strong> and 2010 were as follows:<br />
<strong>2011</strong> 2010<br />
HK$ million HK$ million<br />
Basic salaries, housing and other allowances 16 14<br />
Bonus 9 4<br />
Share-based payments (Note) 5 4<br />
30 22<br />
Note:<br />
Share-based payments are the fair values of share options granted to Directors and eligible employees, which are determined at the date of<br />
grant and expensed over the vesting period, regardless of whether the Directors or eligible employees exercise the share options or not during<br />
the year.<br />
Their emoluments are within the following bands:<br />
Number of individuals<br />
<strong>2011</strong> 2010<br />
HK$2,500,001 to HK$3,000,000 – 1<br />
HK$3,000,001 to HK$3,500,000 1 1<br />
HK$3,500,001 to HK$4,000,000 1 –<br />
HK$4,000,001 to HK$4,500,000 – 1<br />
HK$4,500,001 to HK$5,000,000 1 –<br />
HK$5,500,001 to HK$6,000,000 – 1<br />
HK$6,000,001 to HK$6,500,000 – 1<br />
HK$7,000,001 to HK$7,500,000 1 –<br />
HK$11,500,001 to HK$12,000,000 1 –<br />
The five individuals with the highest emoluments in the Group were also the senior management of the Group.<br />
5 5<br />
Overview<br />
Strategy in Action Corporate Governance Financial Statements and Valuation<br />
<strong>Hysan</strong> <strong>Annual</strong> <strong>Report</strong> <strong>2011</strong><br />
127
Notes to the Financial Statements continued<br />
For the year ended 31 December <strong>2011</strong><br />
14. DIVIDENDS<br />
(a) Dividends recognised as distribution during the year:<br />
<strong>2011</strong> 2010<br />
HK$ million HK$ million<br />
<strong>2011</strong> interim dividend paid – HK15 cents per share 159 –<br />
2010 interim dividend paid – HK14 cents per share – 147<br />
2010 final dividend paid – HK60 cents per share 632 –<br />
2009 final dividend paid – HK54 cents per share – 567<br />
791 714<br />
Scrip dividend alternatives were offered to the shareholders in respect of the above dividends. These alternatives were accepted<br />
by the shareholders as follows:<br />
<strong>2011</strong> 2010<br />
HK$ million HK$ million<br />
<strong>2011</strong> interim dividend (2010 interim dividend):<br />
– Cash payment 142 112<br />
– Share alternative 17 35<br />
2010 final dividend (2009 final dividend):<br />
– Cash payment 464 538<br />
– Share alternative 168 29<br />
(b) Dividends proposed after the end of the reporting period:<br />
791 714<br />
<strong>2011</strong> 2010<br />
HK$ million HK$ million<br />
Final dividend proposed – HK64 cents per share (2010: HK60 cents per share) 678 632<br />
The <strong>2011</strong> final dividend of HK64 cents per share (2010: HK60 cents per share) has been proposed by the Directors on<br />
8 March 2012 and is subject to approval by the shareholders at the forthcoming annual general meeting. Such dividend is not<br />
recognised as a liability as at 31 December <strong>2011</strong>.<br />
The proposed <strong>2011</strong> final dividend will be payable in cash with a scrip dividend alternative.<br />
128 <strong>Hysan</strong> <strong>Annual</strong> <strong>Report</strong> <strong>2011</strong>
15. EARNINGS PER SHARE<br />
(a) Basic and diluted earnings per share<br />
The calculation of the basic and diluted earnings per share attributable to the owners of the <strong>Company</strong> is based on the following<br />
data:<br />
Overview<br />
Earnings<br />
<strong>2011</strong> 2010<br />
HK$ million HK$ million<br />
Earnings for the purposes of basic and diluted earnings per share:<br />
Profit for the year attributable to owners of the <strong>Company</strong> 8,545 3,844<br />
Number of shares<br />
<strong>2011</strong> 2010<br />
Weighted average number of ordinary shares<br />
for the purpose of basic earnings per share 1,057,109,763 1,051,785,240<br />
Effect of dilutive potential ordinary shares:<br />
Share options issued by the <strong>Company</strong> 817,621 900,002<br />
Weighted average number of ordinary shares<br />
for the purpose of diluted earnings per share 1,057,927,384 1,052,685,242<br />
For <strong>2011</strong>, the computation of diluted earnings per share does not assume the exercise of certain of the <strong>Company</strong>’s outstanding<br />
share options as the exercise prices of those options are higher than the average market price for shares.<br />
(b) Adjusted basic earnings per share<br />
For the purpose of assessing the performance of the Group’s principal activities (i.e. leasing of investment properties), the<br />
management is of the view that the profit for the year attributable to the owners of the <strong>Company</strong> should be adjusted in the<br />
calculation of basic earnings per share as follows:<br />
<strong>2011</strong> 2010<br />
Basic<br />
Basic<br />
earnings<br />
earnings<br />
per<br />
per<br />
Profit share Profit share<br />
HK$ million HK cents HK$ million HK cents<br />
Profit for the year attributable to owners of the <strong>Company</strong> 8,545 808.34 3,844 365.47<br />
Change in fair value of investment properties (7,532) (712.51) (2,594) (246.63)<br />
Effect of non-controlling interests’ shares 355 33.58 125 11.89<br />
Share of change in fair value of investment properties<br />
(net of deferred taxation) of an associate (58) (5.49) (227) (21.58)<br />
Underlying Profit 1,310 123.92 1,148 109.15<br />
Recurring Underlying Profit 1,310 123.92 1,148 109.15<br />
Notes:<br />
(1) Recurring Underlying Profit is arrived at by excluding from Underlying Profit items that are non-recurring in nature (such as gains or losses<br />
on disposal of long-term assets; impairment or its reversal; and tax provisions for prior years). As there were no such adjustments in both<br />
years, the Recurring Underlying Profit is the same as the Underlying Profit.<br />
(2) The denominators used are the same as those detailed above for basic earnings per share.<br />
Strategy in Action Corporate Governance Financial Statements and Valuation<br />
<strong>Hysan</strong> <strong>Annual</strong> <strong>Report</strong> <strong>2011</strong><br />
129
Notes to the Financial Statements continued<br />
For the year ended 31 December <strong>2011</strong><br />
16. INVESTMENT PROPERTIES<br />
The Group<br />
<strong>2011</strong> 2010<br />
HK$ million HK$ million<br />
Fair value<br />
At 1 January 40,833 37,363<br />
Additions 1,601 926<br />
Acquisition of a subsidiary (note 34) 19 –<br />
Disposal – (50)<br />
Transfer to property, plant and equipment (16) –<br />
Change in fair value recognised in profit or loss 7,532 2,594<br />
At 31 December 49,969 40,833<br />
The carrying amount of investment properties shown above comprises:<br />
The Group<br />
<strong>2011</strong> 2010<br />
HK$ million HK$ million<br />
Land in Hong Kong:<br />
– Medium-term lease 7,680 7,130<br />
– Long lease 42,289 33,703<br />
49,969 40,833<br />
The fair value of the Group’s investment properties at 31 December <strong>2011</strong> and 2010 have been arrived at on the basis of a<br />
valuation carried out on that date by Knight Frank Petty <strong>Limited</strong>, an independent qualified professional valuer not connected<br />
with the Group. The Group’s investment properties have been valued individually, on market value basis, which conforms<br />
to Hong Kong Institute of Surveyors Valuation Standards on Properties. The valuation was mainly arrived at by reference to<br />
comparable market transactions for similar properties and on the basis of capitalisation of net income with due allowance for<br />
the reversionary income and redevelopment potential. For the investment properties under redevelopment, residual method of<br />
valuation was adopted. The valuation was mainly arrived at by reference to actual sales or rental information publicly available<br />
to determine the value of the proposed development as if it were completed as at the date of valuation.<br />
All of the Group’s property interests held under operating leases to earn rentals or for capital appreciation purposes are<br />
measured using the fair value model and are classified and accounted for as investment properties.<br />
During the year ended 31 December <strong>2011</strong>, certain investment properties with a fair value of HK$16 million became property,<br />
plant and equipment because their uses have changed as evidenced by commencement of owner-occupation.<br />
130 <strong>Hysan</strong> <strong>Annual</strong> <strong>Report</strong> <strong>2011</strong>
17. PROPERTY, PLANT AND EQUIPMENT<br />
Leasehold land Furniture,<br />
and buildings fixtures and Motor<br />
in Hong Kong equipment Computers vehicles Total<br />
HK$ million HK$ million HK$ million HK$ million HK$ million<br />
Overview<br />
The Group<br />
Cost or valuation<br />
At 1 January 2010 381 59 27 1 468<br />
Additions – 3 4 – 7<br />
Surplus on revaluation 32 – – – 32<br />
At 31 December 2010 413 62 31 1 507<br />
Additions – 4 4 – 8<br />
Transfer from investment properties 16 – – – 16<br />
Surplus on revaluation 83 – – – 83<br />
At 31 December <strong>2011</strong> 512 66 35 1 614<br />
Comprising:<br />
At cost – 66 35 1 102<br />
At valuation <strong>2011</strong> 512 – – – 512<br />
512 66 35 1 614<br />
Accumulated depreciation<br />
At 1 January 2010 – 51 21 – 72<br />
Provided for the year 2 3 2 1 8<br />
Eliminated on revaluation (2) – – – (2)<br />
At 31 December 2010 – 54 23 1 78<br />
Provided for the year 2 3 3 – 8<br />
Eliminated on revaluation (2) – – – (2)<br />
At 31 December <strong>2011</strong> – 57 26 1 84<br />
Carrying amounts<br />
At 31 December <strong>2011</strong> 512 9 9 – 530<br />
At 31 December 2010 413 8 8 – 429<br />
Strategy in Action Corporate Governance Financial Statements and Valuation<br />
<strong>Hysan</strong> <strong>Annual</strong> <strong>Report</strong> <strong>2011</strong><br />
131
Notes to the Financial Statements continued<br />
For the year ended 31 December <strong>2011</strong><br />
17. Property, Plant and Equipment continued<br />
Furniture,<br />
fixtures and<br />
Motor<br />
equipment Computers vehicles Total<br />
HK$ million HK$ million HK$ million HK$ million<br />
The <strong>Company</strong><br />
Cost<br />
At 1 January 2010 23 25 1 49<br />
Additions 1 3 – 4<br />
At 31 December 2010 24 28 1 53<br />
Additions 1 3 – 4<br />
At 31 December <strong>2011</strong> 25 31 1 57<br />
Accumulated depreciation<br />
At 1 January 2010 21 20 – 41<br />
Provided for the year 1 1 1 3<br />
At 31 December 2010 22 21 1 44<br />
Provided for the year 1 2 – 3<br />
At 31 December <strong>2011</strong> 23 23 1 47<br />
Carrying amounts<br />
At 31 December <strong>2011</strong> 2 8 – 10<br />
At 31 December 2010 2 7 – 9<br />
The above items of property, plant and equipment are depreciated on a straight-line basis at the following rates per annum:<br />
Leasehold land and buildings<br />
Over the term of the lease or 40 years<br />
Furniture, fixtures and equipment 20%<br />
Computers 20%<br />
Motor vehicles 25%<br />
The Group’s leasehold land and buildings were revalued at 31 December <strong>2011</strong> and 2010 by Knight Frank Petty <strong>Limited</strong>, an<br />
independent qualified professional valuer, on market value basis, by reference to comparable market transactions for similar<br />
properties and on the basis of capitalisation of net income with due allowance for the reversionary income. The gain of HK$85<br />
million (2010: HK$34 million) arising on revaluation have been recognised in other comprehensive income and accumulated in<br />
properties revaluation reserve.<br />
Had the Group’s land and buildings been measured on a historical cost basis, their carrying amounts would have been HK$182<br />
million (2010: HK$168 million) at the end of the reporting period.<br />
Furniture, fixtures and equipment of the Group include assets carried at cost of HK$25 million (2010: HK$24 million) and<br />
accumulated depreciation of HK$21 million (2010: HK$20 million) in respect of assets held for leasing out under operating<br />
leases. Depreciation charges in respect of those assets for the year amounted to HK$1 million (2010: HK$1 million).<br />
There is no property, plant and equipment of the <strong>Company</strong> held for renting out under operating leases for the year or at the end<br />
of the reporting period.<br />
132 <strong>Hysan</strong> <strong>Annual</strong> <strong>Report</strong> <strong>2011</strong>
18. Investments in Subsidiaries<br />
Investments in subsidiaries comprise:<br />
The <strong>Company</strong><br />
<strong>2011</strong> 2010<br />
HK$ million HK$ million<br />
Unlisted shares, at cost – –<br />
Deemed capital contribution in subsidiaries 1,904 –<br />
1,904 –<br />
Overview<br />
The table below lists the principal subsidiaries of the Group at 31 December <strong>2011</strong> and 2010:<br />
Proportion of<br />
nominal value of<br />
Place of<br />
issued share capital<br />
incorporation/ Issued held by the <strong>Company</strong><br />
Name of subsidiary operation share capital directly indirectly Principal activities<br />
Admore Investments <strong>Limited</strong> Hong Kong HK$2 100% – Investment holding<br />
Golden Capital Investment <strong>Limited</strong> Hong Kong HK$2 100% – Investment holding<br />
HD Treasury <strong>Limited</strong> Hong Kong HK$2 100% – Treasury operation<br />
<strong>Hysan</strong> (MTN) <strong>Limited</strong> British Virgin Islands/ US$1 100% – Treasury operation<br />
Hong Kong<br />
<strong>Hysan</strong> China Holdings <strong>Limited</strong> British Virgin Islands HK$1 100% – Investment holding<br />
<strong>Hysan</strong> Corporate Services <strong>Limited</strong> Hong Kong HK$2 100% – Provision of corporate<br />
services<br />
<strong>Hysan</strong> Leasing <strong>Company</strong> <strong>Limited</strong> Hong Kong HK$2 100% – Leasing administration<br />
<strong>Hysan</strong> Property Management <strong>Limited</strong> Hong Kong HK$2 100% – Property management<br />
<strong>Hysan</strong> Treasury <strong>Limited</strong> Hong Kong HK$2 100% – Treasury operation<br />
Kwong Hup Holding <strong>Limited</strong> British Virgin Islands HK$1 100% – Investment holding<br />
Kwong Wan Realty <strong>Limited</strong> Hong Kong HK$1,000 100% – Property investment<br />
Minsal <strong>Limited</strong> Hong Kong HK$2 100% – Property investment<br />
Mondsee <strong>Limited</strong> Hong Kong HK$2 100% – Property investment<br />
Stangard <strong>Limited</strong> Hong Kong HK$300,000 100% – Provision of security<br />
services<br />
Teamfine Enterprises <strong>Limited</strong> Hong Kong HK$2 100% – Investment holding<br />
Bamboo Grove Recreational Hong Kong HK$2 – 100% Resident club<br />
Services <strong>Limited</strong><br />
management<br />
Earn Extra Investments <strong>Limited</strong> Hong Kong HK$1 – 100% Property investment<br />
Gearup Investments <strong>Limited</strong> Hong Kong HK$1 – 100% Property development<br />
HD Investment <strong>Limited</strong> British Virgin Islands HK$1 – 100% Investment holding<br />
Kochi Investments <strong>Limited</strong> British Virgin Islands HK$1 – 100% Capital market<br />
investment<br />
Lee Theatre Realty <strong>Limited</strong> Hong Kong HK$10 – 100% Property investment<br />
Leighton Property <strong>Company</strong> <strong>Limited</strong> Hong Kong HK$2 – 100% Property investment<br />
Main Rise <strong>Development</strong> <strong>Limited</strong> Hong Kong HK$2 – 100% Investment holding<br />
OHA Property <strong>Company</strong> <strong>Limited</strong> Hong Kong HK$2 – 100% Property investment<br />
Perfect Win Properties <strong>Limited</strong> Hong Kong HK$2 – 100% Property investment<br />
Silver Nicety <strong>Company</strong> <strong>Limited</strong> Hong Kong HK$20 – 100% Property investment<br />
Barrowgate <strong>Limited</strong> Hong Kong HK$10,000 – 65.36% Property investment<br />
The Directors are of the opinion that a complete list of all subsidiaries and their particulars will be of excessive length and<br />
therefore the above table contains only those subsidiaries which materially contribute to the net income of the Group or hold a<br />
material portion of the assets or liabilities or otherwise are operating subsidiaries of the Group. Other than floating rate notes,<br />
fixed rate notes and zero coupon notes issued by <strong>Hysan</strong> (MTN) <strong>Limited</strong> as disclosed in note 30, none of the subsidiaries had<br />
issued any debt securities at the end of the reporting period.<br />
Strategy in Action Corporate Governance Financial Statements and Valuation<br />
<strong>Hysan</strong> <strong>Annual</strong> <strong>Report</strong> <strong>2011</strong><br />
133
Notes to the Financial Statements continued<br />
For the year ended 31 December <strong>2011</strong><br />
19. Investments in Associates<br />
The Group<br />
<strong>2011</strong> 2010<br />
HK$ million HK$ million<br />
Cost of unlisted investments 3 3<br />
Share of post-acquisition profits and<br />
other comprehensive income,<br />
net of dividends received 3,417 3,008<br />
3,420 3,011<br />
Loan to an associate 118 119<br />
Less: Loss allocated in excess of cost of investments (115) (116)<br />
3 3<br />
3,423 3,014<br />
Loan to an associate of HK$118 million (2010: HK$119 million) is unsecured and interest-free. In the opinion of the Directors,<br />
the loan is considered as part of the Group’s net investment in the associate and, accordingly, the loan is included in the<br />
amount of investments in associates.<br />
Details of the Group’s associates at 31 December <strong>2011</strong> and 2010 are as follows:<br />
Class of Effective<br />
Place of share held/ interest<br />
Form of registration registered held by<br />
Name of associate business structure and operation capital the Group Principal activities<br />
Country Link Private limited Hong Kong Ordinary share 26.3%* Investment holding<br />
Enterprises <strong>Limited</strong><br />
company<br />
Shanghai Kong Hui Sino-Foreign equity The PRC US$165,000,000 # 24.7%* Property development<br />
Property <strong>Development</strong> joint venture and leasing<br />
Co., Ltd<br />
Shanghai Grand Sino-Foreign equity The PRC US$140,000 # 23.7%* Property management<br />
Gateway Plaza<br />
joint venture<br />
Property Management<br />
Co., Ltd<br />
Wingrove Investment Private company Singapore Ordinary share 25.0%* Property development<br />
Pte Ltd limited by shares and investment<br />
(inactive in both<br />
<strong>2011</strong> and 2010)<br />
* Indirectly held<br />
#<br />
Registered capital<br />
134 <strong>Hysan</strong> <strong>Annual</strong> <strong>Report</strong> <strong>2011</strong>
19. Investments in Associates continued<br />
The summarised financial information in respect of the Group’s associates based on the unaudited management accounts for<br />
the year ended 31 December <strong>2011</strong> and 2010 is as follows:<br />
<strong>2011</strong> 2010<br />
HK$ million HK$ million<br />
Overview<br />
Total assets 18,055 16,690<br />
Total liabilities (4,677) (4,920)<br />
Net assets 13,378 11,770<br />
Group’s share of net assets of associates 3,305 2,895<br />
Turnover 1,317 1,184<br />
Profit for the year 964 1,498<br />
Group’s share of results of associates for the year 254 394<br />
20. Principal-Protected Investments<br />
The carrying amounts of principal-protected investments based on the maturity dates of respective contracts are analysed as<br />
follows:<br />
The Group<br />
<strong>2011</strong> 2010<br />
HK$ million HK$ million<br />
Within 1 year 265 84<br />
More than 1 year but not exceeding 5 years 365 378<br />
630 462<br />
The Group entered into certain contracts of structured investments with certain financial institutions. The structured<br />
investments are principal-protected at the maturity dates and contain embedded derivatives which are not closely related to the<br />
host contracts. The interest rates of such investments vary in relation to the relative movements of the underlying variables,<br />
such as foreign exchange rates and 3-month Hong Kong Interbank Offered Rate (“HIBOR”). Prior to 1 January <strong>2011</strong>, the entire<br />
combined contracts have been designated as financial assets at FVTPL on initial recognition.<br />
Upon the application of HKFRS 9 on 1 January <strong>2011</strong>, the Group’s principal-protected investments that were previously<br />
designated as financial assets at FVTPL have been classified as financial assets at FVTPL. The investments previously<br />
designated as at FVTPL under HKAS 39, continue to be measured at FVTPL because they do not meet the amortised cost<br />
criteria under HKFRS 9.<br />
The notional amount and the maturity period of the principal-protected investments are as follows:<br />
The Group<br />
<strong>2011</strong> 2010<br />
Notional Fair Notional Fair<br />
amount value amount value<br />
HK$ million HK$ million HK$ million HK$ million<br />
Within 1 year 262 265 81 84<br />
More than 1 year but not exceeding 5 years 371 365 382 378<br />
633 630 463 462<br />
Strategy in Action Corporate Governance Financial Statements and Valuation<br />
<strong>Hysan</strong> <strong>Annual</strong> <strong>Report</strong> <strong>2011</strong><br />
135
Notes to the Financial Statements continued<br />
For the year ended 31 December <strong>2011</strong><br />
21. Term Notes<br />
The Group<br />
<strong>2011</strong> 2010<br />
HK$ million HK$ million<br />
Term notes, at amortised cost, comprise:<br />
– Debt securities listed in Hong Kong 19 –<br />
– Debt securities listed in overseas 120 216<br />
– Unlisted debt securities 291 47<br />
Total 430 263<br />
Analysed for reporting purposes as:<br />
Current assets 171 95<br />
Non-current assets 259 168<br />
430 263<br />
Upon the application of HKFRS 9 on 1 January <strong>2011</strong>, the Group’s debt securities listed in overseas and unlisted debt securities<br />
that were previously classified as held-to-maturity investments and loans and receivables respectively have been classified as<br />
financial assets measured at amortised cost. The term notes previously measured at amortised cost under HKAS 39, which<br />
also meet amortised cost criteria under HKFRS 9, continue to be measured at amortised cost.<br />
As at 31 December <strong>2011</strong>, the effective yield of the debt securities ranged from 1.05% to 3.13% (2010: 1.73% to 3%) per<br />
annum, payable quarterly or semi-annually, and the securities will mature from January 2012 to June 2014 (2010: from<br />
November 2012 to July 2013). None of these assets are past due or impaired at the end of the reporting period.<br />
136 <strong>Hysan</strong> <strong>Annual</strong> <strong>Report</strong> <strong>2011</strong>
22. Equity Investments/Available-for-sale Investments<br />
The Group<br />
Equity investments/available-for-sale<br />
investments comprise:<br />
The <strong>Company</strong><br />
<strong>2011</strong> 2010 <strong>2011</strong> 2010<br />
HK$ million HK$ million HK$ million HK$ million<br />
Overview<br />
Listed investments:<br />
– Equity securities listed in Hong Kong, at fair value 988 1,147 – –<br />
Unlisted investments:<br />
– Overseas equity securities, at fair value 1 – – –<br />
– Overseas equity securities, at cost – 58 – –<br />
Less: Impairment loss recognised – (55) – –<br />
1 3 – –<br />
– Club debentures, at fair value – 2 – 2<br />
989 1,152 – 2<br />
The overseas equity securities represent the Group’s investments in unlisted equity securities issued by private entities<br />
incorporated in Singapore. These private entities are engaged in property investment and development activities in Singapore.<br />
Prior to 1 January <strong>2011</strong>, they are measured at cost less any identified impairment loss under HKAS 39 because the range<br />
of reasonable fair value estimates is so significant that the management is of the opinion that their fair values cannot be<br />
measured reliably.<br />
These investments in equity securities are not held for trading. Upon the application of HKFRS 9 on 1 January <strong>2011</strong>, the<br />
Group’s investments in listed and unlisted equity securities and the Group’s and the <strong>Company</strong>’s unlisted club debentures that<br />
were previously classified as available-for-sale investments have been classified as equity investments designated as at FVTOCI<br />
and financial assets measured at FVTPL (see note 23(d)(ii)) respectively. The Group has chosen to designate these investments<br />
in equity instruments as at FVTOCI as the management believes that this provides a more meaningful presentation for these<br />
investments, than reflecting changes in fair value in profit or loss.<br />
Strategy in Action Corporate Governance Financial Statements and Valuation<br />
<strong>Hysan</strong> <strong>Annual</strong> <strong>Report</strong> <strong>2011</strong><br />
137
Notes to the Financial Statements continued<br />
For the year ended 31 December <strong>2011</strong><br />
23. Other Financial Assets/Liabilities<br />
The Group<br />
Current<br />
Non-current<br />
<strong>2011</strong> 2010 <strong>2011</strong> 2010<br />
HK$ million HK$ million HK$ million HK$ million<br />
Other financial assets<br />
Derivatives under hedge accounting:<br />
Cash flow hedges<br />
– Forward foreign exchange contracts 1 1 – –<br />
– Cross currency swaps – – – 2<br />
– Basis swaps – 1 – –<br />
Fair value hedges<br />
– Interest rate swaps – – 66 50<br />
1 2 66 52<br />
Financial assets measured at FVTPL:<br />
Other derivatives classified as held for<br />
trading (not under hedge accounting):<br />
– Cross currency swaps – – – 38<br />
Zero coupon convertible note 70 – – –<br />
Club debentures – – 2 –<br />
70 – 2 38<br />
Total 71 2 68 90<br />
Other financial liabilities<br />
Derivatives under hedge accounting:<br />
Cash flow hedges<br />
– Forward foreign exchange contracts 2 – – –<br />
– Cross currency swaps – – 10 –<br />
– Interest rate swaps 5 – 40 48<br />
7 – 50 48<br />
Financial liabilities measured at FVTPL:<br />
Other derivatives classified as held for<br />
trading (not under hedge accounting):<br />
– Net basis swaps 2 – – 4<br />
– Asset swap 10 – – –<br />
12 – – 4<br />
Total 19 – 50 52<br />
138 <strong>Hysan</strong> <strong>Annual</strong> <strong>Report</strong> <strong>2011</strong>
23. Other Financial Assets/Liabilities continued<br />
(a) Cash flow hedges<br />
(i) Foreign currency risk<br />
During the year, the Group used forward foreign exchange contracts and cross currency swaps to manage its foreign currency<br />
exposure. The principal terms of the forward foreign exchange contracts and cross currency swaps have been negotiated to<br />
match the major terms of the respective designated hedged items and the management considers that the hedges are highly<br />
effective.<br />
Overview<br />
The table below is prepared based on the maturity dates of respective contracts. The major terms of these outstanding forward<br />
foreign exchange contracts and cross currency swaps at the end of the reporting period are as follows:<br />
Forward foreign<br />
exchange contracts<br />
The Group<br />
<strong>2011</strong> 2010<br />
Average<br />
Average<br />
exchange Foreign Fair exchange Foreign Fair<br />
rate* currency Notional amount value rate* currency Notional amount value<br />
HK$ HK$ HK$ HK$<br />
million million million million million million<br />
Buy US dollars (“USD”)<br />
(Note a)<br />
Within 1 year 7.6059 USD 2 15 1 7.6169 USD 4 30 1<br />
More than 1 year but<br />
not exceeding 5 years – USD – – – 7.6059 USD 2 15 –<br />
7.6059 USD 2 15 1 7.6134 USD 6 45 1<br />
Sell USD (Note b)<br />
Within 1 year 7.7865 USD 18 140 – 7.7373 USD 16 125 –<br />
More than 1 year but<br />
not exceeding 5 years 7.7309 USD 10 77 – – USD – – –<br />
7.7667 USD 28 217 – 7.7373 USD 16 125 –<br />
Sell Renminbi (“RMB”)<br />
(Note c)<br />
Within 1 year 1.2065 RMB 167 202 (2) – RMB – – –<br />
Cross currency swaps<br />
Hedging interest and<br />
principal of Australian<br />
dollars (“AUD”)<br />
bank loan (Note d)<br />
More than 1 year but<br />
not exceeding 5 years 8.1497 AUD 37 300 (10) – AUD – – –<br />
Hedging interest and<br />
principal of USD<br />
bank loans (Note e)<br />
More than 1 year but<br />
not exceeding 5 years 7.8000 USD 26 200 – 7.7753 USD 51 399 2<br />
Total 934 (11) 569 3<br />
* Average exchange rate represented the average exchange rate of HKD versus respective currencies weighted by the notional amounts of<br />
the contracts or the swaps.<br />
Strategy in Action Corporate Governance Financial Statements and Valuation<br />
<strong>Hysan</strong> <strong>Annual</strong> <strong>Report</strong> <strong>2011</strong><br />
139
Notes to the Financial Statements continued<br />
For the year ended 31 December <strong>2011</strong><br />
23. Other Financial Assets/Liabilities continued<br />
(a) Cash flow hedges continued<br />
(i) Foreign currency risk continued<br />
Notes:<br />
(a) The Group used HK$15 million (2010: HK$45 million) forward foreign exchange contract to hedge the foreign exchange rate risk in relation<br />
to the semi-annual coupon payment of US$57 million (2010: US$57 million) out of the US$174 million (2010: US$174 million) fixed rate<br />
notes.<br />
(b) The Group used HK$217 million (2010: HK$125 million) forward foreign exchange contracts to hedge the foreign exchange rate risk of<br />
part of the principal amount of term notes and principal-protected investments denominated in USD at their respective maturity dates.<br />
(c) The Group used HK$202 million (2010: nil) forward foreign exchange contracts to hedge the foreign exchange rate risk of the principal and<br />
interest amount of a time deposit denominated in RMB at its maturity date.<br />
(d) The Group used HK$300 million (2010: nil) cross currency swap to convert AUD interest and principal of AUD37 million (2010: nil) bank<br />
loan into HKD.<br />
(e) The Group used HK$200 million (2010: HK$399 million) cross currency swap to convert USD interest and principal of US$26 million (2010:<br />
US$51 million) bank loan into HKD.<br />
As at 31 December <strong>2011</strong>, cumulative fair value gains of HK$5 million (2010: HK$3 million) from the forward foreign exchange<br />
contracts and cross currency swaps have been recognised in other comprehensive income and accumulated in hedging reserve,<br />
and are expected to be released to the consolidated income statements at various dates when the hedged items impact the<br />
profit or loss.<br />
During the year, net losses of HK$3 million (2010: gains of HK$3 million) on forward foreign exchange contracts and cross<br />
currency swaps were reclassified from hedging reserve to profit or loss as finance costs and losses of HK$4 million (2010: nil)<br />
on forward foreign exchange contracts were reclassified from hedging reserve to profit or loss as investment income.<br />
The fair values of forward foreign exchange contracts and cross currency swaps are measured using quoted forward exchange<br />
rates and yield curves from quoted interest rates matching maturities of the contracts and swaps.<br />
(ii) Interest rate risk<br />
During the year, the Group used interest rate swaps and basis swaps to hedge its interest rate risk exposure. The terms of the<br />
swaps have been negotiated to match the major terms of the respective hedged underlying items so that the management<br />
considers that the interest rate swaps and basis swaps are highly effective hedging instruments.<br />
140 <strong>Hysan</strong> <strong>Annual</strong> <strong>Report</strong> <strong>2011</strong>
23. Other Financial Assets/Liabilities continued<br />
(a) Cash flow hedges continued<br />
(ii) Interest rate risk continued<br />
The table below is prepared based on the maturity dates of respective contracts. The major terms of these outstanding interest<br />
rate swaps and basis swaps at the end of the reporting period are as follows:<br />
Overview<br />
The Group<br />
<strong>2011</strong> 2010<br />
Average<br />
Average<br />
interest Fair interest Fair<br />
rate* Notional amount value rate* Notional amount value<br />
US$ million HK$ million HK$ million US$ million HK$ million HK$ million<br />
Interest rate swaps<br />
Hedging interest of<br />
HKD bank loans<br />
(Note a)<br />
Within 1 year 0.32% n/a 200 – – – – –<br />
More than 1 year but<br />
not exceeding 5 years 3.32% n/a 525 (28) 3.32% n/a 525 (26)<br />
2.49% n/a 725 (28) 3.32% n/a 525 (26)<br />
Hedging floating-interest<br />
–rate payments<br />
of financial<br />
instruments (Note b)<br />
Within 1 year 3.80% n/a 200 (5) – – – –<br />
More than 1 year but<br />
not exceeding 5 years 2.99% n/a 200 (12) 3.39% n/a 400 (22)<br />
Basis swaps<br />
3.39% n/a 400 (17) 3.39% n/a 400 (22)<br />
Hedging interest of<br />
HKD bank loans<br />
(Note c)<br />
Within 1 year 0.08% n/a 325 – 0.11% n/a 325 –<br />
Hedging interest of<br />
USD bank loans<br />
(Note d)<br />
Within 1 year 0.07% 26 200 – 0.14% 51 399 1<br />
Total 1,650 (45) 1,649 (47)<br />
* For interest rate swaps, the average interest rate represented the average fixed interest rate paid by the Group against receipts of 3-month<br />
HIBOR or 6-month HIBOR weighted by the notional amounts of the swaps. For basis swaps, the average interest rate represented the<br />
average spread (weighted by the notional amounts of the swaps) that was added to 1-month HIBOR or 1-month London-Interbank Offered<br />
Rate (“LIBOR”) received by the Group against 3-month HIBOR or 3-month LIBOR paid by the Group.<br />
Notes:<br />
(a) The Group used HK$725 million (2010: HK$525 million) interest rate swaps to manage its exposure to interest rate changes of the<br />
monthly or quarterly interest payments of HKD bank loans. HK$200 million of the swaps will be effective in 2012 for hedging forecast<br />
transactions of borrowings at that time.<br />
(b) The Group used HK$400 million (2010: HK$400 million) interest rate swaps to hedge the interest rate risk in relation to the quarterly<br />
floating-interest-rate payments of certain financial instruments.<br />
(c) The Group used HK$325 million (2010: HK$325 million) basis swaps to combine with interest rate swaps referred to note (a) to hedge<br />
the interest rate changes of the monthly or quarterly interest payments of HK$325 million (2010: HK$325 million) bank loans.<br />
(d) The Group used HK$200 million (2010: HK$399 million) basis swaps to combine with cross currency swaps referred to note (e) of “foreign<br />
currency risk” to hedge the interest rate changes of the monthly or quarterly interest payments of US$26 million (2010: US$51 million)<br />
bank loan.<br />
Strategy in Action Corporate Governance Financial Statements and Valuation<br />
<strong>Hysan</strong> <strong>Annual</strong> <strong>Report</strong> <strong>2011</strong><br />
141
Notes to the Financial Statements continued<br />
For the year ended 31 December <strong>2011</strong><br />
23. Other Financial Assets/Liabilities continued<br />
(a) Cash flow hedges continued<br />
(ii) Interest rate risk continued<br />
As at 31 December <strong>2011</strong>, net cumulative fair value losses of HK$45 million (2010: HK$47 million) from the interest rate swaps<br />
and basis swaps under cash flow hedges have been recognised in other comprehensive income and accumulated in hedging<br />
reserve, and are expected to be released to the consolidated income statement at various dates during the lives of the swaps<br />
when the hedged interest expenses are recognised and impact the profit or loss.<br />
During the year, losses of HK$22 million (2010: HK$21 million) on interest rate swaps and basis swaps were reclassified from<br />
hedging reserve to profit or loss as finance costs.<br />
The fair values of interest rate swaps and basis swaps are measured at the present value of future cash flows estimated and<br />
discounted based on the applicable yield curves derived from quoted interest rates.<br />
(b) Fair value hedges<br />
The Group used interest rate swaps to minimise its exposure to fair value changes of its HKD fixed rate notes and zero<br />
coupon notes by swapping the notes from fixed rates to floating rates. The major terms of the interest rate swaps match the<br />
corresponding notes and the management considers that the swaps are highly effective hedging instruments.<br />
The table below is prepared based on the maturity dates of respective contracts. The major terms of these outstanding interest<br />
rate swaps at the end of the reporting period are as follows:<br />
The Group<br />
<strong>2011</strong> 2010<br />
Average<br />
Average<br />
interest Fair interest Fair<br />
rate* Notional amount value rate* Notional amount value<br />
US$ million HK$ million HK$ million US$ million HK$ million HK$ million<br />
Interest rate swaps (Note)<br />
Within 1 year – n/a – – 1.42% n/a 65 –<br />
More than 1 year but<br />
not exceeding 5 years 4.18% n/a 300 35 4.18% n/a 300 30<br />
More than 5 years 4.50% n/a 278 31 4.50% n/a 264 20<br />
4.33% n/a 578 66 4.03% n/a 629 50<br />
* The average interest rate represented the average fixed interest rate (weighted by the notional amounts of the interest rate<br />
swaps) received by the Group against payments of 3-month HIBOR.<br />
Note:<br />
The Group designated HK$300 million (2010: HK$365 million) fixed-to-floating interest rate swaps to hedge interest rate risk related to part of<br />
the coupon payments of the HK$300 million (2010: HK$365 million) fixed rate notes. The Group also designated a fixed-to-floating interest rate<br />
swap with nominal amount of HK$278 million (2010: HK$264 million) as at 31 December <strong>2011</strong> to hedge the zero coupon notes with nominal<br />
amount of HK$430 million by converting a fixed rate of 5.19% per annum to HIBOR plus 0.69% per annum.<br />
As a result of the hedge accounting, the carrying amount of the fixed rate notes as at 31 December <strong>2011</strong> was adjusted by<br />
losses of HK$35 million (2010: HK$30 million) while the carrying amount of the zero coupon notes as at 31 December <strong>2011</strong><br />
was adjusted by losses of HK$32 million (2010: HK$20 million). The changes in fair values of the notes for the hedged risk<br />
were included in profit or loss at the same time that the changes in fair value of the swaps were included in profit or loss.<br />
The fair values of interest rate swaps are measured at the present value of future cash flows estimated and discounted based<br />
on the applicable yield curves derived from quoted interest rates.<br />
142 <strong>Hysan</strong> <strong>Annual</strong> <strong>Report</strong> <strong>2011</strong>
23. Other Financial Assets/Liabilities continued<br />
(c) Other derivatives classified as held for trading (not under hedge accounting)<br />
At the end of the reporting period, the Group had certain derivatives classified as held for trading and not under hedge<br />
accounting. The table below is prepared based on the maturity dates of respective contracts. The major terms of these<br />
derivatives are as follows:<br />
Overview<br />
The Group<br />
<strong>2011</strong> 2010<br />
Average<br />
Average<br />
interest/<br />
interest/<br />
exchange Fair exchange Fair<br />
rate* Notional amount value rate* Notional amount value<br />
US$ million HK$ million HK$ million US$ million HK$ million HK$ million<br />
Net basis swaps (Note a)<br />
Within 1 year 7.8000 57 445 (2) – – – –<br />
More than 1 year but<br />
not exceeding 5 years – – – – 7.8000 57 445 (4)<br />
7.8000 57 445 (2) 7.8000 57 445 (4)<br />
Cross currency<br />
swaps (Note b)<br />
Within 1 year 7.7998 117 913 – – – – –<br />
More than 1 year but<br />
not exceeding 5 years – – – – 7.7998 117 913 38<br />
7.7998 117 913 – 7.7998 117 913 38<br />
Interest rate<br />
swap (Note c)<br />
Within 1 year – – – – 1.49% n/a 65 –<br />
Forward foreign<br />
exchange contracts<br />
(Note d)<br />
More than 1 year but<br />
not exceeding 5 years 7.8400 27 212 – – – – –<br />
Asset swap (Note e)<br />
Within 1 year 2.00% n/a 60 (10) n/a n/a – –<br />
* For net basis swaps, cross currency swaps and forward foreign exchange contracts, the average exchange rate represented the average<br />
HKD:USD exchange rate weighted by their notional amounts. For interest rate swap, the average interest rate represented the fixed<br />
interest rate received by the Group against payment of 3-month HIBOR. For asset swap, the interest rate represented the spread added to<br />
3-month HIBOR received by the Group.<br />
Notes:<br />
(a) The Group used US$57 million (2010: US$57 million) net basis swaps to minimise the foreign currency exposure in relation to the<br />
principal payment and part of the coupon payment of the US$57 million (2010: US$57 million) of the US$174 million (2010: US$174<br />
million) fixed rate notes at maturity.<br />
(b) The Group used US$117 million (2010: US$117 million) cross currency swaps to manage the interest rate and foreign exchange risks of<br />
US$117 million (2010: US$117 million) of the US$174 million (2010: US$174 million) fixed rate notes.<br />
(c) The Group had no interest rate swap classified as held for trading as at 31 December <strong>2011</strong>. As at 31 December 2010, the Group used<br />
HK$65 million fixed-to-floating interest rate swap to manage the interest rate risk in relation to the quarterly interest payment of part of the<br />
Group’s borrowings.<br />
(d) The Group used HK$212 million (2010: nil) forward foreign exchange contracts to manage the foreign exchange rate risk in relation to<br />
investment amount of US$27 million (2010: nil) of term notes and principal-protected investments. The contracts will effectively manage<br />
the foreign exchange rate risk if HKD:USD is above 7.74 at the respectively maturity dates. If HKD:USD is at or below 7.74, the contracts<br />
will be knocked out and the Group will have no obligation on the settlement of the contracts.<br />
(e) The Group used a HK$60 million (2010: nil) asset swap to convert the return of a zero coupon convertible note of investment amount of<br />
HK$60 million (2010: nil) into a floating rate note with interest income of 3-month HIBOR plus 2%. The mark-to-market losses were offset<br />
by corresponding mark-to-market gains of the note.<br />
Strategy in Action Corporate Governance Financial Statements and Valuation<br />
<strong>Hysan</strong> <strong>Annual</strong> <strong>Report</strong> <strong>2011</strong><br />
143
Notes to the Financial Statements continued<br />
For the year ended 31 December <strong>2011</strong><br />
23. Other Financial Assets/Liabilities continued<br />
(d) Financial assets measured at FVTPL<br />
(i) Zero coupon convertible note<br />
During the year, the Group purchased a zero coupon convertible note of HK$60 million with an embedded equity option of a<br />
listed company in Hong Kong. The note will mature in February 2012. As disclosed in note (c) of other derivatives classified as<br />
held for trading, an asset swap was used to manage the fair value exposure to the notes at the end of the reporting period. The<br />
entire combined contracts have been classified as financial assets measured at FVTPL on initial recognition.<br />
(ii) Club debentures<br />
Upon the application of HKFRS 9 on 1 January <strong>2011</strong>, the Group’s and the <strong>Company</strong>’s investments in unlisted club debentures<br />
that were previously classified as available-for-sale investments (see note 22) have been classified as financial assets<br />
measured at FVTPL.<br />
The Group’s and the <strong>Company</strong>’s club debentures previously measured at fair value at each reporting date under HKAS 39,<br />
continued to be measured at FVTPL under HKFRS 9.<br />
24. ACCOUNTS RECEIVABLE AND OTHER RECEIVABLES<br />
Rents from leasing of investment properties are normally received in advance. At the end of the reporting period, accounts<br />
receivable of the Group with carrying amount of HK$6 million (2010: HK$5 million) mainly represented rents receipts in arrears,<br />
which were aged less than 90 days.<br />
25. AMOUNTS DUE FROM/TO SUBSIDIARIES<br />
The <strong>Company</strong><br />
<strong>2011</strong> 2010<br />
HK$ million HK$ million<br />
Amounts due from subsidiaries are classified as:<br />
– Current assets (Note a) 6,088 12,671<br />
– Non-current assets (Note b) 5,126 –<br />
11,214 12,671<br />
Amounts due to subsidiaries (Note a) 480 175<br />
Notes:<br />
(a) The amounts due from/to subsidiaries are unsecured, interest-free and repayable on demand.<br />
(b) The amounts due from subsidiaries are unsecured, interest-free with no fixed terms of repayment and classified as non-current assets as<br />
they are not expected to be recoverable within the next twelve months.<br />
26. AMOUNT DUE FROM AN ASSOCIATE<br />
The amount due from an associate is unsecured, interest-free and repayable on demand. During the year ended 31 December<br />
<strong>2011</strong>, all outstanding balances were fully recovered.<br />
144 <strong>Hysan</strong> <strong>Annual</strong> <strong>Report</strong> <strong>2011</strong>
27. TIME DEPOSITS/CASH AND BANK BALANCES<br />
The Group<br />
<strong>2011</strong> 2010<br />
HK$ million HK$ million<br />
Time deposits 2,899 1,930<br />
Cash and bank balances 62 63<br />
Overview<br />
Cash and deposits with banks shown in the consolidated statement of financial position 2,961 1,993<br />
Less: Time deposits with original maturity over three months (2,307) (1,433)<br />
Cash and cash equivalents shown in the consolidated statement of cash flows 654 560<br />
Included in the <strong>Company</strong>’s time deposits as at 31 December <strong>2011</strong>, were HK$395 million (2010: HK$497 million) of time<br />
deposits with original maturity over three months. The bank balances and remaining time deposits of the <strong>Company</strong> were with<br />
original maturity of three months or less.<br />
Time deposits, cash and bank balances comprise cash and bank deposits carrying effective interest rates ranging from 0.205%<br />
to 2.46% (2010: 0.005 % to 1.55%) per annum.<br />
28. ACCOUNTS PAYABLE AND ACCRUALS<br />
At the end of the reporting period, accounts payable of the Group with carrying amount of HK$324 million (2010: HK$229<br />
million) were aged less than 90 days.<br />
29. AMOUNTS DUE TO NON-CONTROLLING INTERESTS<br />
The amounts due to non-controlling interests are unsecured, interest-free and repayable on demand.<br />
30. BORROWINGS<br />
The analysis of the carrying amounts of borrowings is as follows:<br />
The Group<br />
Current<br />
Non-current<br />
<strong>2011</strong> 2010 <strong>2011</strong> 2010<br />
HK$ million HK$ million HK$ million HK$ million<br />
Unsecured bank loans 150 650 2,690 699<br />
Floating rate notes – – 200 200<br />
Fixed rate notes 1,357 – 1,952 2,750<br />
Zero coupon notes – – 314 288<br />
1,507 650 5,156 3,937<br />
In the current year, the average finance cost of the Group’s total borrowings calculated based on their contracted interest rates<br />
was 3.7% (2010: 3.9%). To manage the interest rate and foreign exchange risks, the Group used certain derivatives to hedge<br />
part of the borrowings, which resulted in a reduction of the Group’s average finance cost to 2.7% (2010: 2.7%). As at 31<br />
December <strong>2011</strong>, the floating rate debt ratio was 54.8% (2010: 53.6%).<br />
Strategy in Action Corporate Governance Financial Statements and Valuation<br />
<strong>Hysan</strong> <strong>Annual</strong> <strong>Report</strong> <strong>2011</strong><br />
145
Notes to the Financial Statements continued<br />
For the year ended 31 December <strong>2011</strong><br />
30. BORROWINGS continued<br />
(a) Unsecured bank loans<br />
The unsecured bank loans of HK$2,840 million (2010: HK$1,349 million) are guaranteed as to principal and interest by the<br />
<strong>Company</strong> and are repayable, based on the scheduled repayment dates set out in the respective loan agreement, as follows:<br />
The Group<br />
<strong>2011</strong> 2010<br />
HK$ million HK$ million<br />
Within 1 year 150 650<br />
More than 1 year, but not exceeding 2 years 699 –<br />
More than 2 years, but not exceeding 5 years 1,991 699<br />
2,840 1,349<br />
All the Group’s unsecured bank loans are variable-rate borrowings with effective interest rates (which were also equal to<br />
contracted interest rates) ranging from 0.59% to 5.37% (2010: 0.69% to 1.51%) per annum at the end of the reporting period.<br />
Interest rates of the loans are normally re-fixed at every one to six months.<br />
As disclosed in note 23(a), cross currency swaps, interest rate swaps and basis swaps were designated as cash flow hedges to<br />
hedge the foreign exchange and interest rate risks of part of the Group’s unsecured bank loans.<br />
(b) Floating rate notes<br />
In October 2009, HK$200 million five-year floating rate notes were issued by <strong>Hysan</strong> (MTN) <strong>Limited</strong>, a wholly-owned subsidiary<br />
of the <strong>Company</strong>. The notes are guaranteed as to principal and interest by the <strong>Company</strong>, bear effective interest rates (which are<br />
equal to contracted interest rates) of 1.26% (2010: 1.30%) per annum at the end of reporting period and are repayable in full in<br />
2014.<br />
The HK$200 million five-year floating rate notes were not hedged by any derivative in both years.<br />
146 <strong>Hysan</strong> <strong>Annual</strong> <strong>Report</strong> <strong>2011</strong>
30. BORROWINGS continued<br />
(c) Fixed rate notes<br />
The Group<br />
<strong>2011</strong> 2010<br />
HK$ million HK$ million<br />
Overview<br />
Fixed rate notes – principal amount 3,274 2,720<br />
Add: Net loss attributable to hedged risks 35 30<br />
Details of the Group’s fixed rate notes at 31 December <strong>2011</strong> and 2010 are as follows:<br />
3,309 2,750<br />
Contracted<br />
interest rate<br />
Coupon<br />
Principal amount per annum payment term Issue date Maturity date<br />
US$174 million* 7.00% semi-annual basis February 2002 February 2012<br />
HK$300 million 5.25% quarterly basis August 2008 August 2015<br />
HK$100 million 5.10% annual basis August 2008 August 2015<br />
HK$165 million 5.38% annual basis September 2008 September 2020<br />
HK$400 million 3.78% quarterly basis August 2010 August 2020<br />
HK$200 million 4.00% annual basis September 2010 September 2025<br />
HK$200 million 3.70% quarterly basis October 2010 October 2022<br />
HK$150 million 3.86% quarterly basis May <strong>2011</strong> May 2018<br />
HK$404 million 4.10% annual basis December <strong>2011</strong> December 2023<br />
* In February 2002, US$200 million 10-year fixed rate notes were issued by <strong>Hysan</strong> (MTN) <strong>Limited</strong>. In 2006 and 2010, US$18 million and<br />
US$8 million of the notes were repurchased and cancelled respectively. The outstanding amount of the notes at the end of the reporting<br />
period was US$174 million (2010: US$174 million).<br />
All the fixed rate notes were issued by <strong>Hysan</strong> (MTN) <strong>Limited</strong>. The notes are guaranteed as to principal and interest by the<br />
<strong>Company</strong> and bear an effective interest rate equal to their respective contracted interest rate.<br />
As detailed in note 23, forward foreign exchange contracts, interest rate swaps, cross currency swaps and net basis swaps were<br />
used to hedge or manage the foreign exchange and interest rate risks of the Group’s fixed rate notes at the end of the reporting<br />
period.<br />
The net loss of HK$35 million (2010: HK$30 million) represented the change in fair value attributable to the hedged interest<br />
rate risk of the HK$300 million (2010: HK$365 million) fixed rate notes under fair value hedge.<br />
(d) Zero coupon notes<br />
The Group<br />
<strong>2011</strong> 2010<br />
HK$ million HK$ million<br />
Zero coupon notes 282 268<br />
Add: Loss attributable to hedged risk 32 20<br />
314 288<br />
In February 2005, 15-year zero coupon notes of nominal amount of HK$430 million were issued at an issue price of around<br />
46.37% of the nominal amount by <strong>Hysan</strong> (MTN) <strong>Limited</strong>. The notes are guaranteed as to nominal amount by the <strong>Company</strong>, bear<br />
an effective yield (which is equal to contracted yield) at the rate of 5.19% per annum and are repayable at par in February 2020.<br />
<strong>Hysan</strong> (MTN) <strong>Limited</strong> has the option to redeem the notes on 7 February 2015 at a price of about 77.4% of the nominal amount.<br />
The Group has entered into an interest rate swap to hedge against the interest rate risk of the zero coupon notes under fair<br />
value hedge (see note 23(b) for details).<br />
The loss of HK$32 million (2010: HK$20 million) represented changes in fair value attributable to the hedged interest rate risk<br />
of the zero coupon notes under fair value hedge.<br />
Strategy in Action Corporate Governance Financial Statements and Valuation<br />
<strong>Hysan</strong> <strong>Annual</strong> <strong>Report</strong> <strong>2011</strong><br />
147
Notes to the Financial Statements continued<br />
For the year ended 31 December <strong>2011</strong><br />
31. DEFERRED TAXATION<br />
The following are the major deferred tax liabilities (assets) recognised by the Group and movements thereon during the current<br />
and prior years:<br />
Accelerated tax Revaluation of Tax<br />
depreciation properties losses Total<br />
HK$ million HK$ million HK$ million HK$ million<br />
The Group<br />
At 1 January 2010 266 35 (4) 297<br />
Charge to profit or loss (note 9) 31 – 4 35<br />
Charge to other comprehensive income – 5 – 5<br />
At 31 December 2010 297 40 – 337<br />
Charge (credit) to profit or loss (note 9) 30 – (21) 9<br />
Charge to other comprehensive income – 14 – 14<br />
At 31 December <strong>2011</strong> 327 54 (21) 360<br />
At the end of the reporting period, the Group has unused estimated tax losses of HK$648 million (2010: HK$570 million), of<br />
which HK$327 million (2010: HK$253 million) has not been agreed by the Hong Kong Inland Revenue Department, available for<br />
offset against future profits. A deferred tax asset has been recognised in respect of HK$126 million (2010: nil) of such losses.<br />
No deferred tax asset has been recognised in respect of the estimated tax losses of HK$522 million (2010: HK$570 million)<br />
as the utilisation of these estimated tax losses is uncertain. These estimated tax losses may be carried forward indefinitely.<br />
The <strong>Company</strong> does not have any unused tax loss at the end of the reporting period. During the year, deferred tax liability of<br />
the <strong>Company</strong> has been recognised in respect of the accelerated tax depreciation of HK$1 million (2010: nil). At the end of the<br />
reporting period, the <strong>Company</strong> has deferred tax liability of HK$1 million (2010: nil).<br />
148 <strong>Hysan</strong> <strong>Annual</strong> <strong>Report</strong> <strong>2011</strong>
32. SHARE CAPITAL<br />
Number of shares<br />
Share capital<br />
<strong>2011</strong> 2010 <strong>2011</strong> 2010<br />
HK$ million<br />
HK$ million<br />
Ordinary shares of HK$5 each<br />
Authorised:<br />
At 1 January and 31 December 1,450,000,000 1,450,000,000 7,250 7,250<br />
Overview<br />
Issued and fully paid:<br />
At 1 January 1,053,426,635 1,050,608,090 5,267 5,253<br />
Issue of shares pursuant to<br />
scrip dividend schemes (Note a) 5,136,783 2,762,879 26 14<br />
Issue of shares under share<br />
option scheme (Note b) 1,190,997 55,666 6 –<br />
At 31 December 1,059,754,415 1,053,426,635 5,299 5,267<br />
Notes:<br />
(a) Issue of shares pursuant to scrip dividend schemes<br />
For the year ended 31 December <strong>2011</strong><br />
On 2 June <strong>2011</strong> and 20 September <strong>2011</strong> respectively, the <strong>Company</strong> issued and allotted a total of 4,584,611 shares and 552,172 shares of<br />
HK$5 each in the <strong>Company</strong> at HK$36.55 and HK$30.43 to the shareholders who elected to receive shares in the <strong>Company</strong> in lieu of cash for<br />
the 2010 final and <strong>2011</strong> interim dividends pursuant to the scrip dividend schemes announced by the <strong>Company</strong> on 9 May <strong>2011</strong> and 25 August<br />
<strong>2011</strong>. These shares rank pari passu in all respects with other shares in issue.<br />
For the year ended 31 December 2010<br />
On 3 June 2010 and 21 September 2010 respectively, the <strong>Company</strong> issued and allotted a total of 1,321,595 shares and 1,441,284 shares of<br />
HK$5 each in the <strong>Company</strong> at HK$21.68 and HK$24.19 to the shareholders who elected to receive shares in the <strong>Company</strong> in lieu of cash for<br />
the 2009 final and 2010 interim dividends pursuant to the scrip dividend schemes announced by the <strong>Company</strong> on 11 May 2010 and 26 August<br />
2010. These shares rank pari passu in all respects with other shares in issue.<br />
(b) Issue of shares under share option schemes<br />
During the year, options to subscribe for shares of the <strong>Company</strong> for a total of 1,190,997 shares (2010: 55,666 shares) were exercised at<br />
various exercise prices. These shares rank pari passu in all respects with other shares in issue. Details of options outstanding and movements<br />
during the year are set out in note 40.<br />
Strategy in Action Corporate Governance Financial Statements and Valuation<br />
<strong>Hysan</strong> <strong>Annual</strong> <strong>Report</strong> <strong>2011</strong><br />
149
Notes to the Financial Statements continued<br />
For the year ended 31 December <strong>2011</strong><br />
33. RESERVES OF THE COMPANY<br />
The <strong>Company</strong>’s reserves available for distribution to its owners as at 31 December <strong>2011</strong> amounted to HK$5,580 million (2010:<br />
HK$5,739 million), being its general reserve and retained profits at that date.<br />
Share Capital<br />
Share options redemption General Retained<br />
premium reserve reserve reserve profits Total<br />
HK$ million HK$ million HK$ million HK$ million HK$ million HK$ million<br />
(Note)<br />
At 1 January 2010 1,703 10 276 100 5,760 7,849<br />
Issue of shares pursuant to<br />
scrip dividend schemes 50 – – – – 50<br />
Issue of shares under<br />
share option schemes 1 – – – – 1<br />
Recognition of equity-settled<br />
share-based payments – 6 – – – 6<br />
Profit for the year – – – – 593 593<br />
Dividends paid during the year (note 14) – – – – (714) (714)<br />
At 31 December 2010 1,754 16 276 100 5,639 7,785<br />
Issue of shares pursuant to<br />
scrip dividend schemes 159 – – – – 159<br />
Issue of shares under<br />
share option schemes 21 (6) – – – 15<br />
Recognition of equity-settled<br />
share-based payments – 7 – – – 7<br />
Forfeiture of share options – (2) – – 2 –<br />
Profit for the year – – – – 630 630<br />
Dividends paid during the year (note 14) – – – – (791) (791)<br />
At 31 December <strong>2011</strong> 1,934 15 276 100 5,480 7,805<br />
Note: General reserve was set up from the transfer of retained profits.<br />
34. ACQUISITION OF A SUBSIDIARY<br />
During the year ended 31 December <strong>2011</strong>, the Group acquired 100% interest in Moral Hill Investment <strong>Limited</strong> (“Moral Hill”)<br />
from an independent third party, for a cash consideration of HK$19 million. The major asset of Moral Hill is an investment<br />
property situated in Hong Kong and as such, the acquisition has been accounted for as acquisition of an asset rather than a<br />
business combination.<br />
35. RETIREMENT BENEFITS PLANS<br />
With effect from 1 December 2000, the Group set up an enhanced Mandatory Provident Fund Scheme (the “Enhanced MPF<br />
Scheme”), a defined contribution scheme, for all qualifying employees. The Enhanced MPF Scheme is registered with the<br />
Mandatory Provident Fund Schemes Authority under Section 124(1) of the Mandatory Provident Fund Schemes (General)<br />
Regulation.<br />
Pursuant to the rules of the Enhanced MPF Scheme, the Group’s contributions to the plan are based on fixed percentages of<br />
members’ salaries, ranging from 5% of MPF Relevant Income to 15% of basic salary. Members’ mandatory contributions are<br />
fixed at 5% of MPF Relevant Income, in compliance with MPF legislation.<br />
Total contributions made by the Group during the year amounted to HK$6 million (2010: HK$6 million). Forfeited contributions<br />
for the year amounting to HK$1 million (2010: HK$1 million) were refunded to the Group.<br />
150 <strong>Hysan</strong> <strong>Annual</strong> <strong>Report</strong> <strong>2011</strong>
36. CONTINGENT LIABILITIES<br />
At the end of the reporting period, there were contingent liabilities in respect of the following:<br />
The Group<br />
The <strong>Company</strong><br />
<strong>2011</strong> 2010 <strong>2011</strong> 2010<br />
HK$ million HK$ million HK$ million HK$ million<br />
Overview<br />
Corporate guarantee to note holders<br />
– for issue of floating rate notes – – 200 200<br />
– for issue of fixed rate notes – – 3,276 2,722<br />
– for issue of zero coupon notes – – 430 430<br />
– – 3,906 3,352<br />
Guarantees to banks for providing<br />
financing facilities to subsidiaries – – 2,850 1,349<br />
37. CAPITAL COMMITMENTS<br />
At the end of the reporting period, the Group and the <strong>Company</strong> had the following capital commitments in respect of its<br />
investment properties and property, plant and equipment:<br />
The Group<br />
The <strong>Company</strong><br />
<strong>2011</strong> 2010 <strong>2011</strong> 2010<br />
HK$ million HK$ million HK$ million HK$ million<br />
Authorised but not contracted for 505 535 7 11<br />
Contracted but not provided for 885 1,535 6 –<br />
38. LEASE COMMITMENTS<br />
(a) The Group as lessor<br />
At the end of the reporting period, the Group had contracted with tenants for the following future minimum lease payments:<br />
The Group<br />
<strong>2011</strong> 2010<br />
HK$ million HK$ million<br />
Within one year 1,795 1,260<br />
In the second to fifth year inclusive 3,708 1,586<br />
Over five years 2,229 252<br />
7,732 3,098<br />
Operating lease payments represent rentals receivable by the Group from leasing of its investment properties. Typically, leases<br />
are negotiated and rentals are fixed for lease term of one to three years. Certain leases include contingent rentals calculated<br />
with reference to turnover of the tenants.<br />
Strategy in Action Corporate Governance Financial Statements and Valuation<br />
<strong>Hysan</strong> <strong>Annual</strong> <strong>Report</strong> <strong>2011</strong><br />
151
Notes to the Financial Statements continued<br />
For the year ended 31 December <strong>2011</strong><br />
38. LEASE COMMITMENTS continued<br />
(b) The <strong>Company</strong> as lessee<br />
At the end of the reporting period, the <strong>Company</strong> had commitments for future minimum lease payments under non-cancellable<br />
operating leases which fall due as follows:<br />
The <strong>Company</strong><br />
<strong>2011</strong> 2010<br />
HK$ million HK$ million<br />
Within one year 7 22<br />
In the second to fifth year inclusive – 9<br />
7 31<br />
Operating lease payments represent rentals payable by the <strong>Company</strong> to its subsidiaries for its office premises which are<br />
negotiated and rentals are fixed for three years.<br />
At the end of the reporting period, the Group had no commitment under non-cancellable operating lease.<br />
39. RELATED PARTY TRANSACTIONS AND BALANCES<br />
(a) Transactions and balances with related parties<br />
The Group has the following transactions with related parties during the year and has the following balances with them at the<br />
end of the reporting period:<br />
The Group<br />
Gross rental income<br />
Amount due to<br />
received from<br />
a non-controlling interest<br />
(Note a) (Note b)<br />
<strong>2011</strong> 2010 <strong>2011</strong> 2010<br />
HK$ million HK$ million HK$ million HK$ million<br />
Substantial shareholder 3 3 – –<br />
Directors – 1 – –<br />
Companies controlled by Directors or their associates 26 25 94 94<br />
Notes:<br />
(a) The sum of transactions with substantial shareholder represented the aggregate gross rental income received from Atlas Corporate<br />
Management <strong>Limited</strong>, a wholly-owned subsidiary of Lee <strong>Hysan</strong> Estate <strong>Company</strong>, <strong>Limited</strong>, which holds 40.87% (2010: 41.12%) beneficial<br />
interest in the <strong>Company</strong>.<br />
(b) The sum represents outstanding loan advanced to a non wholly-owned subsidiary of the Group, Barrowgate <strong>Limited</strong> (“Barrowgate”)<br />
by Mightyhall <strong>Limited</strong>, a wholly-owned subsidiary of Jebsen and <strong>Company</strong> <strong>Limited</strong>, of which Hans Michael JEBSEN is a director and<br />
shareholder, as shareholders’ loan in proportion to its shareholding in Barrowgate for general funding purpose. The amount is unsecured,<br />
interest-free and repayable on demand.<br />
152 <strong>Hysan</strong> <strong>Annual</strong> <strong>Report</strong> <strong>2011</strong>
39. RELATED PARTY TRANSACTIONS AND BALANCES continued<br />
(a) Transactions and balances with related parties continued<br />
The <strong>Company</strong> has the following balances with its subsidiaries at the end of the reporting period:<br />
The <strong>Company</strong><br />
<strong>2011</strong> 2010<br />
HK$ million HK$ million<br />
Overview<br />
Amounts due from subsidiaries 11,462 12,919<br />
Less: Allowances on amounts due therefrom (248) (248)<br />
11,214 12,671<br />
Amounts due to subsidiaries 480 175<br />
Details of amounts due from/to subsidiaries are disclosed in note 25.<br />
(b) Compensation of key management personnel<br />
The remuneration of Directors and other members of key management of the Group and the <strong>Company</strong> during the year were as<br />
follows:<br />
<strong>2011</strong> 2010<br />
HK$ million HK$ million<br />
Directors’ fees, salaries and other short-term employee benefits 27 18<br />
Share-based payments 5 4<br />
Retirement benefits scheme contributions – –<br />
32 22<br />
The remuneration of the Directors and key executives is determined by the Remuneration Committee and Chief Executive Officer<br />
respectively having regard to the performance of individuals and market trends.<br />
40. SHARE-BASED PAYMENT TRANSACTIONS<br />
(a) Equity-settled share option schemes<br />
The 1995 Share Option Scheme (the “1995 Scheme”)<br />
The 1995 Scheme was approved by shareholders on 28 April 1995 and had a term of 10 years. It expired on 28 April 2005. As<br />
at 31 December <strong>2011</strong>, all options granted under the 1995 Scheme had been exercised.<br />
The purpose of the 1995 Scheme was to strengthen the links between individual staff and shareholder interests.<br />
Under the 1995 Scheme, options to subscribe for ordinary shares of the <strong>Company</strong> may be granted to employees of the<br />
<strong>Company</strong> or any of its wholly-owned subsidiaries selected by the Board at its discretion.<br />
The maximum number of shares in respect of which options may be granted under the 1995 Scheme (together with shares<br />
issued and issuable under the scheme) was 3% of the issued share capital of the <strong>Company</strong> (excluding shares issued pursuant<br />
to the scheme and any other share option scheme) from time to time. The maximum number of shares issued under the<br />
scheme and other scheme will not exceed 10% of the issued share capital of the <strong>Company</strong> from time to time (excluding shares<br />
issued pursuant to the scheme and any other share option scheme).<br />
Strategy in Action Corporate Governance Financial Statements and Valuation<br />
<strong>Hysan</strong> <strong>Annual</strong> <strong>Report</strong> <strong>2011</strong><br />
153
Notes to the Financial Statements continued<br />
For the year ended 31 December <strong>2011</strong><br />
40. SHARE-BASED PAYMENT TRANSACTIONS continued<br />
(a) Equity-settled share option schemes continued<br />
The 1995 Share Option Scheme (the “1995 Scheme”) continued<br />
The maximum entitlement of each participant is substantially below the limit set out under the scheme rules (being 25% of the<br />
maximum number of shares in respect of which options may at any time be granted under the 1995 Scheme). For the options<br />
granted under the 1995 Scheme that are currently outstanding, the basis for determining the exercise price is the highest of (i)<br />
the closing price of the shares as stated in the Stock Exchange’s daily quotations sheet on the date of grant; (ii) the average of<br />
the closing prices of the shares as stated in the Stock Exchange’s daily quotations sheets for the 5 business days immediately<br />
preceding the date of grant; and (iii) the nominal value of the shares. Consideration on each grant of option was HK$1 and was<br />
paid within 30 days from the date of grant of option, with full payment for exercise price to be made on exercise of the relevant<br />
option.<br />
The 2005 Share Option Scheme (the “2005 Scheme”)<br />
The <strong>Company</strong> adopted the 2005 Scheme at its <strong>Annual</strong> General Meeting (“AGM”) held on 10 May 2005, which has a term of 10<br />
years and will be expiring on 9 May 2015 (together with the 1995 Scheme are referred to as the “Schemes”).<br />
The purpose of the 2005 Scheme is to provide an incentive for employees of the <strong>Company</strong> and its wholly-owned subsidiaries to<br />
work with commitment towards enhancing the value of the <strong>Company</strong> and its shares for the benefit of its shareholders.<br />
Under the 2005 Scheme, options to subscribe for ordinary shares of the <strong>Company</strong> may be granted to employees of the<br />
<strong>Company</strong> or any wholly-owned subsidiaries (including executive Directors) and such other persons as the Board may consider<br />
appropriate from time to time, on the basis of their contribution to the development and growth of the <strong>Company</strong> and its<br />
subsidiaries.<br />
The maximum number of shares in respect of which options may be granted under the 2005 Scheme and any other share<br />
option scheme of the <strong>Company</strong> shall not exceed such number of shares as required under the Rules Governing the Listing of<br />
Securities on the Stock Exchange (“the Listing Rules”), currently being 10% of the shares in issue as at 10 May 2005, the<br />
date of the AGM approving the 2005 Scheme (being 104,996,365 shares). Under the Listing Rules, a listed issuer may seek<br />
approval by its shareholders in general meeting for “refreshing” the 10% limit under the scheme. The limit on the number of<br />
shares which may be issued upon exercise of all outstanding options granted and yet to be exercised under the 2005 Scheme<br />
and any other share option scheme of the <strong>Company</strong> must not exceed 30% of the shares in issue from time to time (or such<br />
number of shares as required under the Listing Rules). No options may be granted if such grant will result in this 30% limit<br />
being exceeded.<br />
The maximum entitlement of each participant under the 2005 Scheme must not during any 12-month period exceed such<br />
number of shares as required under the Listing Rules (which is 1% of the total shares in issue as at the date of shareholder<br />
approval, being 10,499,636 shares). The exercise price shall be at least the highest of (i) the closing price of the shares as<br />
stated in the Stock Exchange’s daily quotations sheet on the date of grant; (ii) the average of the closing prices of the shares as<br />
stated in the Stock Exchange’s daily quotations sheets for the 5 business days immediately preceding the date of grant; and (iii)<br />
the nominal value of the shares. Consideration on each grant of option is HK$1 and is required to be paid within 30 days from<br />
the date of grant of option, with full payment for exercise price to be made on exercise of the relevant option.<br />
154 <strong>Hysan</strong> <strong>Annual</strong> <strong>Report</strong> <strong>2011</strong>
40. SHARE-BASED PAYMENT TRANSACTIONS continued<br />
(b) Grant and vesting structures<br />
Under the <strong>Company</strong>’s current policy, grants will be made on a periodic basis. Vesting period is 3 years in equal proportions. Size<br />
of grant will be determined by reference to base salary multiple and job grades. A clear performance criterion will be a key driver.<br />
The Board will review the grant and vesting structures from time to time.<br />
Overview<br />
(c) Movement of share options<br />
The following table discloses movements of the <strong>Company</strong>’s share options held by the Directors and eligible employees during<br />
the current year:<br />
Changes during the year<br />
Balance<br />
Balance<br />
Exercise Exercisable as at Cancelled/ as at<br />
Name Date of grant price period 1.1.<strong>2011</strong> Granted Exercised lapsed 31.12.<strong>2011</strong><br />
HK$ (Note a)<br />
1995 Scheme<br />
Executive Director<br />
Wendy Wen Yee YUNG 30.3.2005 15.850 30.3.2005 – 96,000 – (96,000) – –<br />
29.3.2015 (Note b)<br />
2005 Scheme<br />
Executive Directors<br />
Peter Ting Chang LEE 6.3.2007 21.380 6.3.2007 – 235,000 – (235,000) – –<br />
(Note c) 16.1.<strong>2011</strong> (Note d)<br />
13.3.2008 21.450 13.3.2008 – 260,000 – (173,333) (86,667) –<br />
16.1.<strong>2011</strong> (Note d)<br />
11.3.2009 11.760 11.3.2009 – 500,000 – (166,666) (333,334) –<br />
16.1.<strong>2011</strong> (Note d)<br />
Gerry Lui Fai YIM 1.12.2009 22.800 1.12.2009 – 218,000 – – – 218,000<br />
30.11.2019<br />
10.3.<strong>2011</strong> 35.710 10.3.<strong>2011</strong> – – 217,000 – – 217,000<br />
(Note e) 9.3.2021<br />
Wendy Wen Yee YUNG 26.6.2006 20.110 26.6.2006 – 110,000 – (110,000) – –<br />
25.6.2016 (Note b)<br />
30.3.2007 21.250 30.3.2007 – 95,000 – – – 95,000<br />
29.3.2017<br />
31.3.2008 21.960 31.3.2008 – 100,000 – – – 100,000<br />
30.3.2018<br />
11.3.2009 11.760 11.3.2009 – 300,000 – (200,000) – 100,000<br />
10.3.2019 (Note b)<br />
11.3.2010 22.100 11.3.2010 – 185,000 – – – 185,000<br />
10.3.2020<br />
10.3.<strong>2011</strong> 35.710 10.3.<strong>2011</strong> – – 103,000 – – 103,000<br />
(Note e) 9.3.2021<br />
Strategy in Action Corporate Governance Financial Statements and Valuation<br />
<strong>Hysan</strong> <strong>Annual</strong> <strong>Report</strong> <strong>2011</strong><br />
155
Notes to the Financial Statements continued<br />
For the year ended 31 December <strong>2011</strong><br />
40. SHARE-BASED PAYMENT TRANSACTIONS continued<br />
(c) Movement of share options continued<br />
Changes during the year<br />
Balance<br />
Balance<br />
Exercise Exercisable as at Cancelled/ as at<br />
Name Date of grant price period 1.1.<strong>2011</strong> Granted Exercised lapsed 31.12.<strong>2011</strong><br />
HK$ (Note a)<br />
2005 Scheme continued<br />
Eligible employees 30.3.2006 22.000 30.3.2006 – 15,000 – (15,000) – –<br />
(Note f) 29.3.2016 (Note g)<br />
30.3.2007 21.250 30.3.2007 – 15,000 – (15,000) – –<br />
29.3.2017 (Note h)<br />
31.3.2008 21.960 31.3.2008 – 78,000 – (55,000) – 23,000<br />
30.3.2018 (Note i)<br />
2.5.2008 23.900 2.5.2008 – 95,000 – – – 95,000<br />
1.5.2018<br />
2.10.2008 20.106 2.10.2008 – 85,000 – – – 85,000<br />
1.10.2018<br />
31.3.2009 13.300 31.3.2009 – 363,334 – (86,999) (13,667) 262,668<br />
30.3.2019 (Note j) (Note k)<br />
31.3.2010 22.450 31.3.2010 – 523,000 – (37,999) (44,000) 441,001<br />
30.3.2020 (Note l) (Note k)<br />
31.3.<strong>2011</strong> 32.000 31.3.<strong>2011</strong> – – 393,000 – (23,000) 370,000<br />
(Note m) 30.3.2021 (Note k)<br />
3,273,334 713,000 (1,190,997) (500,668) 2,294,669<br />
Notes:<br />
(a) All options granted have a vesting period of 3 years in equal proportions.<br />
(b) The weighted average closing price of the shares of the <strong>Company</strong> immediately before the date on which the options were exercised was<br />
HK$34.25.<br />
(c) The late Chairman, Peter Ting Chang LEE, passed away on 17 October 2009. An extension in time (to 16 January <strong>2011</strong>) for exercising<br />
his options was granted to his legal personal representative pursuant to the 2005 Scheme. Share options of 235,000, 173,333 and<br />
166,666, which were granted to him on 6 March 2007, 13 March 2008 and 11 March 2009 respectively, were exercised by the sole<br />
executrix to his estate on 3 January <strong>2011</strong>. The unvested share options of 420,001 lapsed on 17 January <strong>2011</strong>.<br />
(d) The weighted average closing price of the shares of the <strong>Company</strong> immediately before the date on which the options were exercised was<br />
HK$36.60.<br />
(e) The closing price of the shares of the <strong>Company</strong> immediately before the date of grant (i.e. as of 9 March <strong>2011</strong>) was HK$35.70.<br />
(f) Eligible employees are working under employment contracts that are regarded as “continuous contracts” for the purposes of the<br />
Employment Ordinance.<br />
(g) The weighted average closing price of the shares of the <strong>Company</strong> immediately before the date on which the options were exercised was<br />
HK$33.65.<br />
(h) The weighted average closing price of the shares of the <strong>Company</strong> immediately before the date on which the options were exercised was<br />
HK$36.25.<br />
(i) The weighted average closing price of the shares of the <strong>Company</strong> immediately before the date on which the options were exercised was<br />
HK$34.68.<br />
(j) The weighted average closing price of the shares of the <strong>Company</strong> immediately before the date on which the options were exercised was<br />
HK$34.98.<br />
(k) The unvested options lapsed during the year upon resignations of certain eligible employees.<br />
(l) The weighted average closing price of the shares of the <strong>Company</strong> immediately before the date on which the options were exercised was<br />
HK$35.06.<br />
(m) The closing price of the shares of the <strong>Company</strong> immediately before the date of grant (i.e. as of 30 March <strong>2011</strong>) was HK$31.95.<br />
Apart from the above, the <strong>Company</strong> had not granted any share option under the Schemes to any other persons as required to<br />
be disclosed under Rule 17.07 of the Listing Rules.<br />
156 <strong>Hysan</strong> <strong>Annual</strong> <strong>Report</strong> <strong>2011</strong>
40. SHARE-BASED PAYMENT TRANSACTIONS continued<br />
(c) Movement of share options continued<br />
The following table discloses movements of the <strong>Company</strong>’s share options held by the Directors and eligible employees in prior<br />
year:<br />
Overview<br />
Changes during the year<br />
Balance<br />
Balance<br />
Exercise Exercisable as at Cancelled/ as at<br />
Name Date of grant price period 1.1.2010 Granted Exercised lapsed 31.12.2010<br />
HK$ (Note a)<br />
1995 Scheme<br />
Executive Director<br />
Wendy Wen Yee YUNG 30.3.2005 15.850 30.3.2005 – 96,000 – – – 96,000<br />
29.3.2015<br />
2005 Scheme<br />
Executive Directors<br />
Peter Ting Chang LEE 6.3.2007 21.380 6.3.2007 – 235,000 – – – 235,000<br />
(Note b) 16.1.<strong>2011</strong><br />
13.3.2008 21.450 13.3.2008 – 260,000 – – – 260,000<br />
16.1.<strong>2011</strong><br />
11.3.2009 11.760 11.3.2009 – 500,000 – – – 500,000<br />
16.1.<strong>2011</strong><br />
Gerry Lui Fai YIM 1.12.2009 22.800 1.12.2009 – 218,000 – – – 218,000<br />
30.11.2019<br />
Wendy Wen Yee YUNG 26.6.2006 20.110 26.6.2006 – 110,000 – – – 110,000<br />
25.6.2016<br />
30.3.2007 21.250 30.3.2007 – 95,000 – – – 95,000<br />
29.3.2017<br />
31.3.2008 21.960 31.3.2008 – 100,000 – – – 100,000<br />
30.3.2018<br />
11.3.2009 11.760 11.3.2009 – 300,000 – – – 300,000<br />
10.3.2019<br />
11.3.2010 22.100 11.3.2010 – – 185,000 – – 185,000<br />
(Note c) 10.3.2020<br />
Eligible employees 30.3.2006 22.000 30.3.2006 – 23,000 – (8,000) – 15,000<br />
(Note d) 29.3.2016 (Note e)<br />
30.3.2007 21.250 30.3.2007 – 31,000 – (16,000) – 15,000<br />
29.3.2017 (Note e)<br />
31.3.2008 21.960 31.3.2008 – 88,000 – (10,000) – 78,000<br />
30.3.2018 (Note e)<br />
2.5.2008 23.900 2.5.2008 – 95,000 – – – 95,000<br />
1.5.2018<br />
2.10.2008 20.106 2.10.2008 – 85,000 – – – 85,000<br />
1.10.2018<br />
31.3.2009 13.300 31.3.2009 – 411,000 – (21,666) (26,000) 363,334<br />
30.3.2019 (Note f) (Note g)<br />
31.3.2010 22.450 31.3.2010 – – 529,000 – (6,000) 523,000<br />
(Note h) 30.3.2020 (Note g)<br />
2,647,000 714,000 (55,666) (32,000) 3,273,334<br />
Strategy in Action Corporate Governance Financial Statements and Valuation<br />
<strong>Hysan</strong> <strong>Annual</strong> <strong>Report</strong> <strong>2011</strong><br />
157
Notes to the Financial Statements continued<br />
For the year ended 31 December <strong>2011</strong><br />
40. SHARE-BASED PAYMENT TRANSACTIONS continued<br />
(c) Movement of share options continued<br />
Notes:<br />
(a)<br />
(b)<br />
(c)<br />
(d)<br />
(e)<br />
(f)<br />
(g)<br />
(h)<br />
All options granted have a vesting period of 3 years in equal proportions.<br />
The late Chairman, Peter Ting Chang LEE, passed away on 17 October 2009. An extension in time (to 16 January <strong>2011</strong>) for exercising<br />
his options was granted to his legal personal representative pursuant to the 2005 Scheme. Share options of 235,000, 173,333 and<br />
166,666, which were granted to him on 6 March 2007, 13 March 2008 and 11 March 2009 respectively, were exercised by the sole<br />
executrix to his estate on 3 January <strong>2011</strong>. The unvested share options of 420,001 lapsed on 17 January <strong>2011</strong>.<br />
The closing price of the shares of the <strong>Company</strong> immediately before the date of grant (i.e. as of 10 March 2010) was HK$22.40.<br />
Eligible employees are working under employment contracts that are regarded as “continuous contracts” for the purposes of the<br />
Employment Ordinance.<br />
The weighted average closing price of the shares of the <strong>Company</strong> immediately before the date on which the options were exercised was<br />
HK$33.40.<br />
The weighted average closing price of the shares of the <strong>Company</strong> immediately before the date on which the options were exercised was<br />
HK$28.62.<br />
The options lapsed during the year upon resignations of certain eligible employees.<br />
The closing price of the shares of the <strong>Company</strong> immediately before the date of grant (i.e. as of 30 March 2010) was HK$22.55.<br />
Apart from the above, the <strong>Company</strong> had not granted any share option under the Schemes to any other persons as required to<br />
be disclosed under Rule 17.07 of the Listing Rules.<br />
158 <strong>Hysan</strong> <strong>Annual</strong> <strong>Report</strong> <strong>2011</strong>
40. SHARE-BASED PAYMENT TRANSACTIONS continued<br />
(d) Fair values of share options<br />
The Group has applied HKFRS 2 “Share-based Payments” to account for its share options granted after 7 November 2002 and<br />
vested after 1 January 2005. In accordance with HKFRS 2, fair value of share options granted to employees determined at<br />
the date of grant is expensed over the vesting period, with a corresponding adjustment to the Group’s share options reserve.<br />
In the current year, the Group recognised the share option expenses of HK$7 million (2010: HK$6 million) in relation to share<br />
options granted by the <strong>Company</strong>, of which HK$3 million (2010: HK$2 million) related to the Directors (see note 12), with a<br />
corresponding adjustment recognised in the Group’s share options reserve.<br />
Overview<br />
The fair values of share options granted by the <strong>Company</strong> were determined by using Black-Scholes option pricing model<br />
(the “Model”). The Model is one of the commonly used models to estimate the fair value of an option. The variables and<br />
assumptions used in computing the fair value of the share options are based on the management’s best estimate. The value<br />
of an option varies with different variables of a number of subjective assumptions. Any change in the variables so adopted may<br />
materially affect the estimation of the fair value of an option.<br />
The inputs into the Model were as follows:<br />
Date of grant 31.3.<strong>2011</strong> 10.3.<strong>2011</strong> 31.3.2010 11.3.2010<br />
Closing share price at the date of grant HK$32.000 HK$34.000 HK$22.450 HK$22.100<br />
Exercise price HK$32.000 HK$35.710 HK$22.450 HK$22.100<br />
Risk free rate (Note a) 2.687% 2.717% 2.843% 2.780%<br />
Expected life of option (Note b) 10 years 10 years 10 years 10 years<br />
Expected volatility (Note c) 34.151% 34.026% 35.489% 35.459%<br />
Expected dividend per annum (Note d) HK$0.640 HK$0.640 HK$0.582 HK$0.582<br />
Estimated fair values per share option HK$12.409 HK$12.553 HK$8.598 HK$8.425<br />
Notes:<br />
(a) Risk free rate: being the approximate yields of 10-year Exchange Fund Notes traded on the date of grant, matching the expected life of<br />
each option.<br />
(b) Expected life of option: being the period of 10 years commencing on the date of grant, based on management’s best estimates for the<br />
effects of non-transferability, exercise restriction and behavioural consideration.<br />
(c) Expected volatility: being the appropriate historical volatility of closing prices of the shares of the <strong>Company</strong> in the past 10 years<br />
immediately before the date of grant, matching the expected life of the options of 10 years.<br />
(d) Expected dividend per annum: being the approximate average annual cash dividend for the past 5 financial years.<br />
Strategy in Action Corporate Governance Financial Statements and Valuation<br />
<strong>Hysan</strong> <strong>Annual</strong> <strong>Report</strong> <strong>2011</strong><br />
159
Financial Risk Management<br />
For the year ended 31 December <strong>2011</strong><br />
1. FINANCIAL RISK MANAGEMENT OBJECTIVES AND POLICIES<br />
The Group’s major financial instruments include cash and bank balances, time deposits, principal-protected investments, term<br />
notes, amount due from an associate, accounts receivable, other receivables, equity investments, available-for-sale financial<br />
assets, zero coupon convertible note, accounts payable, accruals, rental deposits from tenants, amounts due to non-controlling<br />
interests, borrowings and derivative financial instruments. The <strong>Company</strong>’s major financial instruments include cash and bank<br />
balances, time deposits, other receivables, amounts due from/to subsidiaries, other payable and accruals. Details of these<br />
financial instruments are disclosed in respective Notes to the Financial Statements. The risks associated with these financial<br />
instruments and the policies on how to mitigate these risks are set out below. The management manages and monitors these<br />
exposures to ensure appropriate measures are implemented on a timely and effective manner.<br />
(a) Credit risk<br />
The credit risk of the Group or the <strong>Company</strong> are primarily attributable to rents receivable from tenants, amounts due from<br />
subsidiaries, amount due from an associate, principal-protected investments, derivative financial instruments, zero coupon<br />
convertible note, term notes, time deposits and bank balances. The Group’s and the <strong>Company</strong>’s maximum exposure to<br />
credit risk which will cause a financial loss to the Group and the <strong>Company</strong> due to failure to discharge an obligation by the<br />
counterparties and financial guarantees issued by the <strong>Company</strong> is arising from:<br />
(i)<br />
the carrying amount of the respective recognised financial assets as stated in the consolidated and <strong>Company</strong>’s statement<br />
of financial position; and<br />
(ii) the amount of contingent liabilities in relation to financial guarantee issued by the <strong>Company</strong> as disclosed in note 36 of the<br />
Notes to the Financial Statements section.<br />
For rents receivable from tenants, credit checks are part of the normal leasing process and stringent monitoring procedures are<br />
in place to deal with overdue debts. In addition, the Group reviews the recoverable amount of each individual trade debt at the<br />
end of the reporting period to ensure that adequate impairment losses are made for irrecoverable amounts.<br />
For derivative financial instruments, zero coupon convertible note, principal-protected investments, term notes, time deposits<br />
and bank balances, the Group and the <strong>Company</strong> only deal with financial institutions and invest in debt securities issued by<br />
issuers that have strong credit ratings to mitigate counterparty risk. In order to limit exposure to each financial institution and<br />
debt securities issuer, an exposure limit was set with each counterparty according to their credit rating with regular review by<br />
management.<br />
Credit exposure to financial institutions and debt securities issuers are monitored and reported regularly to the management.<br />
The exposure to each counterparty comprised (i) investment value of financial assets (including time deposits, principalprotected<br />
investments and term notes; (ii) net positive value of derivative financial instruments and zero coupon convertible<br />
note and; (iii) potential exposures to derivatives which are based on the remaining term and the notional amount of the<br />
derivative financial instruments. The table below provides a high level summary of the Group’s exposure to each counterparty at<br />
the end of the reporting period.<br />
<strong>2011</strong> 2010<br />
Number of<br />
Number of<br />
Category of counterparty counterparty Exposure counterparty Exposure<br />
HK$ million<br />
HK$ million<br />
Credit rating of AA- or above<br />
or note issuing banks 5 180 to 385 5 9 to 379<br />
Credit rating BBB- to A+ 23 1 to 295 13 10 to 297<br />
To minimise the credit risk of amounts due from subsidiaries and an associate, the management reviews the recoverable<br />
amount of each individual balance at the end of the reporting period to ensure adequate impairment losses are made for<br />
irrecoverable amounts. Other than concentration of credit risk on amount due from an associate, the Group and the <strong>Company</strong><br />
have no significant concentration of credit risk, with exposure spread over a number of counterparties and tenants.<br />
160 <strong>Hysan</strong> <strong>Annual</strong> <strong>Report</strong> <strong>2011</strong>
1. Financial Risk Management Objectives and Policies continued<br />
(b) Liquidity risk<br />
The Group and the <strong>Company</strong> closely monitor their liquidity requirements and the sufficiency of cash and available banking<br />
facilities so as to ensure that the payment obligations are met.<br />
Overview<br />
The following table details the remaining contractual maturity of the Group and the <strong>Company</strong> for their non-derivative financial<br />
liabilities based on the agreed repayment terms. The table has been drawn up based on the undiscounted cash flows of<br />
financial liabilities based on the earliest date on which the Group and the <strong>Company</strong> are required to pay. The table includes<br />
both interest and principal cash flows. The interest payments are computed using contractual rates or, if floating, based on the<br />
prevailing market rate at the end of the reporting period. For cash flows denominated in currency other than Hong Kong dollars<br />
(“HKD”), the prevailing foreign exchange rates at the end of the reporting period are used to convert the cash flows into HKD.<br />
The Group<br />
As at 31 December <strong>2011</strong><br />
More than More than<br />
Total 1 year 2 years<br />
contractual Within but not but not<br />
Carrying undiscounted 1 year or exceeding exceeding More than<br />
amount cash flow on demand 2 years 5 years 5 years<br />
HK$ million HK$ million HK$ million HK$ million HK$ million HK$ million<br />
Non-derivative financial liabilities<br />
Accounts payable and accruals (532) (532) (532) – – –<br />
Rental deposits from tenants (600) (600) (170) (167) (230) (33)<br />
Amounts due to non-controlling interests (327) (327) (327) – – –<br />
Unsecured bank loans (2,840) (2,956) (190) (739) (2,027) –<br />
Floating rate notes (200) (208) (3) (3) (202) –<br />
Fixed rate notes (3,309) (4,040) (1,482) (83) (623) (1,852)<br />
Zero coupon notes (314) (430) – – – (430)<br />
As at 31 December 2010<br />
(8,122) (9,093) (2,704) (992) (3,082) (2,315)<br />
Non-derivative financial liabilities<br />
Accounts payable and accruals (433) (433) (433) – – –<br />
Rental deposits from tenants (451) (451) (175) (100) (150) (26)<br />
Amounts due to non-controlling interests (327) (327) (327) – – –<br />
Unsecured bank loans (1,349) (1,374) (658) (8) (708) –<br />
Floating rate notes (200) (210) (3) (2) (205) –<br />
Fixed rate notes (2,750) (3,405) (155) (1,460) (577) (1,213)<br />
Zero coupon notes (288) (430) – – – (430)<br />
(5,798) (6,630) (1,751) (1,570) (1,640) (1,669)<br />
Strategy in Action Corporate Governance Financial Statements and Valuation<br />
<strong>Hysan</strong> <strong>Annual</strong> <strong>Report</strong> <strong>2011</strong><br />
161
Financial Risk Management continued<br />
For the year ended 31 December <strong>2011</strong><br />
1. Financial Risk Management Objectives and Policies continued<br />
(b) Liquidity risk continued<br />
The <strong>Company</strong><br />
As at 31 December <strong>2011</strong><br />
More than More than<br />
Total 1 year 2 years<br />
contractual Within but not but not<br />
Carrying undiscounted 1 year or exceeding exceeding More than<br />
amount cash flow on demand 2 years 5 years 5 years<br />
HK$ million HK$ million HK$ million HK$ million HK$ million HK$ million<br />
Non-derivative financial liabilities<br />
Other payable and accruals (36) (36) (36) – – –<br />
Amounts due to subsidiaries (480) (480) (480) – – –<br />
As at 31 December 2010<br />
(516) (516) (516) – – –<br />
Non-derivative financial liabilities<br />
Other payable and accruals (38) (38) (38) – – –<br />
Amounts due to subsidiaries (175) (175) (175) – – –<br />
(213) (213) (213) – – –<br />
The following table details the Group’s remaining contractual maturity for its derivative financial instruments. The table has been<br />
drawn up based on the undiscounted net cash inflows (outflows) on the derivative financial instruments that settle on a net<br />
basis and undiscounted gross inflows (outflows) on those derivatives that require gross settlement. When the amount payable<br />
or receivable is not fixed, the amount disclosed has been determined by the prevailing market rate at the end of the reporting<br />
period. For cash flows denominated in currency other than HKD, the prevailing foreign exchange rates at the end of the reporting<br />
period are used to convert the cash flows into HKD.<br />
The Group<br />
As at 31 December <strong>2011</strong><br />
More than More than<br />
Total 1 year 2 years<br />
contractual Within but not but not<br />
Carrying undiscounted 1 year or exceeding exceeding More than<br />
amount cash flow on demand 2 years 5 years 5 years<br />
HK$ million HK$ million HK$ million HK$ million HK$ million HK$ million<br />
Derivative settled net<br />
Interest rate swaps, basis swaps and asset swap 11 98 (13) 6 48 57<br />
Derivative settled gross<br />
Forward foreign exchange contracts (1)<br />
Outflow (646) (359) (210) (77) –<br />
Inflow 646 357 212 77 –<br />
Cross currency and net basis swaps (12)<br />
Outflow (1,883) (1,375) (205) (303) –<br />
Inflow 1,923 1,404 217 302 –<br />
162 <strong>Hysan</strong> <strong>Annual</strong> <strong>Report</strong> <strong>2011</strong>
1. Financial Risk Management Objectives and Policies continued<br />
(b) Liquidity risk continued<br />
More than More than<br />
Total 1 year 2 years<br />
contractual Within but not but not<br />
Carrying undiscounted 1 year or exceeding exceeding More than<br />
amount cash flow on demand 2 years 5 years 5 years<br />
HK$ million HK$ million HK$ million HK$ million HK$ million HK$ million<br />
Overview<br />
As at 31 December 2010<br />
Derivative settled net<br />
Interest rate swaps and basis swaps 3 114 3 (3) 41 73<br />
Derivative settled gross<br />
Forward foreign exchange contracts 1<br />
Outflow (171) (156) (15) – –<br />
Inflow 171 156 15 – –<br />
Cross currency and net basis swaps 36<br />
Outflow (1,805) (28) (1,374) (403) –<br />
Inflow 1,866 70 1,391 405 –<br />
At the end of the reporting period, the <strong>Company</strong> has no derivative financial instruments.<br />
(c) Interest rate risk<br />
The Group manages its interest rate exposure by assessing the potential impact on the Group’s financial position arising from<br />
any interest rate movements based on interest rate level and outlook. The management will review the proportion of borrowings<br />
in fixed rates and floating rates and ensure that they are within an appropriate range. Accordingly, the Group used (i) interest<br />
rate swaps to hedge the interest rate risk of the Group’s floating rate bank loans; and (ii) cross currency swaps and interest<br />
rate swaps to hedge the interest rate risk of certain amounts of the Group’s fixed rate notes. The Group reviews the continuing<br />
effectiveness of hedging instruments at least at the end of the reporting period and until the hedging instrument expires or is<br />
terminated or the hedge no longer meets the criteria for hedge accounting. The Group mainly used comparison of change in fair<br />
value of the hedging instruments and the hedged items attributable to the hedged risk for assessing the hedging effectiveness.<br />
As at 31 December <strong>2011</strong>, about 54.8% (2010: 53.6%) of the Group’s gross debts was effectively on a floating rate basis.<br />
The ratio could be adjusted according to views about changes in the interest rate trend going forward. In addition, the Group is<br />
exposed to (i) cash flow interest rate risk as the interest income derived from time deposits and bank balances is subject to<br />
interest rate changes; and (ii) fair value interest rate risk in relation to its fixed-rate debt securities. Other than the concentration<br />
of interest rate risk related to the movements in Hong Kong Interbank Offered Rate, the Group has no significant concentration<br />
of interest rate risk.<br />
Sensitivity analysis<br />
The sensitivity analysis below has been determined assuming that the change in interest rates had occurred at the end of the<br />
reporting period and had been applied to both derivative and non-derivative financial instruments that would have affected the<br />
profit or loss and equity. A change of +100 and -5 basis points (“bps”) (2010: +100 and -5 bps) was applied to the HKD and US<br />
dollars (“USD”) yield curves at the end of the reporting period. For the Australian dollars (“AUD”) yield curve, a change of +100<br />
and -100 bps (2010: nil) was applied. The applied change of bps represented management’s assessment of the reasonably<br />
possible change in interest rates based on the current market conditions. For the HKD and USD yield curve, the increase in<br />
positive change reflected potential interest rate increase in 2012 and the decrease in negative change is due to the low level<br />
of prevailing market interest rates at the end of the reporting period. For the AUD yield curve, the change reflected potential<br />
interest rate increase or decrease in 2012.<br />
In management’s opinion, the sensitivity analysis is unrepresentative of the interest rate risk as the year end exposure does not<br />
reflect the exposure during the year.<br />
Strategy in Action Corporate Governance Financial Statements and Valuation<br />
<strong>Hysan</strong> <strong>Annual</strong> <strong>Report</strong> <strong>2011</strong><br />
163
Financial Risk Management continued<br />
For the year ended 31 December <strong>2011</strong><br />
1. Financial Risk Management Objectives and Policies continued<br />
(c) Interest rate risk continued<br />
The Group<br />
Increase (decrease) in<br />
Increase (decrease) in<br />
profit or loss<br />
equity<br />
bps increase bps decrease bps increase bps decrease<br />
HK$ million HK$ million HK$ million HK$ million<br />
As at 31 December <strong>2011</strong> (6) – 18 –<br />
As at 31 December 2010 (13) 1 21 (1)<br />
(d) Currency risk<br />
The Group aims to minimise its currency risk and does not speculate in currency movements. The majority of the Group’s<br />
assets are located and all rental income are derived in Hong Kong, and denominated in HKD. At the end of the reporting period,<br />
the Group has the following monetary assets and monetary liabilities denominated in AUD, Renminbi (“RMB”) and USD.<br />
The Group<br />
<strong>2011</strong> 2010<br />
Total<br />
Total<br />
equivalent<br />
equivalent<br />
to<br />
to<br />
AUD million RMB million US$ million HK$ million US$ million HK$ million<br />
Assets<br />
Time deposits – 167 – 204 – –<br />
Principal-protected investments – – 39 300 30 233<br />
Term notes – 150 21 347 34 263<br />
– 317 60 851 64 496<br />
Liabilities<br />
Unsecured bank loans 37 – 26 490 51 399<br />
Fixed rate notes – – 174 1,357 174 1,356<br />
37 – 200 1,847 225 1,755<br />
At the end of the reporting period, all of the <strong>Company</strong>’s assets and liabilities were denominated in HKD.<br />
Other than concentration of currency risk of the above items denominated in AUD, RMB and USD, the Group and the <strong>Company</strong><br />
have no other significant currency risk.<br />
The Group has entered into appropriate hedging instruments, mentioned in note 23 of the Notes to the Financial Statements<br />
section, to hedge against part of the potential currency risk of the above items. The Group reviews the continuing effectiveness<br />
of hedging instruments at least at the end of the reporting period and until the hedging instrument expires or is terminated or<br />
the hedge no longer meets the criteria for hedge accounting.<br />
Sensitivity analysis<br />
The sensitivity analysis below has been determined assuming that a change in exchange rate had occurred at the end of the<br />
reporting period and had been applied to both derivative and non-derivative financial instruments that would have affected<br />
the profit or loss and equity. A change of 500 percentage in points (“pips”) (2010: 500 pips) was applied to the HKD:RMB<br />
and HKD:USD spot and forward rates while a change of 5,000 pips (2010: nil) was applied to the HKD:AUD spot and forward<br />
rates at the end of the reporting period. The applied change of pips represented management’s assessment of the reasonably<br />
possible change in foreign exchange rates.<br />
164 <strong>Hysan</strong> <strong>Annual</strong> <strong>Report</strong> <strong>2011</strong>
1. Financial Risk Management Objectives and Policies continued<br />
(d) Currency risk continued<br />
The Group<br />
Increase (decrease) in<br />
Increase (decrease) in<br />
profit or loss<br />
equity<br />
pips increase pips decrease pips increase pips decrease<br />
HK$ million HK$ million HK$ million HK$ million<br />
Overview<br />
As at 31 December <strong>2011</strong><br />
– AUD – – – –<br />
– RMB 8 (8) – –<br />
– USD (2) 2 1 (1)<br />
As at 31 December 2010<br />
– USD 3 (3) – –<br />
(e) Equity price risk<br />
The Group is exposed to equity price risks in relation to its equity investments and available-for-sale investments in listed<br />
securities which are measured at fair value at the end of the reporting period with reference to the listed share price. The<br />
management will monitor the price movements and takes appropriate actions when it is required.<br />
Sensitivity analysis<br />
The sensitivity analysis below has been determined assuming that a change in the corresponding equity prices had occurred<br />
at the end of the reporting period and had been applied to the investments that would have affected the equity. A change of<br />
25% (2010: 25%) in stock prices was applied at the end of the reporting period. The applied change of percentage represented<br />
management’s assessment of the reasonably possible change in stock prices.<br />
The Group<br />
Increase (decrease) in<br />
equity<br />
25% 25%<br />
increase decrease<br />
HK$ million HK$ million<br />
As at 31 December <strong>2011</strong> 247 (247)<br />
As at 31 December 2010 287 (287)<br />
Strategy in Action Corporate Governance Financial Statements and Valuation<br />
<strong>Hysan</strong> <strong>Annual</strong> <strong>Report</strong> <strong>2011</strong><br />
165
Financial Risk Management continued<br />
For the year ended 31 December <strong>2011</strong><br />
2. CATEGORIES OF FINANCIAL INSTRUMENTS<br />
The Group<br />
The <strong>Company</strong><br />
<strong>2011</strong> 2010 <strong>2011</strong> 2010<br />
HK$ million HK$ million HK$ million HK$ million<br />
Financial assets<br />
Fair value through profit or loss (“FVTPL”)<br />
– financial assets measured at FVTPL 702 – 2 –<br />
– designated as at FVTPL – 462 – –<br />
– held for trading – 38 – –<br />
Derivative instruments under hedge accounting 67 54 – –<br />
Fair value through other comprehensive income (“FVTOCI”) 989 – – –<br />
Held-to-maturity investments – 216 – –<br />
Available-for-sale financial assets – 1,152 – 2<br />
Amortised cost (including cash and cash equivalents) 3,447 – – –<br />
Loans and receivables (including<br />
cash and cash equivalents) – 2,356 11,710 13,256<br />
Financial liabilities<br />
5,205 4,278 11,712 13,258<br />
FVTPL<br />
– held for trading 12 4 – –<br />
Derivative instruments under hedge accounting 57 48 – –<br />
Amortised cost 7,522 5,347 516 213<br />
7,591 5,399 516 213<br />
3. FAIR VALUE<br />
The fair value of financial assets and financial liabilities are determined as follows:<br />
• the fair value of listed investments traded in active liquid markets are determined with reference to the published price<br />
quotations;<br />
• the fair value of financial assets and financial liabilities (excluding derivative instruments) are based on quoted prices from<br />
independent financial institutions or determined in accordance with generally accepted pricing models based on discounted<br />
cash flow analysis using prices from observable current market transactions; and<br />
• the fair value of derivative instruments are based on quoted prices from independent financial institutions or calculated<br />
using discounted cash flow analysis based on the applicable yield curve derived from quoted interest rates and based on<br />
the quoted spot and forward foreign exchange rates or calculated using an option pricing model based on quoted share<br />
prices, time to maturity, volatility and interest rates.<br />
The Directors consider that the carrying amounts of financial assets and financial liabilities measured at amortised costs in the<br />
consolidated and the <strong>Company</strong>’s financial statements approximate their fair values, except for the carrying amount of HK$3,309<br />
million (2010: HK$2,750 million) fixed rate notes as stated in note 30 of the Notes to the Financial Statements section with<br />
fair value of HK$3,484 million (2010: HK$2,787 million).<br />
166 <strong>Hysan</strong> <strong>Annual</strong> <strong>Report</strong> <strong>2011</strong>
3. FAIR VALUE continued<br />
The following table provides an analysis of financial instruments that are measured subsequent to initial recognition at fair<br />
value, grouped into Levels 1 to 3 based on the degree to which the fair value is observable.<br />
• Level 1: fair value measurements are those derived from quoted prices (unadjusted) in active market for identical assets.<br />
Overview<br />
• Level 2: fair value measurements are those derived from inputs other than quoted prices included with Level 1 that are<br />
observable for the asset or liability, either directly (i.e. as prices) or indirectly (i.e. derived from prices).<br />
• Level 3: fair value measurements are those derived from valuation techniques that include inputs for the asset or liability<br />
that are not based on observable market data (unobservable inputs).<br />
Financial assets<br />
<strong>2011</strong><br />
Level 1 Level 2 Level 3 Total<br />
HK$ million HK$ million HK$ million HK$ million<br />
Derivatives under hedge accounting<br />
Forward foreign exchange contracts – 1 – 1<br />
Interest rate swaps – 66 – 66<br />
Financial assets at FVTPL<br />
Principal-protected investments – 630 – 630<br />
Unlisted club debentures – 2 – 2<br />
Zero coupon convertible note 70 – – 70<br />
Financial assets at FVTOCI<br />
Listed equity securities 988 – – 988<br />
Unlisted equity securities (Note a) – – 1 1<br />
Total 1,058 699 1 1,758<br />
Financial liabilities<br />
Derivatives under hedge accounting<br />
Forward foreign exchange contracts – 2 – 2<br />
Cross currency swaps – 10 – 10<br />
Interest rate swaps – 45 – 45<br />
Other derivatives classified as held for trading<br />
(not under hedge accounting)<br />
Net basis swaps – 2 – 2<br />
Asset swap (Note b) – – 10 10<br />
Total – 59 10 69<br />
Notes:<br />
(a) The carrying amounts of the unlisted equity securities approximated their fair values of HK$3 million as at 1 January <strong>2011</strong>. During the<br />
year ended 31 December <strong>2011</strong>, net fair value losses of HK$2 million, which would have been recognised as impairment losses in profit<br />
or loss under Hong Kong Accounting Standard 39, have been recognised as other comprehensive expense. The fair value measurements<br />
of the Group’s unlisted equity securities are grouped into Level 3, which are derived from valuation techniques that include inputs for the<br />
assets that are not based on observable market data (unobservable inputs).<br />
(b) The Group newly entered an asset swap with notional amount of HK$60 million. During the year ended 31 December <strong>2011</strong>, the unrealised<br />
fair value loss of HK$10 million is included in other gains and losses.<br />
There were no transfers between Levels 1 and 2 for both years.<br />
Strategy in Action Corporate Governance Financial Statements and Valuation<br />
<strong>Hysan</strong> <strong>Annual</strong> <strong>Report</strong> <strong>2011</strong><br />
167
Financial Risk Management continued<br />
For the year ended 31 December <strong>2011</strong><br />
3. FAIR VALUE continued<br />
2010<br />
Level 1 Level 2 Total<br />
HK$ million HK$ million HK$ million<br />
Financial assets<br />
Derivatives under hedge accounting<br />
Forward foreign exchange contracts – 1 1<br />
Cross currency swaps – 2 2<br />
Interest rate swaps – 50 50<br />
Basis swaps – 1 1<br />
Other derivatives classified as held for trading<br />
(not under hedge accounting)<br />
Cross currency swaps – 38 38<br />
Financial assets designated as at FVTPL<br />
Principal-protected investments – 462 462<br />
Available-for-sale financial assets<br />
Listed equity securities 1,147 – 1,147<br />
Unlisted club debentures – 2 2<br />
Total 1,147 556 1,703<br />
Financial liabilities<br />
Derivatives under hedge accounting<br />
Interest rate swaps – 48 48<br />
Other derivatives classified as held for trading<br />
(not under hedge accounting)<br />
Net basis swaps – 4 4<br />
Total – 52 52<br />
There were no transfers between Levels 1 and 2 for both years.<br />
168 <strong>Hysan</strong> <strong>Annual</strong> <strong>Report</strong> <strong>2011</strong>
4. CAPITAL RISK MANAGEMENT<br />
The Group manages its capital to ensure that the Group will be able to continue as a going concern while maximising the return<br />
to stakeholders through the optimisation of the debt and equity balance. The Group’s overall strategy remains unchanged from<br />
prior year.<br />
Overview<br />
The Group monitors its capital structure on the basis of a net debt to equity ratio. For this purpose, the Group defines net debt<br />
as borrowings as shown in the consolidated statement of financial position less time deposits and cash and bank balances.<br />
The management reviews the Group’s net debt to equity ratio regularly and adjust the ratio through the payment of dividends,<br />
the issue of new share or debt, the repurchase of shares and the redemption of existing debt.<br />
The net debt to equity ratio at the year end was as follows:<br />
The Group<br />
<strong>2011</strong> 2010<br />
HK$ million HK$ million<br />
Unsecured bank loans 2,840 1,349<br />
Floating rate notes 200 200<br />
Fixed rate notes 3,309 2,750<br />
Zero coupon notes 314 288<br />
Borrowings 6,663 4,587<br />
Less: Time deposits (2,899) (1,930)<br />
Cash and bank balances (62) (63)<br />
Net debt 3,702 2,594<br />
Equity attributable to owners of the <strong>Company</strong> 48,753 40,677<br />
Net debt to equity 7.6% 6.4%<br />
Neither the <strong>Company</strong> nor any of its subsidiaries are subject to externally imposed capital requirements.<br />
Strategy in Action Corporate Governance Financial Statements and Valuation<br />
<strong>Hysan</strong> <strong>Annual</strong> <strong>Report</strong> <strong>2011</strong><br />
169
Five-Year Financial Summary<br />
For the year ended 31 December<br />
As restated As restated As restated<br />
<strong>2011</strong> 2010 2009 2008 2007<br />
HK$ million HK$ million HK$ million HK$ million HK$ million<br />
(Note) (Note) (Note)<br />
Results<br />
Turnover 1,922 1,764 1,680 1,638 1,368<br />
Property expenses (262) (250) (235) (217) (208)<br />
Gross profit 1,660 1,514 1,445 1,421 1,160<br />
Investment income 90 49 38 63 98<br />
Other gains and losses (34) (42) (3) 146 302<br />
Administrative expenses (173) (140) (133) (134) (106)<br />
Finance costs (122) (117) (131) (155) (175)<br />
Change in fair value of investment properties 7,532 2,594 1,249 (212) 3,131<br />
Share of results of associates 254 394 768 590 452<br />
Profit before taxation 9,207 4,252 3,233 1,719 4,862<br />
Taxation (217) (201) (189) (237) (205)<br />
Profit for the year 8,990 4,051 3,044 1,482 4,657<br />
Non-controlling interests (445) (207) (130) (118) (190)<br />
Profit attributable to owners of the <strong>Company</strong> 8,545 3,844 2,914 1,364 4,467<br />
Underlying profit for the year 1,310 1,148 1,113 1,201 1,158<br />
Recurring underlying profit for the year 1,310 1,148 1,110 1,066 950<br />
Dividends<br />
Dividends paid 791 714 709 644 549<br />
Dividends proposed 678 632 567 562 498<br />
Dividends per share (HK cents) 79.00 74.00 68.00 68.00 60.00<br />
Earnings per share (HK$), based on:<br />
Profit for the year<br />
– basic 8.08 3.65 2.79 1.31 4.24<br />
– diluted 8.08 3.65 2.79 1.31 4.24<br />
Underlying profit for the year – basic 1.24 1.09 1.06 1.16 1.10<br />
Recurring underlying profit for the year – basic 1.24 1.09 1.06 1.03 0.90<br />
Performance indicators<br />
Net debt to equity 7.6% 6.4% 5.1% 5.9% 6.8%<br />
Net interest coverage (times) 12.3x 14.0x 11.7x 10.2x 7.8x<br />
Net assets value per share (HK$) 46.00 38.61 35.42 33.44 33.94<br />
Net debt per share (HK$) 3.49 2.46 1.82 1.96 2.29<br />
Year end share price (HK$) 25.50 36.60 22.05 12.52 22.25<br />
170 <strong>Hysan</strong> <strong>Annual</strong> <strong>Report</strong> <strong>2011</strong>
At 31 December<br />
As restated As restated As restated<br />
<strong>2011</strong> 2010 2009 2008 2007<br />
HK$ million HK$ million HK$ million HK$ million HK$ million<br />
(Note) (Note) (Note)<br />
Assets and liabilities<br />
Investment properties 49,969 40,833 37,363 35,850 35,711<br />
Interests in associates 3,423 3,153 2,886 2,340 1,601<br />
Equity investments 989 – – – –<br />
Available-for-sale investments – 1,152 1,002 1,022 2,479<br />
Time deposits, cash and bank balances 2,961 1,993 1,984 1,015 484<br />
Other assets 2,026 1,423 807 1,493 789<br />
Total assets 59,368 48,554 44,042 41,720 41,064<br />
Borrowings (6,663) (4,587) (3,891) (3,751) (2,861)<br />
Taxation (433) (387) (342) (620) (565)<br />
Other liabilities (1,528) (1,263) (1,077) (1,076) (1,001)<br />
Total liabilities (8,624) (6,237) (5,310) (5,447) (4,427)<br />
Net assets 50,744 42,317 38,732 36,273 36,637<br />
Non-controlling interests (1,991) (1,640) (1,516) (1,462) (1,423)<br />
Shareholders’ funds 48,753 40,677 37,216 34,811 35,214<br />
Note:<br />
The figures for the years 2007 to 2009 have been restated to reflect the prior year adjustments arising from (i) reclassification of leasehold<br />
land that qualifies for finance lease from prepaid lease payments to property, plant and equipment in accordance with the amendments to HKAS<br />
17 “Leases”; and (ii) recognition of deferred taxation in respect of revalued investment properties that have been presumed to be recovered<br />
through sale in accordance with the amendments to HKAS 12 “Income Taxes”.<br />
Definitions:<br />
(1) Underlying profit for the year: profit adjusted for group’s share of unrealised fair value changes on investment properties<br />
(2) Recurring underlying profit for the year: underlying profit adjusted for items that are non-recurring in nature (such as gains or losses on<br />
disposal of long-term assets; impairment or its reversal; and tax provision for prior years)<br />
(3) Net debt to equity: borrowings less short-term investments, time deposits, cash and bank balances divided by shareholders’ funds<br />
(4) Net interest coverage: gross profit less administrative expenses before depreciation divided by net interest expenses<br />
(5) Net assets value per share: shareholders’ funds divided by number of issued shares at year end<br />
(6) Net debt per share: borrowings less short-term investments, time deposits and cash and bank balances divided by number of issued<br />
shares at year end<br />
Overview<br />
Strategy in Action Corporate Governance Financial Statements and Valuation<br />
<strong>Hysan</strong> <strong>Annual</strong> <strong>Report</strong> <strong>2011</strong><br />
171
<strong>Report</strong> of the Valuer<br />
To the Board of Directors<br />
<strong>Hysan</strong> <strong>Development</strong> <strong>Company</strong> <strong>Limited</strong><br />
Dear Sirs,<br />
<strong>Annual</strong> Revaluation of Investment Properties as at 31 December <strong>2011</strong><br />
In accordance with your appointment of Knight Frank Petty <strong>Limited</strong> to value the investment properties in Hong Kong owned by<br />
<strong>Hysan</strong> <strong>Development</strong> <strong>Company</strong> <strong>Limited</strong> and its subsidiaries, we are pleased to advise that the market value of the investment<br />
properties as at 31 December <strong>2011</strong> was in the approximate sum of Hong Kong Dollars Forty Nine Billion Nine Hundred and<br />
Sixty Nine Million Only (i.e. HK$49,969 million).<br />
The investment properties have been valued individually, on market value basis, by reference to comparable market transactions<br />
and on the basis of capitalisation of the net income with due allowance for the reversionary income and redevelopment<br />
potential, without allowances for any expenses or taxation which may be incurred in effecting a sale.<br />
For the investment properties under redevelopment, residual method of valuation was adopted. The valuation was mainly arrived<br />
at by reference to sales or rental evidences as available on the market to determine the value of the proposed development<br />
as if it were completed as at the date of valuation. All the costs of the development, namely the cost of construction, cost of<br />
finance, professional fees, marketing costs and an allowance of the profit required for the development were then deducted<br />
from the completion value of the proposed development to derive the market value of the property as at the date of valuation.<br />
Yours faithfully,<br />
Knight Frank Petty <strong>Limited</strong><br />
Hong Kong, 13 February 2012<br />
172 <strong>Hysan</strong> <strong>Annual</strong> <strong>Report</strong> <strong>2011</strong>
Schedule of Principal Properties<br />
At 31 December <strong>2011</strong><br />
Investment Properties<br />
Percentage<br />
Category held by<br />
Address Lot No. Use of the Lease the Group<br />
1. The Lee Gardens Sec. DD of I.L. 29, Sec. L of I.L. 457, Commercial Long lease 100%<br />
33 <strong>Hysan</strong> Avenue Sec. MM of I.L. 29,<br />
Causeway Bay the R.P. of Sec. L of I.L. 29,<br />
Hong Kong and the R.P. of I.L. 457<br />
2. Bamboo Grove I.L. 8624 Residential Medium term 100%<br />
74-86 Kennedy Road lease<br />
Mid-Levels<br />
Hong Kong<br />
3. Lee Gardens Two Sec. G of I.L. 29, Commercial Long lease 65.36%<br />
28 Yun Ping Road Sec. A, O, F and H of I.L. 457,<br />
Causeway Bay the R.P. of Sec. C, D, E and G of I.L. 457,<br />
Hong Kong Subsec. 1 of Sec. C, D, E and G of I.L. 457,<br />
Subsec. 2 of Sec. E of I.L. 457 and<br />
Subsec. 1, 2, 3 and<br />
the R.P. of Sec. C of I.L. 461<br />
4. Leighton Centre Sec. B, C and the R.P. of I.L. 1451 Commercial Long lease 100%<br />
77 Leighton Road<br />
Causeway Bay<br />
Hong Kong<br />
5. Lee Theatre Plaza I.L. 1452, the R.P. of I.L. 472 and 476 Commercial Long lease 100%<br />
99 Percival Street<br />
Causeway Bay<br />
Hong Kong<br />
6. Sunning Plaza The R.P. of Subsec. 1 of Sec. J of I.L. 29, Commercial Long lease 100%<br />
10 <strong>Hysan</strong> Avenue Subsec. 2 of Sec. J of I.L. 29<br />
Causeway Bay and the R.P. of Sec. J of I.L. 29<br />
Hong Kong<br />
7. Sunning Court The R.P. of Subsec. 1 of Sec. J of I.L. 29, Residential Long lease 100%<br />
8 Hoi Ping Road Subsec. 2 of Sec. J of I.L. 29<br />
Causeway Bay and the R.P. of Sec. J of I.L. 29<br />
Hong Kong<br />
8. One <strong>Hysan</strong> Avenue The R.P. of Sec. GG of I.L. 29 Commercial Long lease 100%<br />
1 <strong>Hysan</strong> Avenue<br />
Causeway Bay<br />
Hong Kong<br />
9. 18 <strong>Hysan</strong> Avenue Sec. N of I.L. 457 and Sec. LL of I.L. 29 Commercial Long lease 100%<br />
18 <strong>Hysan</strong> Avenue<br />
Causeway Bay<br />
Hong Kong<br />
Overview<br />
Strategy in Action Corporate Governance Financial Statements and Valuation<br />
<strong>Hysan</strong> <strong>Annual</strong> <strong>Report</strong> <strong>2011</strong><br />
173
Schedule of Principal Properties continued<br />
At 31 December <strong>2011</strong><br />
Investment Properties continued<br />
Percentage<br />
Category held by<br />
Address Lot No. Use of the Lease the Group<br />
10. 111 Leighton Road Sec. KK of I.L. 29 Commercial Long lease 100%<br />
111 Leighton Road<br />
Causeway Bay<br />
Hong Kong<br />
11. <strong>Hysan</strong> Place* Sec. FF of I.L. 29 and Commercial Long lease 100%<br />
500 Hennessy Road the R.P. of Marine Lot 365<br />
Causeway Bay<br />
Hong Kong<br />
* The property (the site of the former Hennessy Centre) is currently under redevelopment. The site has a registered site area of<br />
approximately 47,738 square feet. The redevelopment has a projected gross floor area of around 710,000 square feet and is expected to<br />
be open in August 2012.<br />
174 <strong>Hysan</strong> <strong>Annual</strong> <strong>Report</strong> <strong>2011</strong>
Shareholding Analysis<br />
Share Capital<br />
At 31 December <strong>2011</strong><br />
HK$<br />
Number of<br />
Ordinary Shares<br />
Nominal Value<br />
HK$<br />
Overview<br />
Authorised share capital 7,250,000,000 1,450,000,000 5<br />
Issued and fully paid-up capital 5,298,772,075 1,059,754,415 5<br />
There was one class of ordinary shares of HK$5 each with equal voting rights.<br />
Distribution of Shareholdings<br />
(At 31 December <strong>2011</strong>, as per register of members of the <strong>Company</strong>)<br />
Size of registered Number of % of Number of % of the issued<br />
shareholdings shareholders shareholders ordinary shares share capital<br />
(Note)<br />
5,000 or below 2443 68.91 4,411,652 0.42<br />
5,001 – 50,000 933 26.32 14,438,895 1.36<br />
50,001 – 100,000 86 2.43 6,600,037 0.62<br />
100,001 – 500,000 61 1.72 12,119,908 1.14<br />
500,001 – 1,000,000 4 0.11 2,350,306 0.22<br />
Above 1,000,000 18 0.51 1,019,833,617 96.24<br />
Total 3,545 100.00 1,059,754,415 100.00<br />
Types of Shareholders<br />
(At 31 December <strong>2011</strong>, as per register of members of the <strong>Company</strong>)<br />
Number of % of the issued<br />
Type of shareholders ordinary shares held share capital<br />
(Note)<br />
Lee <strong>Hysan</strong> <strong>Company</strong> <strong>Limited</strong>, Lee <strong>Hysan</strong> Estate <strong>Company</strong>, <strong>Limited</strong> and their subsidiaries 433,130,735 40.87<br />
Other corporate shareholders 584,214,190 55.13<br />
Individual shareholders 42,409,490 4.00<br />
Total 1,059,754,415 100.00<br />
Location of Shareholders<br />
(At 31 December <strong>2011</strong>, as per register of members of the <strong>Company</strong>)<br />
Number of % of the issued<br />
Location of shareholders ordinary shares held share capital<br />
(Note)<br />
Hong Kong 1,052,116,459 99.28<br />
United States and Canada 4,293,261 0.41<br />
United Kingdom 3,103,966 0.29<br />
Others 240,729 0.02<br />
Total 1,059,754,415 100.00<br />
Note:<br />
The percentages have been compiled based on the total number of shares of the <strong>Company</strong> in issue as at 31 December <strong>2011</strong><br />
(i.e. 1,059,754,415 ordinary shares).<br />
Strategy in Action Corporate Governance Financial Statements and Valuation<br />
<strong>Hysan</strong> <strong>Annual</strong> <strong>Report</strong> <strong>2011</strong><br />
175
Shareholder Information<br />
Financial Calendar<br />
Full year results announced 8 March 2012<br />
Closure of register of members for <strong>Annual</strong> General Meeting 11 to 14 May 2012<br />
<strong>Annual</strong> General Meeting 14 May 2012<br />
Ex-dividend date for final dividend 16 May 2012<br />
Closure of register of members and record date for final dividend 18 May 2012<br />
Dispatch of scrip dividend circular and election form (on or about) 24 May 2012<br />
Dispatch of final dividend warrants/definitive share certificates (on or about) 14 June 2012<br />
2012 interim results to be announced 7 August 2012*<br />
* subject to change<br />
Dividend<br />
The Board recommends the payment of a final dividend of<br />
HK64 cents per share. Subject to shareholder approval, the<br />
final dividend will be payable in cash with a scrip dividend<br />
alternative to shareholders on the register of members as<br />
at Friday, 18 May 2012. The scrip dividend alternative is<br />
conditional upon the granting by the Listing Committee of<br />
The Stock Exchange of Hong Kong <strong>Limited</strong> of the listing<br />
of and permission to deal in the new shares to be issued<br />
pursuant thereto.<br />
The register of members will be closed from Friday, 11 May<br />
2012 to Monday, 14 May 2012, both dates inclusive, for<br />
the purpose of determining shareholders’ entitlement to<br />
attend and vote at the <strong>Annual</strong> General Meeting to be held<br />
on 14 May 2012, during which period no transfer of shares<br />
will be registered. In order to qualify for attending and voting<br />
at the <strong>Annual</strong> General Meeting, all transfer documents<br />
accompanied by the relevant share certificates must be<br />
lodged with the <strong>Company</strong>’s Registrars not later than 4:00 p.m.<br />
on Thursday, 10 May 2012.<br />
The register of members will also be closed on Friday,<br />
18 May 2012, for the purpose of determining shareholders’<br />
entitlement to the proposed final dividend, during which<br />
period no transfer of shares will be registered. In order to<br />
qualify for the proposed final dividend, all transfer documents<br />
accompanied by the relevant share certificates must be<br />
lodged with the <strong>Company</strong>’s Registrars not later than 4:00 p.m.<br />
on Thursday, 17 May 2012.<br />
A circular containing details of the scrip dividend and the<br />
form of election will be mailed to shareholders on or about<br />
Thursday, 24 May 2012. Shareholders who elect for the scrip<br />
dividend, in lieu of the cash dividend, in whole or in part,<br />
shall return the form of election to the <strong>Company</strong>’s Registrars<br />
on or before Friday, 8 June 2012.<br />
Definitive share certificates in respect of the scrip dividend<br />
and cheques (for those shareholders who do not elect for<br />
scrip dividend) will be dispatched to shareholders on or<br />
about Thursday, 14 June 2012.<br />
Share Listing<br />
<strong>Hysan</strong>’s shares are listed on The Stock Exchange of Hong<br />
Kong <strong>Limited</strong>. It has a sponsored American Depositary<br />
Receipts (ADR) Programme in the New York market.<br />
Stock Code<br />
The Stock Exchange of Hong Kong <strong>Limited</strong>: 00014<br />
Bloomberg: 14HK<br />
Reuters: 0014.HK<br />
Ticket Symbol for ADR Code: HYSNY<br />
CUSIP reference number: 449162304<br />
176 <strong>Hysan</strong> <strong>Annual</strong> <strong>Report</strong> <strong>2011</strong><br />
Shareholder Services<br />
For enquiries about share transfer and registration, please<br />
contact the <strong>Company</strong>’s Registrars:<br />
Tricor Standard <strong>Limited</strong><br />
26/F., Tesbury Centre,<br />
28 Queen’s Road East,<br />
Wanchai, Hong Kong<br />
Telephone: (852) 2980 1768<br />
Facsimile: (852) 2861 1465<br />
Holders of the <strong>Company</strong>’s ordinary shares should notify the<br />
Registrars promptly of any change of their address.<br />
The <strong>Annual</strong> <strong>Report</strong> is printed in English and Chinese<br />
language and is available on our website at www.hysan.com.hk.<br />
Shareholders may at any time choose to receive the <strong>Annual</strong><br />
<strong>Report</strong> in printed form in either the English or Chinese<br />
language or both or by electronic means. Shareholders who<br />
have chosen to receive the <strong>Annual</strong> <strong>Report</strong> using electronic<br />
means and who for any reason have difficulty in receiving<br />
or gaining access to the <strong>Annual</strong> <strong>Report</strong> will promptly upon<br />
request be sent a printed copy free of charge.<br />
Shareholders may at any time change their choice of the<br />
language or means of receipt of the <strong>Annual</strong> <strong>Report</strong> by notice<br />
in writing to the <strong>Company</strong>’s Registrars at the address above.<br />
The Change Request Form may be downloaded from the<br />
<strong>Company</strong>’s website at www.hysan.com.hk.<br />
Investor Relations<br />
For enquiries relating to investor relations, please email to<br />
investor@hysan.com.hk or write to the <strong>Company</strong> at:<br />
Investor Relations<br />
<strong>Hysan</strong> <strong>Development</strong> <strong>Company</strong> <strong>Limited</strong><br />
49/F. (Reception: 50/F.), The Lee Gardens<br />
33 <strong>Hysan</strong> Avenue<br />
Hong Kong<br />
Telephone: (852) 2895 5777<br />
Facsimile: (852) 2577 5153<br />
Our Website<br />
Press releases and other information of the Group can be<br />
found at our internet website: www.hysan.com.hk.<br />
Cover and theme page photography: Michael Cheung
It is not just our quality assets<br />
that make <strong>Hysan</strong> special.<br />
It is the team behind.<br />
<strong>Hysan</strong> employees participate in a dragon dance<br />
team-building exercise on the <strong>Company</strong> Day 2012 with<br />
the theme “Together We Can Take the Lead”. A strongly<br />
committed team gears up for the <strong>Hysan</strong> Place opening.
<strong>Hysan</strong> <strong>Development</strong> <strong>Company</strong> <strong>Limited</strong><br />
49/F The Lee Gardens<br />
33 <strong>Hysan</strong> Avenue, Hong Kong<br />
T 852 2895 5777 F 852 2577 5153<br />
www.hysan.com.hk