YAMAHA CORPORATION ANNUAL REPORT 2000
YAMAHA CORPORATION ANNUAL REPORT 2000
YAMAHA CORPORATION ANNUAL REPORT 2000

Create successful ePaper yourself
Turn your PDF publications into a flip-book with our unique Google optimized e-Paper software.
NOTES TO CONSOLIDATED FINANCIAL STATEMENTS<br />
27<br />
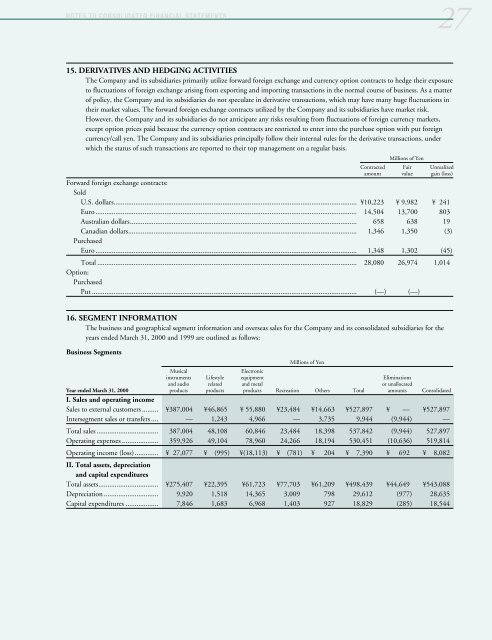
15. DERIVATIVES AND HEDGING ACTIVITIES<br />
The Company and its subsidiaries primarily utilize forward foreign exchange and currency option contracts to hedge their exposure<br />
to fluctuations of foreign exchange arising from exporting and importing transactions in the normal course of business. As a matter<br />
of policy, the Company and its subsidiaries do not speculate in derivative transactions, which may have many huge fluctuations in<br />
their market values. The forward foreign exchange contracts utilized by the Company and its subsidiaries have market risk.<br />
However, the Company and its subsidiaries do not anticipate any risks resulting from fluctuations of foreign currency markets,<br />
except option prices paid because the currency option contracts are restricted to enter into the purchase option with put foreign<br />
currency/call yen. The Company and its subsidiaries principally follow their internal rules for the derivative transactions, under<br />
which the status of such transactions are reported to their top management on a regular basis.<br />
Millions of Yen<br />
Contracted Fair Unrealized<br />
amount value gain (loss)<br />
Forward foreign exchange contracts:<br />
Sold<br />
U.S. dollars...................................................................................................................................... ¥10,223 ¥ 9,982 ¥ 241<br />
Euro ................................................................................................................................................ 14,504 13,700 803<br />
Australian dollars............................................................................................................................. 658 638 19<br />
Canadian dollars..............................................................................................................................<br />
Purchased<br />
1,346 1,350 (3)<br />
Euro ................................................................................................................................................ 1,348 1,302 (45)<br />
Total ...............................................................................................................................................<br />
Option:<br />
Purchased<br />
28,080 26,974 1,014<br />
Put .................................................................................................................................................. (—) (—)<br />
16. SEGMENT INFORMATION<br />
The business and geographical segment information and overseas sales for the Company and its consolidated subsidiaries for the<br />
years ended March 31, <strong>2000</strong> and 1999 are outlined as follows:<br />
Business Segments<br />
Millions of Yen<br />
Musical Electronic<br />
instruments Lifestyle equipment Eliminations<br />
and audio related and metal or unallocated<br />
Year ended March 31, <strong>2000</strong><br />
I. Sales and operating income<br />
products products products Recreation Others Total amounts Consolidated<br />
Sales to external customers ......... ¥387,004 ¥46,865 ¥ 55,880 ¥23,484 ¥14,663 ¥527,897 ¥ — ¥527,897<br />
Intersegment sales or transfers .... — 1,243 4,966 — 3,735 9,944 (9,944) —<br />
Total sales .................................. 387,004 48,108 60,846 23,484 18,398 537,842 (9,944) 527,897<br />
Operating expenses .................... 359,926 49,104 78,960 24,266 18,194 530,451 (10,636) 519,814<br />
Operating income (loss).............<br />
II. Total assets, depreciation<br />
and capital expenditures<br />
¥ 27,077 ¥ (995) ¥(18,113) ¥ (781) ¥ 204 ¥ 7,390 ¥ 692 ¥ 8,082<br />
Total assets................................. ¥275,407 ¥22,395 ¥61,723 ¥77,703 ¥61,209 ¥498,439 ¥44,649 ¥543,088<br />
Depreciation .............................. 9,920 1,518 14,365 3,009 798 29,612 (977) 28,635<br />
Capital expenditures .................. 7,846 1,683 6,968 1,403 927 18,829 (285) 18,544