WAY UPWARDS - HSE
WAY UPWARDS - HSE
WAY UPWARDS - HSE

You also want an ePaper? Increase the reach of your titles
YUMPU automatically turns print PDFs into web optimized ePapers that Google loves.
82 Annual Report 2011<br />
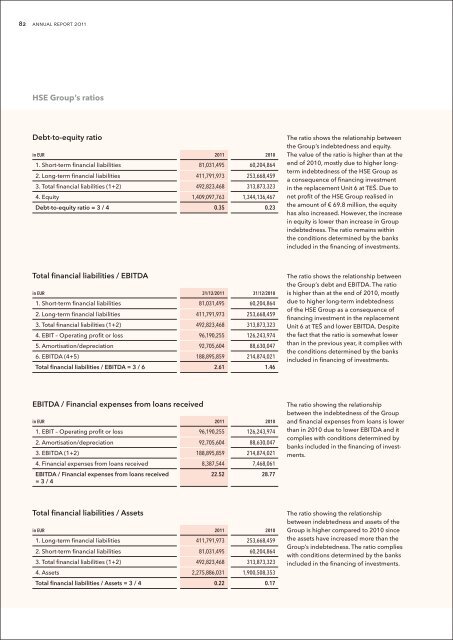
<strong>HSE</strong> Group’s ratios<br />
Debt-to-equity ratio<br />
in EUR 2011 2010<br />
1. Short-term financial liabilities 81,031,495 60,204,864<br />
2. Long-term financial liabilities 411,791,973 253,668,459<br />
3. Total financial liabilities (1+2) 492,823,468 313,873,323<br />
4. Equity 1,409,097,763 1,344,136,467<br />
Debt-to-equity ratio = 3 / 4 0.35 0.23<br />
The ratio shows the relationship between<br />
the Group’s indebtedness and equity.<br />
The value of the ratio is higher than at the<br />
end of 2010, mostly due to higher longterm<br />
indebtedness of the <strong>HSE</strong> Group as<br />
a consequence of financing investment<br />
in the replacement Unit 6 at TEŠ. Due to<br />
net profit of the <strong>HSE</strong> Group realised in<br />
the amount of € 69.8 million, the equity<br />
has also increased. However, the increase<br />
in equity is lower than increase in Group<br />
indebtedness. The ratio remains within<br />
the conditions determined by the banks<br />
included in the financing of investments.<br />
Total financial liabilities / EBITDA<br />
in EUR 31/12/2011 31/12/2010<br />
1. Short-term financial liabilities 81,031,495 60,204,864<br />
2. Long-term financial liabilities 411,791,973 253,668,459<br />
3. Total financial liabilities (1+2) 492,823,468 313,873,323<br />
4. EBIT – Operating profit or loss 96,190,255 126,243,974<br />
5. Amortisation/depreciation 92,705,604 88,630,047<br />
6. EBITDA (4+5) 188,895,859 214,874,021<br />
Total financial liabilities / EBITDA = 3 / 6 2.61 1.46<br />
The ratio shows the relationship between<br />
the Group’s debt and EBITDA. The ratio<br />
is higher than at the end of 2010, mostly<br />
due to higher long-term indebtedness<br />
of the <strong>HSE</strong> Group as a consequence of<br />
financing investment in the replacement<br />
Unit 6 at TEŠ and lower EBITDA. Despite<br />
the fact that the ratio is somewhat lower<br />
than in the previous year, it complies with<br />
the conditions determined by the banks<br />
included in financing of investments.<br />
EBITDA / Financial expenses from loans received<br />
in EUR 2011 2010<br />
1. EBIT – Operating profit or loss 96,190,255 126,243,974<br />
2. Amortisation/depreciation 92,705,604 88,630,047<br />
3. EBITDA (1+2) 188,895,859 214,874,021<br />
4. Financial expenses from loans received 8,387,544 7,468,061<br />
EBITDA / Financial expenses from loans received<br />
= 3 / 4<br />
22.52 28.77<br />
The ratio showing the relationship<br />
between the indebtedness of the Group<br />
and financial expenses from loans is lower<br />
than in 2010 due to lower EBITDA and it<br />
complies with conditions determined by<br />
banks included in the financing of investments.<br />
Total financial liabilities / Assets<br />
in EUR 2011 2010<br />
1. Long-term financial liabilities 411,791,973 253,668,459<br />
2. Short-term financial liabilities 81,031,495 60,204,864<br />
3. Total financial liabilities (1+2) 492,823,468 313,873,323<br />
4. Assets 2,275,886,031 1,900,508,353<br />
Total financial liabilities / Assets = 3 / 4 0.22 0.17<br />
The ratio showing the relationship<br />
between indebtedness and assets of the<br />
Group is higher compared to 2010 since<br />
the assets have increased more than the<br />
Group’s indebtedness. The ratio complies<br />
with conditions determined by the banks<br />
included in the financing of investments.