Digital Climatic Atlas of Texas - Texas Water Development Board
Digital Climatic Atlas of Texas - Texas Water Development Board
Digital Climatic Atlas of Texas - Texas Water Development Board

Create successful ePaper yourself
Turn your PDF publications into a flip-book with our unique Google optimized e-Paper software.
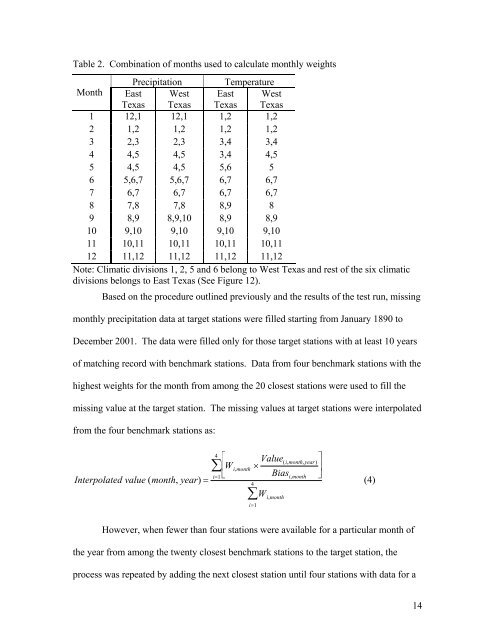
Table 2. Combination <strong>of</strong> months used to calculate monthly weights<br />
Precipitation Temperature<br />
Month East<br />
<strong>Texas</strong><br />
West<br />
<strong>Texas</strong><br />
East<br />
<strong>Texas</strong><br />
West<br />
<strong>Texas</strong><br />
1 12,1 12,1 1,2 1,2<br />
2 1,2 1,2 1,2 1,2<br />
3 2,3 2,3 3,4 3,4<br />
4 4,5 4,5 3,4 4,5<br />
5 4,5 4,5 5,6 5<br />
6 5,6,7 5,6,7 6,7 6,7<br />
7 6,7 6,7 6,7 6,7<br />
8 7,8 7,8 8,9 8<br />
9 8,9 8,9,10 8,9 8,9<br />
10 9,10 9,10 9,10 9,10<br />
11 10,11 10,11 10,11 10,11<br />
12 11,12 11,12 11,12 11,12<br />
Note: <strong>Climatic</strong> divisions 1, 2, 5 and 6 belong to West <strong>Texas</strong> and rest <strong>of</strong> the six climatic<br />
divisions belongs to East <strong>Texas</strong> (See Figure 12).<br />
Based on the procedure outlined previously and the results <strong>of</strong> the test run, missing<br />
monthly precipitation data at target stations were filled starting from January 1890 to<br />
December 2001. The data were filled only for those target stations with at least 10 years<br />
<strong>of</strong> matching record with benchmark stations. Data from four benchmark stations with the<br />
highest weights for the month from among the 20 closest stations were used to fill the<br />
missing value at the target station. The missing values at target stations were interpolated<br />
from the four benchmark stations as:<br />
Interpolated value (month, year) =<br />
4<br />
∑<br />
i=1<br />
⎡<br />
W i,month<br />
× Value ⎤<br />
(i,month,year)<br />
⎢<br />
⎥<br />
⎣<br />
⎦<br />
4<br />
∑<br />
i=1<br />
W i,month<br />
Bias i,month<br />
(4)<br />
However, when fewer than four stations were available for a particular month <strong>of</strong><br />
the year from among the twenty closest benchmark stations to the target station, the<br />
process was repeated by adding the next closest station until four stations with data for a<br />
14