Poverty and Sanitation in Honduras (WSP) - The Water, Sanitation ...
Poverty and Sanitation in Honduras (WSP) - The Water, Sanitation ...
Poverty and Sanitation in Honduras (WSP) - The Water, Sanitation ...

You also want an ePaper? Increase the reach of your titles
YUMPU automatically turns print PDFs into web optimized ePapers that Google loves.
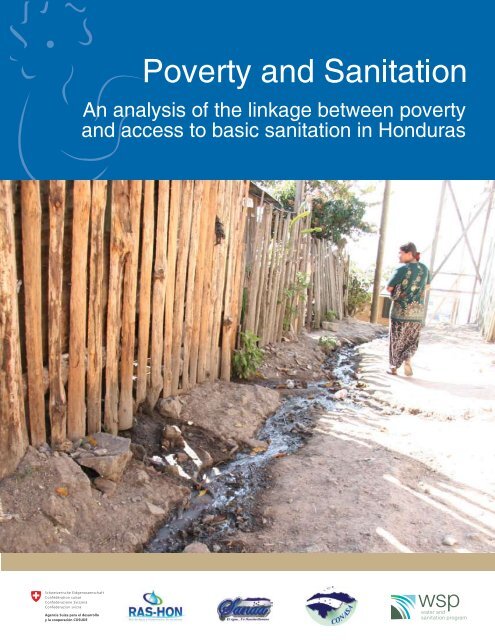
<strong>Poverty</strong> <strong>and</strong> <strong>Sanitation</strong><br />
An analysis of the l<strong>in</strong>kage between poverty<br />
<strong>and</strong> access to basic sanitation <strong>in</strong> <strong>Honduras</strong>
Tegucigalpa, January 2008<br />
<strong>WSP</strong> Mission<br />
<strong>The</strong> <strong>Water</strong> <strong>and</strong> <strong>Sanitation</strong> Program (<strong>WSP</strong>) is an<br />
<strong>in</strong>ternational partnership to help the poor ga<strong>in</strong> susta<strong>in</strong>ed<br />
access to improved water supply <strong>and</strong> sanitation services.<br />
Donors <strong>and</strong> Partners<br />
<strong>The</strong> governments of Australia, Austria, Belgium, Canada,<br />
Denmark, United States of America, France, Holl<strong>and</strong>,<br />
Irel<strong>and</strong>, Luxembourg, Norway, United K<strong>in</strong>gdom, Sweden,<br />
<strong>and</strong> Switzerl<strong>and</strong>; United Nations Development Program,<br />
World Bank, <strong>and</strong> the Bill <strong>and</strong> Mel<strong>in</strong>da Gates Foundation<br />
Acknowledgements<br />
This publication has been made possible thanks to<br />
support from the follow<strong>in</strong>g people <strong>and</strong> organizations:<br />
Technical Secretary of the National <strong>Water</strong> <strong>and</strong><br />
<strong>Sanitation</strong> Council (CONASA) <strong>and</strong> National<br />
Autonomous <strong>Water</strong> <strong>and</strong> Sewerage Service (SANAA)<br />
Jorge Mendez, Executive Director of CONASA <strong>and</strong><br />
General Manager of SANAA<br />
Rodolfo Ochoa, Director of the Investigation <strong>and</strong> Technical<br />
Assistance Division of SANAA<br />
Luis Romero, SANAA Development Division Supervisor<br />
<strong>Water</strong> <strong>and</strong> <strong>Sanitation</strong> Services Regulatory<br />
Entity (ERSAPS)<br />
Ramón Cuellar, General Director<br />
Luis Moncada Gross, Director<br />
<strong>Water</strong> <strong>and</strong> <strong>Sanitation</strong> Network of <strong>Honduras</strong> (RAS-HON)<br />
Jorge Mendez, President<br />
Ligia Mir<strong>and</strong>a, Secretary General<br />
<strong>Water</strong> <strong>and</strong> <strong>Sanitation</strong> Program – Lat<strong>in</strong> America <strong>and</strong> the<br />
Caribbean (<strong>WSP</strong>-LAC)<br />
François Brikké, Regional Director<br />
Rafael Vera, Central America Coord<strong>in</strong>ator<br />
Peer reviewers: Nelson Med<strong>in</strong>a, Mart<strong>in</strong> Gauss, Marco<br />
Quiroga, Simon Zb<strong>in</strong>den <strong>and</strong> Oscar Castillo<br />
Study prepared by: Ricardo Mairena, Consultant<br />
Translator: Krist<strong>in</strong> Keanan<br />
Peer review <strong>and</strong> edit<strong>in</strong>g of English version:<br />
Anthony P. Br<strong>and</strong><br />
Edit<strong>in</strong>g <strong>and</strong> Production Supervision: Beatriz Schippner<br />
<strong>and</strong> Lylliam Moya<br />
Photography: Jaime Rojas<br />
Design <strong>and</strong> pr<strong>in</strong>t<strong>in</strong>g: xmedia Impresos<br />
<strong>The</strong> results, <strong>in</strong>terpretations <strong>and</strong> conclusions expressed are<br />
exclusively the author’s <strong>and</strong> should not be attributed to the<br />
World Bank, its organizations or members of the Executive<br />
Board of Directors or the companies they represent.<br />
All rights reserved
a<br />
Contents<br />
Pag.<br />
Presentation ............................................................................................... 1<br />
1<br />
2<br />
3<br />
4<br />
5<br />
6<br />
7<br />
8<br />
9<br />
Executive summary .....................................................................................<br />
Introduction .................................................................................................<br />
Access to sanitation <strong>and</strong> the situation at the national level .........................<br />
Rural sanitation ............................................................................................<br />
Urban sanitation ..........................................................................................<br />
Considerations for an urban sanitation strategy ........................................<br />
Considerations for a rural sanitation strategy ...........................................<br />
Investment, f<strong>in</strong>anc<strong>in</strong>g <strong>and</strong> subsidies for sanitation .....................................<br />
Monitor<strong>in</strong>g <strong>and</strong> <strong>in</strong>stitutional support for susta<strong>in</strong>able sanitation<br />
services ........................................................................................................<br />
Conclusions <strong>and</strong> recommendations .............................................................<br />
2<br />
3<br />
5<br />
10<br />
13<br />
17<br />
22<br />
28<br />
30<br />
31<br />
Bibliography<br />
..................................................................................................<br />
32
Presentation<br />
<strong>The</strong> struggle to elim<strong>in</strong>ate poverty is an ongo<strong>in</strong>g challenge for governments <strong>and</strong> <strong>in</strong>ternational agencies<br />
worldwide. In Lat<strong>in</strong> America, even though access to sanitation has improved <strong>in</strong> recent decades, much<br />
rema<strong>in</strong>s to be done. In 2004, some 125 million people, correspond<strong>in</strong>g to 14% of the urban <strong>and</strong> 51% of<br />
rural dwellers, lacked access to improved sanitation systems. This not only adversely affects the health<br />
of the poorest, most vulnerable segment of the population; it also translates <strong>in</strong>to economic losses,<br />
environmental damage <strong>and</strong> degradation of the quantity <strong>and</strong> quality of water resources, perpetuat<strong>in</strong>g a<br />
viscous circle of poverty <strong>and</strong> bad resource management.<br />
To create global awareness of the sanitation crisis <strong>and</strong> the achievement of the sanitation targets of the<br />
Millennium Development Goals (MDGs), the United Nations has declared 2008 the International Year<br />
of <strong>Sanitation</strong>. Important political <strong>and</strong> technical events have been organized throughout the region to<br />
discuss sanitation <strong>and</strong> hygiene, to <strong>in</strong>crease fund<strong>in</strong>g of sanitation programs, to create government<br />
commitments <strong>and</strong> to def<strong>in</strong>e concrete actions <strong>and</strong> strategic alliances. One key milestone <strong>in</strong> this process<br />
<strong>in</strong> the Lat<strong>in</strong> American region was LATINOSAN, held <strong>in</strong> Cali, Colombia <strong>in</strong> November of 2007.<br />
In <strong>Honduras</strong>, one of the key topics of the official Strategic Plan for Moderniz<strong>in</strong>g the <strong>Water</strong> <strong>and</strong><br />
<strong>Sanitation</strong> Sector is political <strong>and</strong> adm<strong>in</strong>istrative decentralization, under which a detailed plan for<br />
meet<strong>in</strong>g the MDGs is a priority. This document was prepared with support from the World Bank <strong>Water</strong><br />
<strong>and</strong> <strong>Sanitation</strong> Program to highlight the l<strong>in</strong>kages between poverty <strong>and</strong> access to sanitation services. It<br />
shows that the poorest Hondurans, those liv<strong>in</strong>g <strong>in</strong> dispersed rural communities <strong>and</strong> peri-urban slums,<br />
have the least access to appropriate sanitation technologies <strong>and</strong> coverage. <strong>The</strong> result<strong>in</strong>g high risks to<br />
the environment <strong>and</strong> family health are also identified.<br />
It is hoped that the results of the present study will be useful to sector authorities <strong>in</strong> def<strong>in</strong><strong>in</strong>g sanitation<br />
policies, strategies <strong>and</strong> technical assistance programs aimed at the poor, which can provide<br />
susta<strong>in</strong>able, high quality options adapted to local realities. To have a tangible positive impact on<br />
health, there is no doubt that these programs must also <strong>in</strong>corporate <strong>in</strong>terventions <strong>in</strong> hygiene education<br />
<strong>and</strong> behavior change, such as h<strong>and</strong> wash<strong>in</strong>g.<br />
We are thankful to Ricardo Mairena for prepar<strong>in</strong>g this document, as well as to <strong>WSP</strong> colleagues Rafael<br />
Vera, Nelson Med<strong>in</strong>a, Mart<strong>in</strong> Gauss, Marco Quiroga, Simón Zb<strong>in</strong>den <strong>and</strong> Oscar Castillo, for their<br />
review <strong>and</strong> suggestions. Our acknowledgements also extend to colleagues <strong>and</strong> members of RAS-<br />
HON, CONASA, SANAA <strong>and</strong> ERSAPS <strong>in</strong> <strong>Honduras</strong>, who provided valuable op<strong>in</strong>ions dur<strong>in</strong>g the sector<br />
workshop held <strong>in</strong> Tegucigalpa where this study was reviewed.<br />
Jorge Méndez<br />
President<br />
RAS-HON<br />
Francois Brikke<br />
<strong>WSP</strong> Regional Director<br />
Lat<strong>in</strong> America / Caribbean<br />
1
Executive summary<br />
This document presents an analysis of poverty levels<br />
among rural <strong>and</strong> urban households of <strong>Honduras</strong> <strong>and</strong><br />
their access to sanitation solutions. It identifies key<br />
aspects for improv<strong>in</strong>g services <strong>and</strong> contribut<strong>in</strong>g to<br />
sector policies, strategies <strong>and</strong> <strong>in</strong>vestment plans that<br />
target the poor. <strong>The</strong> analysis is based on a broad<br />
review of available documentation <strong>and</strong> data.<br />
This study shows that the low <strong>in</strong>come population<br />
<strong>in</strong> <strong>Honduras</strong> is ma<strong>in</strong>ly rural (74%) <strong>and</strong> that the rest<br />
resides <strong>in</strong> urban areas (26%). <strong>The</strong> highest levels of<br />
access to sanitation services <strong>in</strong> cities corresponds to<br />
household connections to piped sewerage networks,<br />
but this option ma<strong>in</strong>ly serves the non-poor. Only 31%<br />
of the moderately poor <strong>and</strong> 12% <strong>in</strong> extreme poverty<br />
<strong>in</strong> urban areas have achieved access to sewerage<br />
networks. In rural areas sanitation solutions are<br />
generally on site excreta disposal (septic tanks or<br />
latr<strong>in</strong>es) but only 70% of the moderately poor <strong>and</strong><br />
49% of those <strong>in</strong> extreme poverty have access to<br />
even these solutions.<br />
sanitation coverage. To <strong>in</strong>crease effective sanitation<br />
coverage here, new <strong>in</strong>tervention strategies <strong>and</strong><br />
low-cost, environmentally-compatible solutions<br />
are needed. F<strong>in</strong>ally, greater local participation is<br />
necessary to achieve effective <strong>and</strong> susta<strong>in</strong>able<br />
access to sanitation for these families.<br />
<strong>The</strong> f<strong>in</strong>al conclusions of this analysis present the<br />
need to: a) prioritize pro-poor policies designed to<br />
facilitate their access to improved <strong>and</strong> susta<strong>in</strong>able<br />
sanitation services; b) adopt <strong>in</strong>novative, appropriate<br />
technologies <strong>and</strong> technical support; c) recognize<br />
the capacity of communities to organize <strong>and</strong> to<br />
contribute to their own development, by nurtur<strong>in</strong>g<br />
the participation of civil society organizations <strong>and</strong><br />
strengthen<strong>in</strong>g them to fulfill their roles; d) create<br />
a system to monitor programs’ performance; <strong>and</strong><br />
e) <strong>in</strong>volve the coord<strong>in</strong>ated participation of NGOs<br />
<strong>and</strong> <strong>in</strong>ternational agencies <strong>in</strong> develop<strong>in</strong>g sanitation<br />
programs.<br />
This study identifies three scenarios for sanitation<br />
access:<br />
a)<br />
b)<br />
c)<br />
Urban areas, where a significant part of the poor<br />
have latr<strong>in</strong>es <strong>and</strong> a portion does not have access<br />
to even this solution. In this case, this study po<strong>in</strong>ts<br />
out the need for a strategy to assure that exist<strong>in</strong>g<br />
on-site solutions function properly. In addition,<br />
improved water supply services are needed for poor<br />
sectors to be connected to sewerage networks.<br />
Concentrated rural communities with populations<br />
above 200 people, where a high percentage of<br />
homes have latr<strong>in</strong>es or other similar solutions. In this<br />
case, this study proposes rehabilitat<strong>in</strong>g or replac<strong>in</strong>g<br />
dysfunctional <strong>in</strong>frastructure, <strong>and</strong> ensur<strong>in</strong>g sanitary<br />
education <strong>and</strong> service susta<strong>in</strong>ability.<br />
Dispersed rural villages of less than 200<br />
<strong>in</strong>habitants with lower population densities are the<br />
poorest segment of the country <strong>and</strong> have the lowest<br />
2
1. Introduction<br />
Access to sanitation services is a basic <strong>in</strong>dicator of<br />
poverty. If <strong>in</strong>vestments <strong>in</strong> the water <strong>and</strong> sanitation<br />
sector are to have a favorable impact on poverty<br />
reduction, they should target the poorest areas such<br />
as rural communities <strong>and</strong> peri-urban neighborhoods of<br />
larger cities. This study analyzes access to sanitation<br />
services (not <strong>in</strong>clud<strong>in</strong>g water supply services) as a<br />
function of the level of poverty.<br />
In the global context, the Millennium Development<br />
Goals of the United Nations General Assembly (2000)<br />
<strong>and</strong> the results of the World Summit on Susta<strong>in</strong>able<br />
Development <strong>in</strong> Johannesburg (2002) set global<br />
targets that <strong>in</strong>clude reduc<strong>in</strong>g by half the percentage<br />
of people without susta<strong>in</strong>able access to safe dr<strong>in</strong>k<strong>in</strong>g<br />
1<br />
water <strong>and</strong> improved sanitation by 2015. For <strong>Honduras</strong>,<br />
this commitment represents a challenge that implies a<br />
conscious, well-oriented effort that maximizes available<br />
opportunities <strong>and</strong> resources to ensure that poor <strong>and</strong><br />
excluded families enjoy the benefits of sanitation <strong>in</strong> their<br />
health, improved liv<strong>in</strong>g conditions <strong>and</strong> personal dignity.<br />
<strong>The</strong> benefits of sanitation for people are direct<br />
<strong>and</strong> significant, but <strong>in</strong> order to improve sector<br />
performance, meet dem<strong>and</strong>s for quality services<br />
<strong>and</strong> achieve the proposed targets, the water <strong>and</strong><br />
sanitation sector needs a major transformation,<br />
especially <strong>in</strong> its regulatory agencies, policies <strong>and</strong><br />
strategies. <strong>The</strong>se changes are already underway,<br />
stimulated by the new <strong>Water</strong> <strong>and</strong> <strong>Sanitation</strong> Sector<br />
Framework Law passed <strong>in</strong> 2003.<br />
Provid<strong>in</strong>g the poor with sanitation services <strong>in</strong> the<br />
magnitude proposed <strong>in</strong> the Millennium Declaration<br />
requires an approach that takes <strong>in</strong>to account the<br />
capacity of communities to organize themselves,<br />
contribute to their own development <strong>and</strong> meet<br />
local needs <strong>and</strong> dem<strong>and</strong>s. <strong>The</strong> poor should be at<br />
the center of plann<strong>in</strong>g <strong>and</strong> <strong>in</strong>vestment programs <strong>in</strong><br />
sanitation. To this end, the agencies of the water <strong>and</strong><br />
sanitation sector <strong>in</strong> <strong>Honduras</strong> are work<strong>in</strong>g together to<br />
develop new policy guidel<strong>in</strong>es <strong>and</strong> sector strategies.<br />
However, there is little <strong>in</strong>formation available on<br />
sanitation <strong>in</strong> the country. To enrich this process of<br />
reflection <strong>and</strong> dialogue, the National<br />
Autonomous <strong>Water</strong> <strong>and</strong> Sewerage Service<br />
(SANAA) – act<strong>in</strong>g as the Technical<br />
Secretary of the National <strong>Water</strong> <strong>and</strong><br />
<strong>Sanitation</strong> Council (CONASA) – <strong>and</strong> the<br />
<strong>Water</strong> <strong>and</strong> <strong>Sanitation</strong> Network of <strong>Honduras</strong><br />
(RAS-HON), with technical assistance<br />
from the World Bank’s <strong>Water</strong> <strong>and</strong> <strong>Sanitation</strong><br />
Program (<strong>WSP</strong>), analyzed the situation of<br />
sanitation <strong>in</strong> <strong>Honduras</strong> based on available<br />
official data.<br />
1 United Nations Development Programme, UNDP. Web Page:<br />
Millennium Development Goals. http://www.undp.org/mdg/goallist.shtml<br />
3
Objective of the study<br />
<strong>The</strong> objective of the study was to analyze the situation<br />
of rural <strong>and</strong> urban sanitation <strong>in</strong> <strong>Honduras</strong> <strong>and</strong> its<br />
relationship to poverty. Sector <strong>in</strong>stitutions can use the<br />
f<strong>in</strong>d<strong>in</strong>gs of this study as a reference for develop<strong>in</strong>g<br />
sanitation policies <strong>and</strong> strategies that target the poorest<br />
Hondurans. Fund<strong>in</strong>g agencies <strong>and</strong> projects may also<br />
f<strong>in</strong>d this study useful <strong>in</strong> prioritiz<strong>in</strong>g their <strong>in</strong>vestments.<br />
Methodology<br />
<strong>The</strong> study is based on the follow<strong>in</strong>g official <strong>in</strong>formation:<br />
i) Sector Programm<strong>in</strong>g based on the National <strong>Poverty</strong><br />
Reduction Strategy (2005), published by CONASA<br />
us<strong>in</strong>g data from the 2001 National Census; ii) the 2004<br />
2<br />
Liv<strong>in</strong>g St<strong>and</strong>ards Measurement Survey (ENCOVI) ,<br />
<strong>and</strong>; iii) the 2006 Multi-Purpose Permanent Household<br />
3<br />
Survey (EPHPM) .<br />
2 <strong>The</strong> ENCOVI of the National Statistics Institute (INE) is a multi-purpose survey carried out every four or five years on household liv<strong>in</strong>g st<strong>and</strong>ards. <strong>The</strong> sample is 8,064 households <strong>in</strong><br />
688 urban <strong>and</strong> 320 rural areas grouped <strong>in</strong> 1,008 census strata.<br />
3<br />
<strong>The</strong> EHPM is multi-purpose survey carried out twice annually by the INE. <strong>The</strong> 2006 survey covered a sample of 20,955 households <strong>in</strong> 2,334 urban <strong>and</strong> 1,857 rural areas, distributed<br />
<strong>in</strong> 4,191 census strata.<br />
4
2. Access to sanitation <strong>and</strong> the situation at<br />
the national level<br />
Table 1 shows percentages of access to sanitation<br />
services accord<strong>in</strong>g to the three data sources.<br />
It should be noted that the data on access correspond<br />
to different years <strong>and</strong> is based on different calculations.<br />
In the case of the CONASA document, access was<br />
determ<strong>in</strong>ed us<strong>in</strong>g population data. <strong>The</strong> ENCOVI <strong>and</strong><br />
EPHPM surveys refer to the percentage of homes with<br />
access to water <strong>and</strong> sanitation services.<br />
<strong>The</strong> data from this table should be used consider<strong>in</strong>g<br />
that the levels of access to sanitation described are<br />
based on different sources us<strong>in</strong>g different calculation<br />
methods. Whereas the levels of access to water<br />
supplies are similar, there is a significant difference<br />
between the percentage of access to sanitation<br />
reported by CONASA <strong>and</strong> that reported by ENCOVI<br />
<strong>and</strong> EPHPM. This is because CONASA estimates<br />
coverage of sanitation services exclud<strong>in</strong>g urban<br />
households with access to on-site excreta disposal<br />
solutions (latr<strong>in</strong>es <strong>and</strong> septic tanks); CONASA only<br />
considers as hav<strong>in</strong>g access to sanitation the population<br />
connected to a sewerage network. If this <strong>in</strong>dicator<br />
were applied to the data reported by ENCOVI <strong>in</strong> 2004,<br />
sanitation coverage nationally would have been 64%,<br />
4<br />
comparable to the level reported by CONASA.<br />
Table 1<br />
Access to water <strong>and</strong> sanitation services <strong>in</strong> <strong>Honduras</strong><br />
Type of Access<br />
CONASA 2005 ENCOVI 2004 EPHPM 2006<br />
Population (1) Households (2) Households (3)<br />
<strong>Water</strong> 79.5% 80.1% 81.0%<br />
<strong>Sanitation</strong> 67.1% 82.2% 85.6%<br />
(1) CONASA. Sector Programm<strong>in</strong>g based on Targets of the <strong>Poverty</strong> Reduction Strategy<br />
January 2005. 2001 Census data.<br />
(2) National Institute of Statistics (INE). Survey of Liv<strong>in</strong>g Conditions 2004.<br />
(3) National Institute of Statistics (INE). Multi-purpose Permanent Household Survey 2006.<br />
4 <strong>The</strong> percentage of households with access to sanitation is calculated with 2004 ENCOVI data takes the total number of rural households with a sanitation solution (474,964), adds<br />
435,754 urban households connected to a sewerage network, divided by the total number of households (1,417,071), result<strong>in</strong>g <strong>in</strong> 64.3% with access to sanitation.<br />
5
<strong>The</strong> data as reported here <strong>in</strong>dicate that access levels<br />
were comparable. Nevertheless, for the purpose of<br />
analyz<strong>in</strong>g the state of sanitation, this study uses the<br />
2004 ENCOVI figures, as that survey was also used as<br />
the basis for a recent poverty study by the World Bank<br />
5<br />
published <strong>in</strong> 2006.<br />
<strong>The</strong> 2004 ENCOVI survey estimated a total national<br />
population of 7.07 million, of which 51.7% lived <strong>in</strong> rural<br />
areas <strong>and</strong> 48.3% <strong>in</strong> cities.<br />
<strong>The</strong> recent poverty assessment of <strong>Honduras</strong><br />
established poverty strata for the population <strong>and</strong><br />
reported that 50.7% of the population (3.58 million) lived<br />
below the poverty l<strong>in</strong>e <strong>and</strong> 23.7% (1.68 million) lived<br />
<strong>in</strong> extreme poverty. <strong>The</strong>se figures <strong>in</strong>dicate that more<br />
than five of every ten Hondurans live <strong>in</strong> poverty <strong>and</strong><br />
that more than two of every ten live <strong>in</strong> extreme poverty<br />
conditions.<br />
On the other h<strong>and</strong>, several sanitation technologies are<br />
<strong>in</strong> use <strong>in</strong> the country, <strong>in</strong>clud<strong>in</strong>g on-site excreta disposal<br />
(latr<strong>in</strong>es <strong>and</strong> septic tanks) <strong>and</strong> hydraulic sewerage<br />
networks. Table 2 uses 2004 ENCOVI data to determ<strong>in</strong>e<br />
access to sanitation services by technology.<br />
Table 2<br />
Access to sanitation by technology<br />
<strong>Sanitation</strong> solution<br />
Sewerage network 32.3%<br />
On-site hydraulic systems 11.7% 82.2%<br />
Latr<strong>in</strong>es 38.2%<br />
No access 17.8% 17.8%<br />
Source: 2004 ENCOVI<br />
Percentage of<br />
households<br />
with access<br />
Total<br />
percentage<br />
100% 100%<br />
5<br />
<strong>Honduras</strong>: <strong>Poverty</strong> Assessment. Atta<strong>in</strong><strong>in</strong>g <strong>Poverty</strong> Reduction. World Bank, June 2006.<br />
6
While approximately one-third of all households had<br />
6<br />
access to a sewerage network, the latr<strong>in</strong>e was the<br />
most common option, found <strong>in</strong> 38% of households.<br />
When on-site hydraulic systems (12% of households)<br />
7<br />
were <strong>in</strong>cluded, on-site technologies were found <strong>in</strong><br />
half (50%) of households surveyed <strong>in</strong> both rural <strong>and</strong><br />
urban areas.<br />
As this document will show, access levels, type of<br />
sanitation technology <strong>and</strong> socioeconomic levels are<br />
all related. This study uses the poverty classification<br />
system employed <strong>in</strong> the World Bank’s poverty<br />
8<br />
assessment , which designates three categories: a)<br />
the non-poor; b) the moderately poor; <strong>and</strong><br />
c) the extremely poor.<br />
Table 3 shows the level of access to the<br />
different types of sanitation technology for each<br />
socioeconomic group.<br />
Non-poor:<br />
Encompasses that population above the total poverty<br />
9<br />
l<strong>in</strong>e, with cash <strong>in</strong>come that gives them a determ<strong>in</strong>ed<br />
capacity to pay.<br />
Moderately poor:<br />
Population whose consumption is greater than the<br />
highest level of extreme poverty (the extreme poverty<br />
l<strong>in</strong>e) but below the total poverty l<strong>in</strong>e. <strong>The</strong>se families<br />
can satisfy basic needs beyond food <strong>and</strong> has a<br />
limited capacity to pay.<br />
Extremely poor:<br />
Those below the extreme poverty l<strong>in</strong>e, with a<br />
consumption level below the established m<strong>in</strong>imum<br />
<strong>and</strong> practically no capacity to pay.<br />
Table 3<br />
<strong>Sanitation</strong> access by poverty groups<br />
(Percentage of poverty group for each category)<br />
Type of sanitation service<br />
Non-poor<br />
Moderately<br />
poor<br />
Extremely<br />
poor<br />
Total<br />
Connection to a sewerage network 51.0 12.4 2.2 32.2<br />
On-site hydraulic system (1) 15.6 8.6 3.9 11.6<br />
Latr<strong>in</strong>e (2) 26.7 55.0 49.4 38.2<br />
No access 6.7 24.0 44.5 18.0<br />
Source: <strong>Honduras</strong> <strong>Poverty</strong> Assessment. World Bank, June 2006<br />
(1) Includes: a) bathroom connected to septic tank; b) bathroom discharg<strong>in</strong>g to a river/stream; c) toilet discharg<strong>in</strong>g to a river/stream<br />
(2) Includes: a) pour-flush latr<strong>in</strong>e; b) latr<strong>in</strong>e <strong>and</strong> septic tank; c) pit latr<strong>in</strong>e; d) compost<strong>in</strong>g latr<strong>in</strong>e<br />
6 For this study, “latr<strong>in</strong>e” refers to all safe human waste disposal solutions near the dwell<strong>in</strong>g, <strong>in</strong>clud<strong>in</strong>g pour-flush<br />
(water seal) latr<strong>in</strong>es.<br />
7 On-site solutions with pour-flush latr<strong>in</strong>es <strong>in</strong>cluded systems with septic tanks, as well as small-bore piped connections<br />
that discharged untreated waste <strong>in</strong>to rivers, streams, etc.<br />
8 <strong>Honduras</strong>: <strong>Poverty</strong> Assessment. Atta<strong>in</strong><strong>in</strong>g <strong>Poverty</strong> Reduction. World Bank, June 2006.<br />
9 “<strong>The</strong> extreme poverty l<strong>in</strong>e is def<strong>in</strong>ed as the monthly cost of food to provide 2,200 calories per day …<strong>The</strong> full<br />
poverty l<strong>in</strong>e is equal to the extreme poverty l<strong>in</strong>e plus an additional allowance for non-food consumption.”<br />
<strong>Honduras</strong>. <strong>Poverty</strong> Assessment. World Bank, June 2006.<br />
7
Percentage of households <strong>in</strong> poverty group<br />
60.0<br />
50.0<br />
40.0<br />
30.0<br />
20.0<br />
10.0<br />
0.0<br />
Sewerage<br />
Graph 1<br />
<strong>Sanitation</strong> access - non poor<br />
On site hydraulic<br />
systems<br />
<strong>Sanitation</strong> technology<br />
Latr<strong>in</strong>es<br />
No access<br />
<strong>The</strong> table shows that more than half (51%) of non-poor<br />
households were connected to a sewerage network,<br />
correspond<strong>in</strong>g to homes <strong>in</strong> areas where a physical<br />
connection was possible. <strong>The</strong> 2004 ENCOVI survey<br />
showed that higher-<strong>in</strong>come groups were the ones most<br />
often connected to sewerage networks. Sewerage<br />
connections of the lowest two <strong>in</strong>come qu<strong>in</strong>tiles of the<br />
population represented 11% of all connections, whereas<br />
the two highest-earn<strong>in</strong>g qu<strong>in</strong>tiles accounted for 70% of<br />
10<br />
all connections.<br />
Graph 2<br />
<strong>Sanitation</strong> access – extremely poor<br />
Percentage of households <strong>in</strong> poverty group<br />
60.0<br />
50.0<br />
40.0<br />
30.0<br />
20.0<br />
10.0<br />
Sewerage.<br />
On site hydraulic<br />
systems<br />
Latr<strong>in</strong>es<br />
No access<br />
0.0<br />
<strong>Sanitation</strong> technology<br />
Graph 3<br />
<strong>Sanitation</strong> access - moderately poor<br />
60.0<br />
Latr<strong>in</strong>es<br />
50.0<br />
Group percentage of households<br />
40.0<br />
30.0<br />
20.0<br />
10.0<br />
Sewerage<br />
On site hydraulic<br />
systems<br />
Not def<strong>in</strong>ed<br />
0.0<br />
<strong>Sanitation</strong> technology<br />
10<br />
ENCOVI 2004. Table 12, page 50.<br />
8
A small percentage of non-poor households had latr<strong>in</strong>es<br />
<strong>and</strong> on-site hydraulic solutions (septic tanks). Where<br />
these households are located <strong>in</strong> areas without sewerage<br />
networks, on-site solutions (latr<strong>in</strong>es <strong>and</strong> septic tanks) are<br />
the only feasible option. This situation occurs <strong>in</strong> nonpoor<br />
urban households located far from the sewerage<br />
networks <strong>and</strong> <strong>in</strong> non-poor households <strong>in</strong> rural areas.<br />
In the moderately poor group, latr<strong>in</strong>es were the most<br />
frequently <strong>in</strong>stalled technology; connections to sewerage<br />
networks <strong>and</strong> on-site hydraulic solutions were much less<br />
frequent, largely because this population is concentrated<br />
<strong>in</strong> rural zones where the latr<strong>in</strong>e is the most frequently<br />
chosen sanitation technology (62.8% of the moderately<br />
poor live <strong>in</strong> rural areas). A smaller percentage of this<br />
group lives <strong>in</strong> peri-urban zones without access to<br />
sewerage networks. In these zones, latr<strong>in</strong>es are the<br />
“temporary” sanitation solution most frequently adopted.<br />
<strong>The</strong> extremely poor group relies almost exclusively on<br />
latr<strong>in</strong>es. <strong>The</strong> latr<strong>in</strong>e has the lowest cost of the sanitation<br />
technologies <strong>in</strong> use the country. However, this group’s<br />
poverty limits its ability to cover the cost of a latr<strong>in</strong>e.<br />
Consequently, 44.5% of the extremely poor (747,000<br />
people) did not have access to any form of sanitation.<br />
<strong>The</strong>se figures refer to aggregate national totals. <strong>The</strong><br />
follow<strong>in</strong>g sections present a more detailed analysis of<br />
sanitation access <strong>in</strong> rural <strong>and</strong> urban areas.<br />
9
3. Rural sanitation<br />
<strong>The</strong> rural areas of <strong>Honduras</strong> have a greater <strong>in</strong>cidence<br />
11<br />
of poverty. Accord<strong>in</strong>g to the World Bank poverty report,<br />
72.2% of the rural population lived below the poverty<br />
l<strong>in</strong>e <strong>and</strong> represented 73.7% of the country’s poor (2.64<br />
million). 39.5% of the rural population was extremely<br />
poor, account<strong>in</strong>g for 86.1% of the total population liv<strong>in</strong>g<br />
<strong>in</strong> extreme poverty (1.44 million), which means that<br />
more than seven of every 10 people liv<strong>in</strong>g <strong>in</strong> rural areas<br />
were poor <strong>and</strong> that of those, almost four lived <strong>in</strong> extreme<br />
poverty.<br />
<strong>The</strong>se figures are values averaged for rural areas<br />
nationwide, but some regions have even higher poverty<br />
levels. <strong>The</strong> rural area of the country’s central region had<br />
30.6% of the nation’s poor (1.10 million), followed by the<br />
western rural areas with 26.9% (960,000) <strong>and</strong> eastern<br />
rural areas with 16.3% (580,000).<br />
Table 4 shows percentages with access to sanitation <strong>in</strong><br />
rural areas. Latr<strong>in</strong>es were the most commonly used rural<br />
sanitation technology - more than half of all households<br />
(53.2%) had latr<strong>in</strong>es. On-site hydraulic systems,<br />
ma<strong>in</strong>ly septic tanks, were the second-most common<br />
option (12.2%). <strong>The</strong>se two technologies represented<br />
the sanitation solution for nearly two-thirds of rural<br />
households. <strong>The</strong> rema<strong>in</strong><strong>in</strong>g third of rural households<br />
(31.4%) apparently had no access, represent<strong>in</strong>g an<br />
estimated 1.1 million rural <strong>in</strong>habitants with no safe<br />
12<br />
sanitation.<br />
<strong>Sanitation</strong> network connections were almost<br />
<strong>in</strong>significant <strong>in</strong> rural areas, serv<strong>in</strong>g only 3.2% of rural<br />
households.<br />
Graph 4<br />
Distribution of poverty by region<br />
Western<br />
rural<br />
26.9%<br />
Eastern<br />
rural<br />
16.3%<br />
Central<br />
rural<br />
30.6%<br />
Total<br />
urban<br />
26.2%<br />
11 <strong>Honduras</strong>: <strong>Poverty</strong> Assessment. Atta<strong>in</strong><strong>in</strong>g <strong>Poverty</strong> Reduction. World Bank, June 2006.<br />
12 Population is determ<strong>in</strong>ed to be 31.4% of 689,932 rural households with an average occupation <strong>in</strong>dex of 5.2 <strong>in</strong>habitants per dwell<strong>in</strong>g, as reported by ENCOVI 2004.<br />
10
Data <strong>and</strong> classification of the 2004 ENCOVI <strong>in</strong> Table 4 show that on-site hydraulic solutions <strong>in</strong>cluded: a) bathroom with<br />
a septic tank (94%); b) bathroom discharg<strong>in</strong>g to a river/stream (3.8%); <strong>and</strong> c) toilet discharg<strong>in</strong>g to a river/stream (1.8%).<br />
Many non-poor households <strong>in</strong> towns <strong>and</strong> ranches that can afford <strong>in</strong>frastructure costs have bathrooms with septic tanks.<br />
Table 4<br />
Access to rural sanitation by poverty groups<br />
(Percentage of households for each category)<br />
Type of <strong>Sanitation</strong> Service Non-poor Moderately<br />
poor<br />
Extremely<br />
poor<br />
Total<br />
Connection to sewerage network 7.1 1.7 0.3 3.2<br />
On-site hydraulic system (1) 25.0 7.5 1.8 12.2<br />
Latr<strong>in</strong>es (2) 51.3 59.7 48.8 53.2<br />
No access 16.6 31.1 49.1 31.4<br />
Source: <strong>Honduras</strong> <strong>Poverty</strong> Assessment. World Bank, June 2006<br />
(1) Includes: a) bathroom connected to septic tank; b) bathroom discharg<strong>in</strong>g to a river/stream; c) toilet discharg<strong>in</strong>g to<br />
a river/stream<br />
(2) Includes: a) pour-flush latr<strong>in</strong>e; b) latr<strong>in</strong>e <strong>and</strong> septic tank; c) pit latr<strong>in</strong>e; d) compost<strong>in</strong>g latr<strong>in</strong>e<br />
Latr<strong>in</strong>es are present <strong>in</strong> both poor <strong>and</strong> non-poor groups.<br />
Latr<strong>in</strong>es for each group were as follows: 51% <strong>in</strong> the<br />
non-poor group, 60% <strong>in</strong> the moderately poor group <strong>and</strong><br />
49% <strong>in</strong> the extremely poor group. Latr<strong>in</strong>es are most<br />
common <strong>in</strong> rural households, especially among the poor,<br />
because government <strong>in</strong>stitutions, mostly the Honduran<br />
Social Investment Fund (FHIS), <strong>and</strong> non-governmental<br />
organizations, provide these through their rural<br />
<strong>in</strong>frastructure programs.<br />
Several types of latr<strong>in</strong>es have been built <strong>in</strong> rural areas.<br />
<strong>The</strong> INE uses the follow<strong>in</strong>g classifications <strong>in</strong> its surveys:<br />
a) pour-flush latr<strong>in</strong>es; b) latr<strong>in</strong>es connected to a septic<br />
13<br />
tank; c) pit latr<strong>in</strong>e; <strong>and</strong> d) compost<strong>in</strong>g latr<strong>in</strong>es. Data<br />
from ENCOVI 2004 allowed to calculate the prevalence of<br />
each of these types of latr<strong>in</strong>es for rural sanitation. Table 5<br />
lists percentages of rural households with each type.<br />
Pour flush latr<strong>in</strong>es were the most common type of<br />
latr<strong>in</strong>e <strong>in</strong> rural areas (54%). Pit latr<strong>in</strong>es ranked second,<br />
account<strong>in</strong>g for approximately one-third of all latr<strong>in</strong>es.<br />
<strong>The</strong>se two groups were the most frequent, together<br />
account<strong>in</strong>g for 84% of all latr<strong>in</strong>es <strong>in</strong> rural households.<br />
Type of latr<strong>in</strong>e<br />
* Based on 2004 ENCOVI data<br />
Table 5<br />
Latr<strong>in</strong>es <strong>in</strong> rural areas<br />
Percentage of<br />
total rural latr<strong>in</strong>es<br />
Percentage of<br />
total rural<br />
households<br />
Pour-flush latr<strong>in</strong>e 53.8% 28.7%<br />
Septic tank latr<strong>in</strong>e 15.7% 8.4%<br />
Pit latr<strong>in</strong>e 29.9% 15.9%<br />
Compost<strong>in</strong>g latr<strong>in</strong>e 0.6% 0.3%<br />
Total 100.0% 53.3%<br />
13<br />
Includ<strong>in</strong>g the simple pit latr<strong>in</strong>e <strong>and</strong> the ventilated improved pit latr<strong>in</strong>e.<br />
11
Compost<strong>in</strong>g latr<strong>in</strong>es were uncommon, present <strong>in</strong> only<br />
0.3% of rural homes. This technology is isolated <strong>and</strong><br />
<strong>in</strong>novative <strong>in</strong> <strong>Honduras</strong>. More promotion, stimulation of<br />
dem<strong>and</strong>, tra<strong>in</strong><strong>in</strong>g <strong>and</strong> a stronger <strong>in</strong>tegrated approach (as<br />
ecological sanitation, for example) are needed.<br />
Data on access to sanitation are a good <strong>in</strong>dicator of the<br />
existence of <strong>in</strong>frastructure <strong>in</strong> general. However, there<br />
is little <strong>in</strong>formation <strong>in</strong> the sector on the state of exist<strong>in</strong>g<br />
sanitation <strong>in</strong>frastructure, its ma<strong>in</strong>tenance <strong>and</strong> use <strong>and</strong> the<br />
sanitary practices of the rural population. A recent <strong>WSP</strong><br />
study on the current situation of sanitation services <strong>in</strong> 25<br />
rural communities <strong>in</strong> 13 of the country’s 18 departments<br />
found that 91% of the surveyed latr<strong>in</strong>es were <strong>in</strong> good<br />
14<br />
condition; these latr<strong>in</strong>es were built after Hurricane Mitch.<br />
An estimated 31% of households did not have any<br />
excreta disposal solution. At the same time, the real levels<br />
of latr<strong>in</strong>e usage are unknown. <strong>The</strong>re is <strong>in</strong>sufficient data<br />
available on the population that does not use latr<strong>in</strong>es <strong>and</strong><br />
the reasons for disuse (habits, preferences, poor physical<br />
condition, lack of resources for build<strong>in</strong>g or repairs, etc.).<br />
This suggests that simply count<strong>in</strong>g latr<strong>in</strong>es may result <strong>in</strong><br />
an overestimate of the real access to sanitation <strong>in</strong> rural<br />
zones. Studies are needed on the condition <strong>and</strong> use of<br />
rural sanitation <strong>in</strong>frastructure <strong>and</strong> on personal sanitary<br />
habits. To this end, the periodic National Statistics Institute<br />
(INE) household surveys could be modified to collect<br />
<strong>in</strong>formation to help assess these <strong>in</strong>dicators nationwide.<br />
In recent years, <strong>in</strong>terventions by the Honduran<br />
government, NGOs <strong>and</strong> <strong>in</strong>ternational agencies have<br />
<strong>in</strong>corporated capacity-build<strong>in</strong>g to encourage active<br />
community <strong>and</strong> family participation to help ensure<br />
susta<strong>in</strong>able services. Local capacity-build<strong>in</strong>g activities<br />
<strong>in</strong>clude hygiene education for behavior modification,<br />
us<strong>in</strong>g a methodology developed by UNICEF <strong>and</strong> SANAA<br />
s<strong>in</strong>ce 1996. <strong>The</strong> Healthy School <strong>and</strong> Home methodology<br />
has served as a model for public <strong>and</strong> private<br />
15<br />
organizations work<strong>in</strong>g <strong>in</strong> the sector.<br />
14 Assessment of the Current Situation of Basic <strong>Sanitation</strong> Services <strong>in</strong> Rural Communities <strong>and</strong> Low-<strong>in</strong>come Urban Areas of <strong>Honduras</strong>. NJS Consultants Co., Ltd. World Bank <strong>Water</strong> <strong>and</strong><br />
<strong>Sanitation</strong> Program, November, 2005.<br />
15 Field Note: Healthy Home <strong>and</strong> School - A Successful Experience <strong>in</strong> <strong>Honduras</strong>. Anthony P. Br<strong>and</strong>. World Bank <strong>Water</strong> <strong>and</strong> <strong>Sanitation</strong> Program, September, 2003.<br />
12
4. Urban sanitation<br />
<strong>The</strong> INE def<strong>in</strong>es urban areas as communities with a<br />
population of more than 2,000 <strong>and</strong> with basic public<br />
16<br />
services (water, electricity, health centers, etc.). Under<br />
these criteria, 48.3% of the national population is<br />
urban. <strong>The</strong> country’s largest cities are Tegucigalpa<br />
(population 885,000) <strong>and</strong> San Pedro Sula (population<br />
543,000). <strong>The</strong>se two cities alone represented 41.8% of<br />
the urban population <strong>and</strong> 20.2% of the total population.<br />
An additional two million people lived <strong>in</strong> other urban<br />
17<br />
centers.<br />
Table 6<br />
Urban population<br />
(thous<strong>and</strong>s)<br />
Population<br />
Percentage<br />
of urban<br />
total<br />
Percentage<br />
of national<br />
total<br />
Tegucigalpa 885 25.9% 12.5%<br />
San Pedro Sula 543 15.9% 7.7%<br />
Rest of urban 1,985 58.2% 28.1%<br />
Total Urban<br />
National Total<br />
Source: 2004 ENCOVI<br />
3,413 100.0% 48.3%<br />
3,413 100.0% 48.3%<br />
A total of 3.4 million people lived <strong>in</strong> urban areas, of<br />
which 20.8% (710,000) were moderately poor, 6.8%<br />
(230,000) extremely poor <strong>and</strong> 72.2% (2.5 million) nonpoor.<br />
<strong>The</strong>se figures show that nationwide, urban areas were<br />
home to just over a quarter (26.3%) of the country’s<br />
poor, 13.9% of the total extremely poor <strong>and</strong> 70.9% of<br />
the total non-poor. In general, urban dwellers can be<br />
expected to have a greater capacity to pay for water<br />
18<br />
<strong>and</strong> sanitation services than do rural households.<br />
Table 7<br />
Urban population by poverty status<br />
(City/group – calculated by row)<br />
Extremely<br />
poor<br />
(1)<br />
Moderately<br />
<strong>and</strong><br />
extremely<br />
Poor<br />
(2)<br />
Non-poor<br />
(3)<br />
Total<br />
(2)+(3)<br />
Tegucigalpa 1.9% 15.1% 84.9% 100.0%<br />
San Pedro Sula 1.4% 16.6% 83.4% 100.0%<br />
Rest of urban area 10.5% 36.2% 63.8% 100.0%<br />
Total Urban 6.8% 27.6% 72.4% 100.0%<br />
(% of national total – calculated by column)<br />
Extremely<br />
poor<br />
Moderately<br />
<strong>and</strong><br />
extremely<br />
poor<br />
Non-poor<br />
Total<br />
Population<br />
Tegucigalpa 1.0% 3.7% 21.5% 12.5%<br />
San Pedro Sula 0.4% 2.5% 13.0% 7.7%<br />
Rest of urban 12.5% 20.0% 36.3% 28.1%<br />
Total Urban 13.9% 26.3% 70.9% 48.3%<br />
Source: <strong>Honduras</strong>: <strong>Poverty</strong> Assessment. 2006, World Bank.<br />
Table 8 presents access to sanitation <strong>in</strong> the country’s<br />
urban areas. Sewerage networks served 60% of<br />
households, a low coverage rate for cities. It is<br />
noteworthy that more than a third of households had<br />
on-site sanitation solutions (septic tanks <strong>and</strong> latr<strong>in</strong>es),<br />
a reflection of the <strong>in</strong>sufficient expansion of sewerage<br />
networks to meet the grow<strong>in</strong>g urban dem<strong>and</strong>.<br />
Just 5.2% of urban households had no access to<br />
any type of sanitation, but that small percentage<br />
represented 37,800 urban households, suggest<strong>in</strong>g that<br />
outdoor defecation may be widespread. This practice<br />
creates contam<strong>in</strong>ation problems <strong>in</strong> dense peri-urban<br />
areas, where the poor <strong>and</strong> especially the extremely<br />
poor live, <strong>and</strong> where many households lacked access<br />
to sanitation (28%).<br />
16 2004 National Liv<strong>in</strong>g St<strong>and</strong>ards Survey. INE, pg. 17.<br />
17 Ibid.<br />
18 <strong>Honduras</strong>: <strong>Poverty</strong> Assessment. Atta<strong>in</strong><strong>in</strong>g <strong>Poverty</strong> Reduction. World Bank, June 2006.<br />
13
<strong>The</strong> sanitation technology to which urban residents have access varies accord<strong>in</strong>g to their poverty level. Among the nonpoor<br />
population (72.4% of urban dwellers), 70% of households were connected to a sewerage network. <strong>The</strong> second most<br />
common type of sanitation among the non-poor was on-site human waste disposal (septic tanks <strong>and</strong> latr<strong>in</strong>es). On-site<br />
technologies were used <strong>in</strong> 28.2% of urban households, which resort to these solutions because they cannot connect to<br />
the sewerage network, usually due to the low capacity of piped networks or the distance to city collection networks.<br />
Table 8<br />
Access to urban sanitation by poverty group<br />
(Percentage of households for each category)<br />
Type of <strong>Sanitation</strong> Service<br />
Non-poor<br />
Moderately<br />
poor<br />
Extremely<br />
poor<br />
Total<br />
Connection to a sewerage network 69.5 31.5 12.2 60.0<br />
On-site hydraulic system (1) 11.7 10.4 6.1 11.2<br />
Latr<strong>in</strong>es (2) 16.5 46.6 53.4 23.6<br />
No access 2.3 11.5 28.1 5.2<br />
Source: <strong>Honduras</strong>: <strong>Poverty</strong> Assessment. World Bank, June 2006<br />
(1) Includes: a) bathroom connected to septic tank; b) bathroom discharg<strong>in</strong>g to a river/stream; c) toilet discharg<strong>in</strong>g to a river/stream<br />
(2) Includes: a) pour-flush latr<strong>in</strong>e; b) latr<strong>in</strong>e <strong>and</strong> septic tank; c) pit latr<strong>in</strong>e; d) compost<strong>in</strong>g latr<strong>in</strong>e<br />
Percentage of households <strong>in</strong> poverty group<br />
80.0<br />
70.0<br />
60.0<br />
50.0<br />
40.0<br />
30.0<br />
20.0<br />
10.0<br />
0.0<br />
Sewerage.<br />
Graph 5 Graph 6<br />
<strong>Sanitation</strong> Access – Non Poor<br />
<strong>Sanitation</strong> Access – Moderately Poor<br />
On site hydraulic<br />
systems<br />
Latr<strong>in</strong>es<br />
Not def<strong>in</strong>ed<br />
Percentage of households <strong>in</strong> poverty group<br />
50.0<br />
45.0<br />
40.0<br />
35.0<br />
30.0<br />
25.0<br />
20.0<br />
15.0<br />
10.0<br />
5.0<br />
0.0<br />
Sewerage.<br />
On site hydraulic<br />
systems<br />
Latr<strong>in</strong>es<br />
Not def<strong>in</strong>ed<br />
<strong>Sanitation</strong> technology<br />
<strong>Sanitation</strong> technology<br />
60.0<br />
50.0<br />
Graph 7 Graph 8<br />
<strong>Sanitation</strong> Access – Extremely poor<br />
<strong>Sanitation</strong> Access - Total<br />
70.0<br />
Latr<strong>in</strong>es<br />
Sewerage.<br />
60.0<br />
Group percentage of households<br />
40.0<br />
30.0<br />
20.0<br />
10.0<br />
0.0<br />
Sewerage.<br />
On site hydraulic<br />
systems<br />
<strong>Sanitation</strong> technology<br />
Not def<strong>in</strong>ed<br />
Group percentage of households<br />
50.0<br />
40.0<br />
30.0<br />
20.0<br />
10.0<br />
0.0<br />
On site hydraulic<br />
systems<br />
<strong>Sanitation</strong> technology<br />
Latr<strong>in</strong>es<br />
Not def<strong>in</strong>ed<br />
14
Type of latr<strong>in</strong>e<br />
Table 9<br />
Latr<strong>in</strong>es <strong>in</strong> urban areas<br />
Percentage of total<br />
urban latr<strong>in</strong>es<br />
by type<br />
Percentage of<br />
total urban<br />
households<br />
Pour-flush latr<strong>in</strong>e 32.3% 7.7%<br />
Septic tank latr<strong>in</strong>e 23.9% 5.7%<br />
Pit latr<strong>in</strong>e 42.9% 10.2%<br />
Compost<strong>in</strong>g latr<strong>in</strong>e 0.9% 0.2%<br />
Total 100.0% 23.7%<br />
Source: 2004 ENCOVI<br />
Network connections were drastically reduced to<br />
31.5% <strong>in</strong> the moderately poor group (20.6% of the<br />
urban population), <strong>in</strong> which the relative percentage of<br />
households with latr<strong>in</strong>es was almost triple, at 46.6%.<br />
<strong>The</strong>se figures <strong>in</strong>dicate that whereas approximately one<br />
third of the population was connected to the sewerage<br />
network, most people lived <strong>in</strong> homes too far from the<br />
piped networks or did not have the economic capacity<br />
to connect to them. Most of them did have latr<strong>in</strong>es,<br />
however, paid for with donations or with their own<br />
resources.<br />
Among extremely poor households (6.8% of the urban<br />
population), latr<strong>in</strong>e access rose to 53.4%. However, the<br />
percentage of extremely poor households without any<br />
access to sanitation <strong>in</strong>creased significantly to 28.1%.<br />
<strong>The</strong>se families live <strong>in</strong> peri-urban areas, often with<br />
difficult access <strong>and</strong> high risk. Latr<strong>in</strong>es <strong>in</strong> extremely poor<br />
households are most often built with support from social<br />
<strong>in</strong>vestment programs.<br />
In urban areas, most on-site hydraulic systems listed <strong>in</strong><br />
Table 8, accord<strong>in</strong>g to the INE classification system, are<br />
bathrooms (toilets <strong>and</strong>/or showers <strong>and</strong>/or washst<strong>and</strong>s)<br />
connected to septic tanks, <strong>and</strong> households that<br />
discharge wastewater <strong>in</strong>to rivers/streams. Of the urban<br />
families (poor <strong>and</strong> non-poor) with these systems, 82.3%<br />
had septic tanks <strong>and</strong> 12.3% discharged wastewater<br />
19<br />
<strong>in</strong>to streams.<br />
Latr<strong>in</strong>es also represent an important sanitation<br />
solution <strong>in</strong> the urban environment. Nearly one quarter<br />
(23.6%) of urban households <strong>in</strong> <strong>Honduras</strong> had one<br />
of several types of latr<strong>in</strong>es. Table 9 lists the pr<strong>in</strong>cipal<br />
types of latr<strong>in</strong>es found <strong>and</strong> the percentage of the total<br />
households with latr<strong>in</strong>es. Pit latr<strong>in</strong>es (both simple <strong>and</strong><br />
improved ventilated pit latr<strong>in</strong>es) were the most common<br />
<strong>in</strong> urban areas, represent<strong>in</strong>g 42.9% of all latr<strong>in</strong>es, <strong>and</strong><br />
were present <strong>in</strong> 10.2% of urban households. Pour-flush<br />
latr<strong>in</strong>es <strong>and</strong> septic tank latr<strong>in</strong>es together accounted for<br />
56.2% of households with latr<strong>in</strong>es.<br />
Pour-flush latr<strong>in</strong>es <strong>and</strong> pit latr<strong>in</strong>es discharge wastewater<br />
<strong>in</strong>to the subsoil for <strong>in</strong>filtration. To be effective they must<br />
be built on soil with adequate permeability to permit<br />
the wastewater to seep downward, away from people<br />
<strong>and</strong> reduc<strong>in</strong>g possible transmission of pathogens.<br />
When these latr<strong>in</strong>es are built on permeable soil they<br />
can greatly improve sanitary conditions. However,<br />
where subsoil has limited permeability, where it is rocky,<br />
where the water table is high or where plots are steeply<br />
sloped, this type of latr<strong>in</strong>e can generate contam<strong>in</strong>ation.<br />
In these cases, wastewater can accumulate <strong>in</strong> subsoils<br />
<strong>and</strong> leak <strong>in</strong>to topsoils, potentially contam<strong>in</strong>at<strong>in</strong>g the<br />
environment <strong>and</strong> putt<strong>in</strong>g public health at risk.<br />
19 <strong>Honduras</strong>: <strong>Poverty</strong> Assessment. Atta<strong>in</strong><strong>in</strong>g <strong>Poverty</strong> Reduction. Pg. 138. World Bank, June 2006.<br />
15
Table 10<br />
<strong>Sanitation</strong> access <strong>in</strong> Tegucigalpa<br />
(Percentage of dwell<strong>in</strong>gs <strong>in</strong> each category)<br />
Type of sanitation service<br />
Total<br />
Connection to sewerage network 80.7<br />
On-site hydraulic system (1) 3.6<br />
Another complication of the city’s sewerage system is<br />
its age; part of the network is over 50 years old <strong>and</strong><br />
badly needs rehabilitation or replacement. However, the<br />
real condition of many of the city’s collectors <strong>and</strong> much<br />
21<br />
of it’s collector network is unknown. Further studies<br />
are needed to determ<strong>in</strong>e which sectors of the network<br />
require the most urgent repairs or replacement <strong>and</strong> the<br />
real capacity of the primary collection system (subcollectors<br />
<strong>and</strong> collectors).<br />
Latr<strong>in</strong>es (2) 12.6<br />
No access 2.8<br />
Source: <strong>Honduras</strong>: <strong>Poverty</strong> Assessment. World Bank, June 2006<br />
(1) Includes: a) bathroom connected to septic tank; b) bathroom discharg<strong>in</strong>g to a<br />
river/stream; c) toilet discharg<strong>in</strong>g to a river/stream<br />
(2) Includes: a) pour-flush latr<strong>in</strong>e; b) latr<strong>in</strong>e <strong>and</strong> septic tank; c) pit latr<strong>in</strong>e; d) compost<strong>in</strong>g<br />
latr<strong>in</strong>e<br />
Technical st<strong>and</strong>ards should establish the acceptable<br />
conditions for apply<strong>in</strong>g this technology. In <strong>Honduras</strong> there<br />
are legal <strong>and</strong> normative gaps on this issue, <strong>and</strong> technical<br />
st<strong>and</strong>ards should be prepared <strong>and</strong> implemented for the<br />
selection, design, construction, operation <strong>and</strong> ma<strong>in</strong>tenance<br />
of on-site systems <strong>in</strong> urban areas.<br />
Access to sanitation services <strong>in</strong><br />
Tegucigalpa<br />
Accord<strong>in</strong>g to ENCOVI data from 2004, 80.7% of households<br />
<strong>in</strong> the capital were connected to the sewerage network.<br />
Latr<strong>in</strong>es were the second most common sanitation<br />
technology found, serv<strong>in</strong>g 12.6% of homes. On-site<br />
hydraulic systems were found <strong>in</strong> 3.6% of dwell<strong>in</strong>gs. A total<br />
of 2.8% of households reportedly had no sanitation solution.<br />
Despite the high percentage of access to the sewerage<br />
network reported by ENCOVI, many sectors of the network<br />
of sub-collectors, collectors <strong>and</strong> <strong>in</strong>terceptors were<br />
damaged <strong>in</strong> 1998 by Hurricane Mitch. To date, only a<br />
small part of the network has been repaired. Wastewater<br />
collected by the sewerage networks is discharged <strong>in</strong>to<br />
20<br />
rivers <strong>and</strong> streams. This situation is particularly evident<br />
near bodies of water, such as the Chiquito <strong>and</strong> Choluteca<br />
Rivers.<br />
20 Interviews with personnel of the National Autonomous <strong>Water</strong> <strong>and</strong> Sewerage System (SANAA).<br />
21 Interviews with SANAA personnel.<br />
16
5. Considerations for an urban sanitation strategy<br />
For the present study, Tegucigalpa was<br />
analyzed to aid <strong>in</strong> outl<strong>in</strong><strong>in</strong>g a strategy to<br />
improve urban sanitation services. <strong>The</strong><br />
capital city was chosen because it has<br />
the largest urban population <strong>in</strong> <strong>Honduras</strong>,<br />
it’s densely populated peri-urban areas,<br />
large number of connections to a sewerage<br />
network, significant operational difficulties <strong>in</strong><br />
provid<strong>in</strong>g water supply <strong>and</strong> sanitation <strong>and</strong><br />
because there are several different sanitation<br />
technologies <strong>in</strong> use. <strong>The</strong> conclusions of this<br />
analysis may be applicable to sanitation <strong>in</strong><br />
other urban areas, <strong>and</strong> could be validated for<br />
specific cities.<br />
To exp<strong>and</strong> sanitation services <strong>in</strong> Tegucigalpa,<br />
the socioeconomic composition of the<br />
population should be considered, each of<br />
which has its own unique characteristics.<br />
22<br />
Non-poor: Represent<strong>in</strong>g 85% of the city’s population,<br />
this group usually lives <strong>in</strong> zones with household water<br />
<strong>and</strong> sewerage connections where <strong>in</strong>frastructure<br />
is built by the private sector as part of residential<br />
developments.<br />
Moderately poor: Account<strong>in</strong>g for 13% of the city’s<br />
population, this group usually settles <strong>in</strong> outly<strong>in</strong>g areas<br />
of the city, where l<strong>and</strong> costs are lower but terra<strong>in</strong> is<br />
steeper. Generally, these zones do not have public<br />
services, but access to services gradually <strong>in</strong>creases<br />
as communities <strong>and</strong> aid programs <strong>in</strong>stall sanitation<br />
<strong>in</strong>frastructure.<br />
Extremely poor: Represent<strong>in</strong>g 2% of the city’s<br />
population, this group settles <strong>in</strong> outly<strong>in</strong>g areas of the<br />
city where terra<strong>in</strong> conditions are often adverse. <strong>The</strong>y<br />
often settle on high risk hillsides <strong>and</strong> along stream<br />
beds. Given their extreme poverty, these families<br />
generally do not have the f<strong>in</strong>ancial capacity to connect<br />
to city water <strong>and</strong> sanitation services.<br />
22 <strong>Honduras</strong>: <strong>Poverty</strong> Assessment. Atta<strong>in</strong><strong>in</strong>g <strong>Poverty</strong> Reduction. Pg. 95. World Bank, June 2006..<br />
17
<strong>The</strong> sanitation alternatives feasible for these<br />
different socioeconomic groups <strong>and</strong> the strategies<br />
to implement them vary. Table 11 lists the sanitation<br />
solutions typically used by each group <strong>in</strong> the city <strong>and</strong><br />
some general conditions associated with the adoption<br />
of each technology.<br />
A key aspect of access to sanitation services<br />
observed <strong>in</strong> Tegucigalpa is the relationship between<br />
dr<strong>in</strong>k<strong>in</strong>g water supply, the ability to connect to<br />
the sewerage network <strong>and</strong> available sanitation<br />
technologies. Table 12 shows that the non-poor<br />
group always had a water supply connection, <strong>and</strong><br />
therefore their sanitation solution generally <strong>in</strong>volved<br />
their ability to connect to a sewerage network. Where<br />
it is possible to connect to one of the city’s sewerage<br />
collectors, households usually choose that option. If<br />
it is not possible to connect to one of the collectors,<br />
septic tanks or latr<strong>in</strong>es are generally <strong>in</strong>stalled.<br />
<strong>The</strong> moderately poor <strong>and</strong> extremely poor groups<br />
adopt similar sanitation solutions. If no adequate city<br />
water connection exists, latr<strong>in</strong>es are used. Where<br />
an adequate water connection is available, these<br />
groups’ sanitation solutions will depend on their ability<br />
to connect to a sewerage network. If it is not feasible<br />
for households to connect to a collector, latr<strong>in</strong>es are<br />
used. However, if there is an available piped water<br />
supply <strong>and</strong> it is feasible to connect to a sewerage<br />
network, the sanitation solution chosen will usually<br />
depend on: a) project costs; b) dem<strong>and</strong> of families<br />
for the sanitation option; c) capacity <strong>and</strong> will<strong>in</strong>gness<br />
to pay; d) availability of f<strong>in</strong>anc<strong>in</strong>g, subsidies <strong>and</strong> cost<br />
recovery mechanisms; <strong>and</strong> e) local organization <strong>and</strong><br />
capacity to participate <strong>in</strong> a project. One alternative<br />
<strong>in</strong> this case could be low-cost, simplified sewerage<br />
networks (small bore, condom<strong>in</strong>ial, etc.).<br />
18
Table 11<br />
Types of users <strong>and</strong> sanitation alternatives <strong>in</strong> Tegucigalpa<br />
Type of solution Conditions <strong>Sanitation</strong> alternatives<br />
NON-POOR (750,000 <strong>in</strong>habitants)<br />
Sewerage network<br />
1- Possibility to connect to a municipal<br />
sewerage collection system or network<br />
2- Capacity to pay<br />
3- Adequate dr<strong>in</strong>k<strong>in</strong>g water supply<br />
4- Cost recovery mechanisms<br />
1- Conventional sewerage network <strong>and</strong><br />
connection to a municipal system<br />
2- Simplified sewerage network (small bore,<br />
condom<strong>in</strong>ial, etc.)<br />
Septic tanks, latr<strong>in</strong>es<br />
<strong>and</strong> other options<br />
MODERATELY POOR (117,000 <strong>in</strong>habitants)<br />
1- Possibility to connect to a municipal water<br />
network<br />
2- Capacity to pay<br />
1- Individual solutions (septic tanks<br />
compliant with municipal st<strong>and</strong>ards)<br />
2- Latr<strong>in</strong>es (compliant with municipal<br />
st<strong>and</strong>ards)<br />
Sewerage network<br />
1- Possibility to connect to a<br />
sewerage system or network<br />
2- Capacity <strong>and</strong> will<strong>in</strong>gness to pay<br />
3- Adequate dr<strong>in</strong>k<strong>in</strong>g water supply<br />
4- Community organization (<strong>Water</strong> Board)<br />
5- Dem<strong>and</strong> for the technology option<br />
6- F<strong>in</strong>anc<strong>in</strong>g, cost recovery <strong>and</strong> subsidy<br />
1- Conventional sewerage network <strong>and</strong><br />
connection to a municipal system<br />
2- Simplified sewerage network (small bore,<br />
condom<strong>in</strong>ial, etc.)<br />
Latr<strong>in</strong>es<br />
1- Possibility to connect to a sewerage<br />
system or network<br />
2- Capacity <strong>and</strong> will<strong>in</strong>gness to pay<br />
3- Adequate dr<strong>in</strong>k<strong>in</strong>g water supply<br />
4- Community organization (<strong>Water</strong> Board)<br />
5- Dem<strong>and</strong> for the technology option<br />
6- F<strong>in</strong>anc<strong>in</strong>g, cost recovery <strong>and</strong> subsidy<br />
1- Improved ventilated pit latr<strong>in</strong>e (VIP)<br />
2- Other types of latr<strong>in</strong>es<br />
EXTREMELY POOR (17,000 <strong>in</strong>habitants)<br />
Latr<strong>in</strong>es<br />
1- Possibility to connect to a sewerage<br />
system or network<br />
2- Capacity <strong>and</strong> will<strong>in</strong>gness to pay<br />
3- Adequate dr<strong>in</strong>k<strong>in</strong>g water supply<br />
4- Community organization (<strong>Water</strong> Board)<br />
5- Dem<strong>and</strong> for the technology option<br />
6- F<strong>in</strong>anc<strong>in</strong>g, cost recovery <strong>and</strong> subsidy<br />
1- Improved ventilated pit latr<strong>in</strong>e (VIP)<br />
2- Other types of latr<strong>in</strong>es<br />
Population data from <strong>Honduras</strong>: <strong>Poverty</strong> Assessment. World Bank, June 2006.<br />
19
Ultimately, the city will have to <strong>in</strong>crease access<br />
to sanitation services by exp<strong>and</strong><strong>in</strong>g its water <strong>and</strong><br />
sanitation <strong>in</strong>frastructure. Medium- <strong>and</strong> long-term<br />
<strong>in</strong>vestment plans will be needed to exp<strong>and</strong> the<br />
networks. To prepare these, water <strong>and</strong> sanitation<br />
master plans must first be updated to determ<strong>in</strong>e the<br />
most appropriate technical <strong>and</strong> economic options for<br />
exp<strong>and</strong><strong>in</strong>g <strong>in</strong>frastructure capacity, sett<strong>in</strong>g strategies<br />
<strong>and</strong> prioritiz<strong>in</strong>g projects with a pro-poor focus<br />
co<strong>in</strong>cident with the country’s poverty reduction efforts.<br />
However, <strong>in</strong> the case of Tegucigalpa, rapid population<br />
growth is concentrated <strong>in</strong> poor areas without public<br />
service connections. <strong>The</strong>refore, unless the trend of<br />
migration to the cities slows significantly (which is<br />
unlikely), latr<strong>in</strong>es will cont<strong>in</strong>ue to be the most practical<br />
sanitation alternative for peri-urban areas without<br />
connections to the city’s sewerage network.<br />
Two aspects should be taken <strong>in</strong>to account <strong>in</strong> order to<br />
improve sewerage services <strong>in</strong> the poor neighborhoods<br />
of Tegucigalpa: first, on-site sanitation options <strong>in</strong><br />
peri-urban areas should function effectively as a<br />
transitional solution until a more permanent technology<br />
is implemented. Second, the city’s master plan should<br />
<strong>in</strong>clude a pro-poor approach that ensures equal<br />
treatment among citizens <strong>and</strong> the gradual connection of<br />
peri-urban households to the city’s sewerage network.<br />
To this end, the follow<strong>in</strong>g should be addressed:<br />
a)<br />
Local organization <strong>and</strong> strengthen<strong>in</strong>g (<strong>Water</strong><br />
<strong>and</strong> <strong>Sanitation</strong> Boards). Community organization<br />
is essential for the development of poor city<br />
neighborhoods, <strong>and</strong> water <strong>and</strong> sanitation projects<br />
are more effective <strong>and</strong> susta<strong>in</strong>able where strong,<br />
tra<strong>in</strong>ed leadership exists. <strong>The</strong> <strong>Water</strong> <strong>and</strong> <strong>Sanitation</strong><br />
Sector Framework Law (2003) m<strong>and</strong>ates the<br />
establishment of community <strong>Water</strong> <strong>and</strong> <strong>Sanitation</strong><br />
Boards. To ensure their credibility <strong>and</strong> legitimacy,<br />
these should reflect pr<strong>in</strong>ciples of democracy, good<br />
governance, transparency <strong>and</strong> accountability,<br />
<strong>and</strong> be free from political <strong>in</strong>fluence. To achieve<br />
efficient, susta<strong>in</strong>able operation that benefits the<br />
whole community, the current model for <strong>Water</strong><br />
Boards should be adapted for urban conditions<br />
<strong>and</strong> <strong>in</strong>troduce sound pr<strong>in</strong>ciples of bus<strong>in</strong>ess<br />
management <strong>and</strong> adm<strong>in</strong>istration.<br />
Table 12<br />
<strong>Sanitation</strong> alternatives <strong>in</strong> Tegucigalpa<br />
Without a water supply<br />
connection<br />
Without<br />
connection<br />
to a sewerage<br />
network<br />
Non-poor --- ---<br />
With connection<br />
to a sewerage<br />
network<br />
without<br />
connection to a<br />
sewerage<br />
network<br />
On-site solution<br />
(septic tank,<br />
latr<strong>in</strong>e)<br />
Moderately poor Latr<strong>in</strong>es Latr<strong>in</strong>es Latr<strong>in</strong>es<br />
Extremely poor Latr<strong>in</strong>es Latr<strong>in</strong>es Latr<strong>in</strong>es<br />
With a water supply connection<br />
with connection<br />
to a sewerage<br />
network<br />
Sewerage<br />
network<br />
Low-cost<br />
network;<br />
Latr<strong>in</strong>es<br />
Low-cost<br />
network;<br />
Latr<strong>in</strong>es<br />
Subsidy<br />
designed to<br />
give the poor<br />
access to<br />
sanitation<br />
services<br />
---------<br />
Subsidy<br />
Subsidy<br />
Expansion of water<br />
<strong>and</strong> sanitation<br />
services<br />
20
)<br />
c)<br />
d)<br />
e)<br />
Promotion of sanitation <strong>and</strong> hygiene. An urban project<br />
model should be adopted that promotes sanitation <strong>and</strong><br />
hygiene based on local organization <strong>and</strong> <strong>in</strong>dividual<br />
responsibility, with reoriented <strong>in</strong>stitutional support.<br />
Technical st<strong>and</strong>ards for sanitation <strong>in</strong> peri-urban areas.<br />
Updated technical st<strong>and</strong>ards are needed for periurban<br />
sanitation systems. St<strong>and</strong>ards can help ensure<br />
all people’s access to effective, reliable <strong>and</strong> affordable<br />
sanitation solutions (latr<strong>in</strong>es, condom<strong>in</strong>ial networks,<br />
etc.).<br />
Ma<strong>in</strong>tenance of sanitation systems. Proven, effective<br />
local mechanisms are needed to ma<strong>in</strong>ta<strong>in</strong> latr<strong>in</strong>es <strong>in</strong><br />
peri-urban areas. With tra<strong>in</strong><strong>in</strong>g <strong>and</strong> seed f<strong>in</strong>anc<strong>in</strong>g,<br />
small community bus<strong>in</strong>esses could serve a potential<br />
market for build<strong>in</strong>g, ma<strong>in</strong>ta<strong>in</strong><strong>in</strong>g <strong>and</strong> empty<strong>in</strong>g latr<strong>in</strong>es,<br />
<strong>and</strong> for f<strong>in</strong>al waste disposal.<br />
A pro-poor approach <strong>in</strong> development plans for<br />
urban public services (master plans, programs <strong>and</strong><br />
projects). Local governments need sound plans for<br />
water <strong>and</strong> sanitation services that address urban<br />
growth tendencies. <strong>The</strong>se plans should harmonize<br />
the expansion of the water supply system with the<br />
expansion of the city’s sewerage network, especially <strong>in</strong><br />
poor neighborhoods. Moreover, they should promote<br />
improved service efficiency <strong>and</strong> <strong>in</strong>creased access of<br />
the poor to these services, with coherent f<strong>in</strong>anc<strong>in</strong>g<br />
<strong>and</strong> subsidy policies. <strong>The</strong> plans should also <strong>in</strong>clude<br />
the expansion of water <strong>and</strong> sanitation <strong>in</strong>frastructure<br />
<strong>and</strong> the development of specific projects for water <strong>and</strong><br />
sanitation service delivery.<br />
21
6. Considerations for a rural sanitation strategy<br />
<strong>The</strong> water <strong>and</strong> sanitation sector <strong>in</strong> <strong>Honduras</strong> def<strong>in</strong>es<br />
a rural community as one that does not have urban<br />
characteristics <strong>and</strong> has fewer than 2,000 <strong>in</strong>habitants.<br />
Population density is usually lower <strong>and</strong> families’<br />
economic capacity below those of urban residents.<br />
Sewerage networks with wastewater treatment plants<br />
are not a viable option, due to high <strong>in</strong>vestment costs<br />
<strong>and</strong> the tra<strong>in</strong><strong>in</strong>g needed to treat wastewater <strong>and</strong> prevent<br />
environmental contam<strong>in</strong>ation. As a result, on-site<br />
excreta disposal (septic tanks or latr<strong>in</strong>es) is prevalent <strong>in</strong><br />
rural areas.<br />
<strong>Honduras</strong> has two types of rural communities:<br />
concentrated <strong>and</strong> disperse. Concentrated rural<br />
communities have populations rang<strong>in</strong>g from 200 to<br />
2,000 people, while rural disperse communities have<br />
less than 200 <strong>in</strong>habitants.<br />
<strong>The</strong> national strategy to provide water <strong>and</strong> sanitation<br />
services <strong>in</strong> rural areas l<strong>in</strong>ks water supply services with<br />
latr<strong>in</strong>e construction <strong>and</strong> health <strong>and</strong> hygiene education,<br />
ma<strong>in</strong>ly target<strong>in</strong>g rural concentrated communities. <strong>The</strong><br />
major <strong>in</strong>vestment programs, such as FHIS, are based <strong>in</strong><br />
the capital <strong>and</strong> only a few have regional offices which<br />
are often located far from beneficiary communities.<br />
A key characteristic of <strong>in</strong>vestment projects is the<br />
variation allowed <strong>in</strong> per capita <strong>in</strong>vestment costs by<br />
community size. Generally, the smaller the population,<br />
the greater the per capita <strong>in</strong>vestment cost. A recent<br />
study on the implementation of one rural water <strong>and</strong><br />
sanitation <strong>in</strong>vestment program reported that <strong>in</strong> towns<br />
of between 1,000 <strong>and</strong> 2,000 <strong>in</strong>habitants, <strong>in</strong>vestment<br />
costs are less than US$ 100 per person, whereas for<br />
communities of between 250 <strong>and</strong> 1,000 people, costs<br />
can reach US$ 175 per person. For communities with<br />
fewer than 250 <strong>in</strong>habitants, costs can reach US$ 300<br />
per person. This cost distribution underscores the<br />
importance of consider<strong>in</strong>g all variables that can affect<br />
23<br />
<strong>in</strong>vestment costs, <strong>in</strong>clud<strong>in</strong>g for example:<br />
a) <strong>in</strong>stitutional arrangements for project implementation;<br />
b) technologies to be implemented; c) mechanisms to<br />
facilitate resource flow <strong>and</strong> transfers; <strong>and</strong> d) specific<br />
social <strong>and</strong> geographical characteristics of different<br />
rural areas. While these variables are important <strong>in</strong><br />
rural communities <strong>in</strong> general, they are crucial <strong>in</strong> rural<br />
dispersed hamlets.<br />
In light of the above, the present analysis is divided <strong>in</strong>to<br />
two parts: <strong>The</strong> first presents general characteristics of<br />
rural concentrated zones <strong>and</strong> some key considerations<br />
for improv<strong>in</strong>g their access to sanitation. <strong>The</strong> second<br />
part focuses on rural dispersed communities. <strong>The</strong><br />
analysis is based ma<strong>in</strong>ly on <strong>in</strong>formation from INE’s<br />
2001 National Population Census, which is not directly<br />
comparable with ENCOVI’s 2004 data, the ma<strong>in</strong><br />
reference for the rest of this report.<br />
23<br />
Assessment of the USAID Rural <strong>Water</strong> <strong>and</strong> <strong>Sanitation</strong> Program <strong>in</strong> <strong>Honduras</strong> - 1999 to the Present. Luis Moncada Gross (CDM) <strong>and</strong> Anthony Br<strong>and</strong> (ARD, Inc.), February 2006.<br />
22
Analysis of rural concentrated areas<br />
In 2001, the population of the rural concentrated areas<br />
was 2.08 million, distributed <strong>in</strong> approximately 4,700<br />
communities rang<strong>in</strong>g from 200 to 2,000 <strong>in</strong>habitants<br />
24<br />
each. Graph 9 presents the distribution of communities<br />
by size (number of <strong>in</strong>habitants).<br />
This graph demonstrates that most of the communities<br />
<strong>in</strong> this category are small. 310 communities (6.6% of<br />
the rural concentrated communities) have between<br />
1,000 <strong>and</strong> 2,000 <strong>in</strong>habitants, with a total population of<br />
410,000. By contrast, 4,400 communities (93.6% of the<br />
rural concentrated communities) have fewer than 1,000<br />
<strong>in</strong>habitants, together total<strong>in</strong>g 1.67 million people.<br />
2,500<br />
Graph 9<br />
Concentrated rural comunities<br />
Distribution of villages from 200 to 2,000 <strong>in</strong>habitants<br />
2,000<br />
Concentrated Rural:<br />
Number of Communities = 4,712<br />
Total Population = 2,078,533 <strong>in</strong>hab.<br />
Size of community (<strong>in</strong>habitants)<br />
1,500<br />
1,000<br />
500<br />
Population range generally used<br />
to select communities for<br />
<strong>in</strong>vestment programs<br />
0<br />
0 500 1,000 1,500 2,000 2,500 3,000 3,500 4,000 4,500 5,000<br />
Figure prepared us<strong>in</strong>g INE 2001 Census data.<br />
del INE<br />
Number of communities<br />
24<br />
Data calculated with <strong>in</strong>formation from the INE 2001 National Census.<br />
23
Rural <strong>in</strong>frastructure construction has <strong>in</strong>creased s<strong>in</strong>ce<br />
1980, <strong>and</strong> was especially <strong>in</strong>tense after Hurricane<br />
Mitch <strong>in</strong> 1998. Investments have ma<strong>in</strong>ly targeted rural<br />
concentrated communities, s<strong>in</strong>ce a commonly used<br />
selection criterion for <strong>in</strong>vestment programs build<strong>in</strong>g<br />
articulated water supplies is a population of between<br />
200 <strong>and</strong> 2,000 <strong>in</strong>habitants. This has resulted <strong>in</strong> most<br />
rural concentrated communities hav<strong>in</strong>g water supply<br />
systems <strong>and</strong> sanitation solutions.<br />
An <strong>in</strong>ventory of rural <strong>and</strong> water sanitation systems<br />
25<br />
carried out by SANAA between 1999 <strong>and</strong> 2002<br />
identified 4,200 communities with water <strong>and</strong> sanitation<br />
26<br />
systems <strong>in</strong> 2001, <strong>and</strong> 4,500 <strong>in</strong> 2002. Compar<strong>in</strong>g<br />
these figures with the number of communities <strong>in</strong> the<br />
rural concentrated strata of the 2001 census (4,712<br />
communities) reveals that at that time, between 89%<br />
<strong>and</strong> 96% of all concentrated rural communities had<br />
reportedly received sanitation <strong>in</strong>vestments.<br />
<strong>The</strong> rural concentrated area has a high level of access<br />
to sanitation <strong>in</strong>frastructure. Selection criteria favor large<br />
communities over smaller ones, <strong>and</strong> it is probable that a<br />
large percentage of those communities without access<br />
are found at the lower end of the population range (200<br />
<strong>in</strong>habitants <strong>and</strong> below).<br />
<strong>The</strong> focus on sanitation <strong>in</strong> rural concentrated areas has<br />
three ma<strong>in</strong> components: a) improv<strong>in</strong>g <strong>in</strong>dividual <strong>and</strong><br />
family sanitary practices through sanitation <strong>and</strong> hygiene<br />
promotion <strong>and</strong> education; b) rehabilitat<strong>in</strong>g damaged<br />
<strong>in</strong>frastructure while creat<strong>in</strong>g local/family capacity<br />
for self-management; <strong>and</strong> c) facilitat<strong>in</strong>g access to<br />
sanitation for households without service.<br />
Consider<strong>in</strong>g that project implementation by centralized<br />
organizations <strong>and</strong> structures is costly <strong>and</strong> less effective<br />
for these types of <strong>in</strong>terventions, progress <strong>in</strong> the three<br />
areas mentioned above requires new <strong>in</strong>stitutional<br />
schemes. <strong>The</strong> community must adopt new, more<br />
active roles. Programs should facilitate community<br />
organization, tra<strong>in</strong><strong>in</strong>g <strong>and</strong> local management capacities<br />
(through promotion, technical assistance <strong>and</strong> material<br />
resources).<br />
25 Assessment of the USAID Rural <strong>Water</strong> <strong>and</strong> <strong>Sanitation</strong> Program <strong>in</strong> <strong>Honduras</strong>. 1999 to the Present. Luis Moncada Gross (CDM) <strong>and</strong><br />
Anthony Br<strong>and</strong> (ARD Inc.), pg. 35.<br />
26 Analysis of the <strong>Water</strong> <strong>and</strong> <strong>Sanitation</strong> Sector <strong>in</strong> <strong>Honduras</strong>. Infrastructure <strong>and</strong> Service Component <strong>in</strong> Rural Areas. Ricardo Mairena.<br />
<strong>Water</strong> <strong>and</strong> <strong>Sanitation</strong> Program, Pan American Health Organization. March 2003, pg. 36.<br />
24
<strong>The</strong> strategy for this segment of the population should<br />
<strong>in</strong>clude at least the follow<strong>in</strong>g elements, which proved<br />
very effective <strong>in</strong> the recent FHIS water <strong>and</strong> sanitation<br />
27<br />
pilot project, <strong>and</strong> have also been practiced by several<br />
NGO programs.<br />
a)<br />
b)<br />
<strong>Water</strong> <strong>and</strong> <strong>Sanitation</strong> Boards. <strong>The</strong>se boards<br />
<strong>and</strong> their sanitation committees can play a key<br />
role <strong>in</strong> improv<strong>in</strong>g sanitation <strong>and</strong> the susta<strong>in</strong>ability<br />
of services <strong>in</strong> their communities. Congruent with<br />
the <strong>Water</strong> <strong>and</strong> <strong>Sanitation</strong> Sector Framework Law,<br />
communities now own their <strong>in</strong>frastructure <strong>and</strong> their<br />
elected boards manage their services. <strong>The</strong>se play<br />
a key role as leaders <strong>in</strong> promot<strong>in</strong>g sanitation <strong>in</strong><br />
their communities <strong>and</strong> should manage sanitation<br />
projects, thereby facilitat<strong>in</strong>g local empowerment.<br />
<strong>Sanitation</strong> Technicians. <strong>Honduras</strong> has used<br />
technicians <strong>in</strong> promotion, community organization,<br />
local tra<strong>in</strong><strong>in</strong>g <strong>and</strong> project implementation.<br />
SANAA has water <strong>and</strong> sanitation technicians<br />
to implement projects <strong>and</strong> operation <strong>and</strong><br />
ma<strong>in</strong>tenance technicians to provide technical<br />
assistance to local water boards. <strong>The</strong> M<strong>in</strong>istry of<br />
Health has environmental health technicians with<br />
responsibilities that <strong>in</strong>clude dr<strong>in</strong>k<strong>in</strong>g water quality<br />
<strong>and</strong> environmental sanitation. Various <strong>in</strong>stitutions <strong>in</strong><br />
the sector are consider<strong>in</strong>g def<strong>in</strong><strong>in</strong>g <strong>and</strong> promot<strong>in</strong>g<br />
municipal water <strong>and</strong> sanitation technicians<br />
who would be employees of a municipality or<br />
association of municipalities <strong>and</strong> provide technical<br />
assistance to rural communities. <strong>The</strong> idea is for<br />
the sector to def<strong>in</strong>e a profile for a technician that<br />
could be a st<strong>and</strong>ard model for tra<strong>in</strong><strong>in</strong>g exist<strong>in</strong>g<br />
<strong>and</strong> new technicians resid<strong>in</strong>g <strong>in</strong> the municipalities<br />
or regions where they work. Recognition of the<br />
importance of water <strong>and</strong> sanitation technicians by<br />
sector actors will be essential for achiev<strong>in</strong>g the<br />
goals of any national sector plan or strategy.<br />
c)<br />
d)<br />
Municipalities <strong>and</strong> communities. <strong>The</strong>se can<br />
facilitate the implementation of projects to improve<br />
sanitation by channel<strong>in</strong>g material resources to<br />
projects, support<strong>in</strong>g tra<strong>in</strong><strong>in</strong>g <strong>and</strong> other activities.<br />
A system for evaluat<strong>in</strong>g municipal capacity would<br />
need to be developed, as well as models for local<br />
agreements, community participation, operat<strong>in</strong>g<br />
procedures, monitor<strong>in</strong>g <strong>and</strong> social audit<strong>in</strong>g.<br />
Non-governmental organizations. <strong>The</strong>se already<br />
play a key role as project implementers or as<br />
program facilitators <strong>and</strong> tra<strong>in</strong>ers with municipalities<br />
or communities.<br />
Methodological tools for projects should be<br />
st<strong>and</strong>ardized to improve sanitation <strong>in</strong> rural concentrated<br />
communities. St<strong>and</strong>ardized tools could <strong>in</strong>clude:<br />
I)<br />
II)<br />
III)<br />
IV)<br />
V)<br />
VI)<br />
Methodologies to assess the state of sanitation<br />
<strong>in</strong>frastructure.<br />
Methodologies to identify local practices <strong>and</strong><br />
preferences regard<strong>in</strong>g sanitation <strong>and</strong> hygiene.<br />
Models for promotion of <strong>and</strong> education <strong>in</strong><br />
sanitation <strong>and</strong> hygiene.<br />
Mechanisms to channel resources to the local<br />
level (materials, services, f<strong>in</strong>ances).<br />
Models for develop<strong>in</strong>g <strong>and</strong> implement<strong>in</strong>g projects<br />
to improve local sanitation.<br />
Models to strengthen <strong>and</strong> tra<strong>in</strong> rural <strong>Water</strong> <strong>and</strong><br />
<strong>Sanitation</strong> Boards.<br />
In order to prioritize zones for attention with<strong>in</strong> a<br />
municipality or region, the state of sanitation <strong>in</strong> rural<br />
communities must first be assessed. SANAA, Health<br />
M<strong>in</strong>istry, NGO <strong>and</strong>/or municipal technicians could<br />
collect <strong>in</strong>formation dur<strong>in</strong>g periodic community visits, as<br />
described <strong>in</strong> the monitor<strong>in</strong>g section of this document.<br />
Ideally, all agencies <strong>and</strong> local actors would coord<strong>in</strong>ate<br />
the collection <strong>and</strong> analysis of <strong>in</strong>formation to identify<br />
priority zones.<br />
27<br />
<strong>The</strong> World Bank. Implementation Completion Report. Fifth Social Investment Fund Project. September, 2006. Tegucigalpa, <strong>Honduras</strong>.<br />
25
Analysis of the rural dispersed area<br />
In 2001, there were 1.2 million people liv<strong>in</strong>g <strong>in</strong> rural<br />
dispersed hamlets, distributed <strong>in</strong> 20,400 communities<br />
28<br />
with fewer than 200 <strong>in</strong>habitants each. Graph 10<br />
presents the distribution of these by size (number of<br />
<strong>in</strong>habitants).<br />
rural dispersed strata are composed of 40 or fewer<br />
households. Population density tends to be low <strong>in</strong> these<br />
communities <strong>and</strong> the dispersion of their dwell<strong>in</strong>gs<br />
greater.<br />
250<br />
Graph 10<br />
Dispersed rural communities<br />
Distribution of Villages with Fewer than 200 Inhabitants<br />
<strong>The</strong> figure shows that the distribution of communities<br />
<strong>in</strong> this stratum follows the same pattern as that of<br />
rural concentrated communities. Smaller communities<br />
account for a larger percentage of the total number. In<br />
these communities, dispersion is greater <strong>and</strong> access by<br />
road tends to be more difficult, <strong>in</strong>creas<strong>in</strong>g <strong>in</strong>tervention<br />
costs.<br />
Community size (<strong>in</strong>habitants)<br />
200<br />
150<br />
100<br />
50<br />
Dispersed Rural:<br />
Number of communities = 20,393<br />
Total population = 1,202,384 <strong>in</strong>hab.<br />
Table 13 lists communities by size. With an estimated<br />
5.2 <strong>in</strong>habitants per household, communities <strong>in</strong> the<br />
0<br />
0 5,000 10,000 15,000 20,000<br />
Number of communities<br />
Figure prepared us<strong>in</strong>g INE 2001 Census Data<br />
del INE<br />
Table 13<br />
Ranges for population <strong>and</strong> households<br />
<strong>in</strong> communities with fewer than 200 <strong>in</strong>habitants<br />
Range<br />
(number<br />
of homes)<br />
M<strong>in</strong>imum<br />
population<br />
(1)<br />
Maximum<br />
population<br />
(1)<br />
No. of<br />
communities<br />
(2)<br />
Total no. of<br />
communities<br />
Population<br />
(2)<br />
Total<br />
population<br />
36 to 40 183 208 525 525 100,111 100,111<br />
31 to 35 157 182 889 1,414 150,150 250,261<br />
26 to 30 131 156 1,182 2,596 169,227 419,488<br />
21 to 25 105 130 1,490 4,086 173,359 592,847<br />
16 to 20 79 104 1,871 5,957 170,182 763,029<br />
11 to 15 53 78 2,667 8,624 171,721 934,750<br />
6 to 10 27 52 4,293 12,917 165,136 1,099,886<br />
1 to 5 5 26 7,513 20,430 103,562 1,203,448<br />
TOTAL<br />
(1) Estimated population consider<strong>in</strong>g a density of 5.2 <strong>in</strong>habitants per household<br />
(2) INE 2001 National Census<br />
20,430 1,203,448<br />
28 Data from the INE 2001 National Census.<br />
26
Analyz<strong>in</strong>g communities sorted by size from largest<br />
to smallest, one sees that for a constant number of<br />
communities served, population dim<strong>in</strong>ishes. This can<br />
be seen <strong>in</strong> Graph 11, prepared with 2001 National<br />
Census data for the population range correspond<strong>in</strong>g to<br />
the rural dispersed strata. <strong>The</strong> population of the largest<br />
5,000 communities (number 1 <strong>in</strong> the follow<strong>in</strong>g graph)<br />
represents 100%. For the next largest group of 5,000<br />
communities (number 2 <strong>in</strong> the graph), the population<br />
decl<strong>in</strong>es to 47%. For the next group (number 3 <strong>in</strong> the<br />
graph), the population is just 18% of that of the first<br />
group. In the last group, the population is only 10% of<br />
that of the first group of communities<br />
Accumulated Population<br />
1,200,000<br />
1,000,000<br />
800,000<br />
600,000<br />
400,000<br />
200,000<br />
1<br />
Graph 11<br />
Dispersed rural area<br />
Decreasign yield <strong>in</strong> population ranges<br />
2<br />
3<br />
1.... 100%<br />
2.... 47%<br />
3.... 18%<br />
4.... 10%<br />
4<br />
Table 13 above demonstrates that communities of<br />
between 20 <strong>and</strong> 40 households each (100 to 200<br />
<strong>in</strong>habitants) would total some 4,000 rural dispersed<br />
hamlets with a population of 600,000 for the year 2001,<br />
represent<strong>in</strong>g 50% of the total population of the rural<br />
dispersed strata nationally. <strong>The</strong> rema<strong>in</strong><strong>in</strong>g 50% of families<br />
lives <strong>in</strong> 16,000 communities of fewer than 20 households<br />
each.<br />
0<br />
0 5,000 10,000 15,000 20,000<br />
Number of communities<br />
Reach<strong>in</strong>g people liv<strong>in</strong>g <strong>in</strong> communities of between 100<br />
<strong>and</strong> 200 <strong>in</strong>habitants would require a sector strategy<br />
that <strong>in</strong>cludes additional elements to those previously<br />
described for rural concentrated areas, <strong>in</strong>clud<strong>in</strong>g: a)<br />
participation of tra<strong>in</strong>ed <strong>Water</strong> <strong>and</strong> <strong>Sanitation</strong> Boards <strong>in</strong><br />
rural concentrated villages to support sanitation projects<br />
<strong>in</strong> neighbor<strong>in</strong>g rural dispersed hamlets; b) participation<br />
of the municipality <strong>in</strong> the dissem<strong>in</strong>ation of <strong>in</strong>formation<br />
on rural sanitation; c) adaptation of simplified, low-cost<br />
sanitation solutions us<strong>in</strong>g local materials that permit<br />
household-level management; <strong>and</strong> d) <strong>in</strong>formation <strong>and</strong><br />
education campaigns us<strong>in</strong>g media that reach the target<br />
population, such as radio, local health centers <strong>and</strong><br />
schools.<br />
27
7. Investment, f<strong>in</strong>anc<strong>in</strong>g <strong>and</strong> subsidies for sanitation<br />
An estimated US$ 263 million is needed to achieve<br />
the Millennium Development Goals for sanitation <strong>in</strong><br />
29<br />
<strong>Honduras</strong>, without consider<strong>in</strong>g wastewater treatment.<br />
Of this amount, 12.1% (US$ 32 million) would need to<br />
be <strong>in</strong>vested <strong>in</strong> rural sanitation – ma<strong>in</strong>ly latr<strong>in</strong>es – <strong>and</strong><br />
87.9% (US$ 231 million) would be needed for urban<br />
31<br />
sanitation.<br />
<strong>The</strong> <strong>in</strong>vestment required <strong>in</strong> urban sanitation<br />
<strong>in</strong>frastructure would consist of exp<strong>and</strong><strong>in</strong>g exist<strong>in</strong>g<br />
networks <strong>and</strong> <strong>in</strong>creas<strong>in</strong>g on-site solutions (latr<strong>in</strong>es) <strong>in</strong><br />
peri-urban areas. Connections to sewerage networks<br />
are significantly more expensive than latr<strong>in</strong>es. Per<br />
household costs of a connection to sewerage network<br />
can be two to seven times higher than the cost of a<br />
32<br />
latr<strong>in</strong>e.<br />
In rural areas, latr<strong>in</strong>e construction has been partially<br />
funded by subsidies <strong>and</strong> local contributions.<br />
30<br />
Communities provide manual labor <strong>and</strong> some local<br />
materials, while receiv<strong>in</strong>g most build<strong>in</strong>g materials at no<br />
cost from social <strong>in</strong>vestment programs.<br />
In contrast to rural sanitation, latr<strong>in</strong>es <strong>in</strong> peri-urban<br />
areas are usually built us<strong>in</strong>g family resources, or <strong>in</strong><br />
some cases with subsidies <strong>and</strong> funds from <strong>in</strong>vestment<br />
programs with peri-urban sanitation components.<br />
Urban sewerage networks are sometimes constructed<br />
with private resources by developers who recover their<br />
<strong>in</strong>vestment through the sale of lots or homes. Municipal<br />
funds are also used to build sewerage networks,<br />
f<strong>in</strong>anced through taxes <strong>and</strong> user contributions for<br />
improvements. <strong>The</strong> ma<strong>in</strong> urban sewerage networks<br />
(collectors, <strong>in</strong>terceptors, pump<strong>in</strong>g stations, etc.) have<br />
traditionally been f<strong>in</strong>anced with non-reimbursable<br />
municipal funds.<br />
28<br />
29 Sector Programm<strong>in</strong>g based on the National <strong>Poverty</strong> Reduction Strategy Targets. CONASA, 2005.<br />
30 <strong>The</strong> target adopted for wastewater treatment is 50% of the total volume of wastewater generated, which would require an additional <strong>in</strong>vestment of US$ 173 million.<br />
31<br />
This <strong>in</strong>vestment <strong>in</strong>cludes only sanitation. <strong>The</strong> <strong>in</strong>vestment correspond<strong>in</strong>g to water supply for the same period is US$ 54.7 million for rural areas <strong>and</strong> US$ 567.3 million for urban areas. From Sector<br />
Programm<strong>in</strong>g based on the National <strong>Poverty</strong> Reduction Strategy Targets. CONASA, January 2005.<br />
32 Data on household costs is from FHIS; per capita costs are from the 2006 UNDP Human Development Report. Per capita cost for a latr<strong>in</strong>e is US$ 66. Per capita cost for a connection to a<br />
sewerage network is US$ 170.
Few funds or programs exist <strong>in</strong> <strong>Honduras</strong> to f<strong>in</strong>ance water <strong>and</strong> sanitation projects through reimbursable credits to urban<br />
neighborhoods or rural communities. Nevertheless, a limited number of <strong>Water</strong> Boards have developed projects with<br />
credits <strong>and</strong> technical assistance from SANAA, the Tegucigalpa Chamber of Commerce or NGOs. <strong>The</strong> great majority of<br />
33<br />
these communities repay these funds on time, <strong>and</strong> many do so ahead of schedule.<br />
33<br />
Examples of loans obta<strong>in</strong>ed for community projects <strong>in</strong>clude the neighborhoods of Villa Crist<strong>in</strong>a <strong>and</strong> Villafranca <strong>in</strong> Tegucigalpa, whose <strong>Water</strong> Boards are mak<strong>in</strong>g<br />
their loan payments seven months early.<br />
29
8. Monitor<strong>in</strong>g <strong>and</strong> <strong>in</strong>stitutional support for<br />
susta<strong>in</strong>able sanitation services<br />
<strong>The</strong> build<strong>in</strong>g of sanitation <strong>in</strong>frastructure <strong>in</strong> rural <strong>and</strong> periurban<br />
communities is by itself <strong>in</strong>sufficient for achiev<strong>in</strong>g<br />
environmental sanitation <strong>and</strong> improv<strong>in</strong>g health. Health<br />
promotion <strong>and</strong> sanitary education are also essential<br />
for chang<strong>in</strong>g a community’s unsafe hygiene practices.<br />
But even with these elements <strong>in</strong> place, monitor<strong>in</strong>g is<br />
necessary to provide the support needed by the poor.<br />
If a significant percentage of households does not have<br />
sanitation services, or does not always use them or<br />
uses them <strong>in</strong>correctly, the overall benefits of sanitation<br />
<strong>in</strong> the community will be threatened. This also occurs<br />
where sanitation <strong>in</strong>frastructure has deteriorated from<br />
use or age. <strong>Sanitation</strong> practices, conditions <strong>and</strong><br />
<strong>in</strong>frastructure must be periodically monitored <strong>and</strong><br />
evaluated <strong>in</strong> rural <strong>and</strong> peri-urban communities. Effective<br />
monitor<strong>in</strong>g can facilitate timely technical assistance to<br />
ma<strong>in</strong>ta<strong>in</strong> adequate sanitation <strong>in</strong> a community or family.<br />
In <strong>Honduras</strong>, monitor<strong>in</strong>g <strong>and</strong> technical assistance<br />
could take place from the local level to the central<br />
level <strong>and</strong> vice versa. Rural communities that have<br />
water <strong>and</strong> sanitation boards have a sound base from<br />
which to build local capacity to create <strong>and</strong> susta<strong>in</strong><br />
rural sanitation solutions. At the central/<strong>in</strong>stitutional<br />
level, SANAA has valuable experience with operation<br />
<strong>and</strong> ma<strong>in</strong>tenance technicians <strong>and</strong> the M<strong>in</strong>istry of<br />
Health with its environmental health technicians, both<br />
of whom support rural services through programmed<br />
community visits. <strong>The</strong> SANAA program has a team of<br />
80 technicians tra<strong>in</strong>ed <strong>in</strong> most areas of basic operation<br />
<strong>and</strong> ma<strong>in</strong>tenance of water <strong>and</strong> sanitation systems.<br />
Each technician is assigned about 50 communities<br />
or systems for regular visits, for a total coverage of<br />
approximately 4,000 rural systems. While the program<br />
has operated for more than a decade, to be effective<br />
nationally it will require more personnel <strong>and</strong> logistical<br />
support, as well as additional tra<strong>in</strong><strong>in</strong>g <strong>in</strong> management,<br />
supervision, evaluation, monitor<strong>in</strong>g <strong>and</strong> technical<br />
assistance for rural basic sanitation.<br />
Health <strong>and</strong> its approximately 700 environmental health<br />
technicians to strengthen monitor<strong>in</strong>g <strong>and</strong> technical<br />
assistance <strong>in</strong> sanitation. No national policy yet exists<br />
for shar<strong>in</strong>g this type of <strong>in</strong>stitutional support, nor is there<br />
an official model <strong>in</strong> practice to be replicated. A detailed<br />
<strong>in</strong>stitutional support system should be developed<br />
<strong>and</strong> be compatible with sector reforms, the <strong>Water</strong><br />
<strong>and</strong> <strong>Sanitation</strong> Sector Framework Law <strong>and</strong> national<br />
decentralization policies.<br />
In peri-urban zones, monitor<strong>in</strong>g of sanitation conditions<br />
<strong>and</strong> cont<strong>in</strong>ued support are equally important. Given the<br />
higher population density <strong>and</strong> limited space available<br />
for sanitation <strong>in</strong>frastructure, urban sanitation is often<br />
more complex <strong>and</strong> can pose greater health risks. <strong>The</strong><br />
water <strong>and</strong> sanitation board model is not fully developed<br />
for poor urban neighborhoods <strong>and</strong> <strong>in</strong> some cases may<br />
not be compatible with centralized service delivery.<br />
Too often, weak or politicized community organizations<br />
<strong>and</strong> a lack of <strong>in</strong>stitutional support result <strong>in</strong> poor<br />
management <strong>and</strong> <strong>in</strong>sufficient capacity to fulfill their<br />
potential. <strong>Water</strong> <strong>and</strong> <strong>Sanitation</strong> Board models <strong>and</strong> their<br />
<strong>in</strong>stitutional support mechanisms should be modified<br />
to effectively respond to needs <strong>in</strong> peri-urban areas,<br />
emphasiz<strong>in</strong>g sound bus<strong>in</strong>ess management, democracy,<br />
transparency, good governance <strong>and</strong> accountability.<br />
Sector actors could also coord<strong>in</strong>ate with the M<strong>in</strong>istry of<br />
30
9. Conclusions <strong>and</strong> recommendations<br />
1)<br />
2)<br />
3)<br />
<strong>The</strong> analysis of the l<strong>in</strong>kage between poverty <strong>and</strong><br />
access to basic sanitation <strong>in</strong> <strong>Honduras</strong> leads to the<br />
follow<strong>in</strong>g conclusions <strong>and</strong> recommendations:<br />
Prioritize pro-poor policies designed to facilitate<br />
their access to improved <strong>and</strong> susta<strong>in</strong>able sanitation<br />
services.<br />
This priority should be reflected <strong>in</strong> sector, municipal<br />
<strong>and</strong> <strong>in</strong>stitutional policies, <strong>in</strong>corporate criteria that<br />
promote access of the poor to sanitation, <strong>and</strong> be<br />
applied <strong>in</strong> all technical <strong>and</strong> operational plann<strong>in</strong>g,<br />
<strong>in</strong> f<strong>in</strong>ancial policies <strong>and</strong> <strong>in</strong> norms for projects <strong>and</strong><br />
service delivery. <strong>The</strong> new <strong>Water</strong> <strong>and</strong> <strong>Sanitation</strong> Sector<br />
Framework Law stipulates that the National <strong>Water</strong><br />
<strong>and</strong> <strong>Sanitation</strong> Council (CONASA) is responsible for<br />
develop<strong>in</strong>g a national policy framework, from which<br />
other actors <strong>and</strong> municipalities should develop<br />
<strong>in</strong>stitutional <strong>and</strong> local policies <strong>and</strong> norms for municipal<br />
project management, service provision <strong>and</strong> regulation.<br />
Adopt appropriate <strong>and</strong> <strong>in</strong>novative technologies<br />
<strong>and</strong> methodologies for <strong>in</strong>frastructure <strong>and</strong> service<br />
management, for the creation of susta<strong>in</strong>able basic<br />
services <strong>and</strong> for technical support.<br />
Functionality, reliability, durability <strong>and</strong> cost are key<br />
considerations for creat<strong>in</strong>g <strong>in</strong>frastructure, especially<br />
where families live below the poverty l<strong>in</strong>e. <strong>The</strong><br />
selection of appropriate, proven technologies is<br />
essential; CONASA’s Technical Secretariat could<br />
develop st<strong>and</strong>ards <strong>and</strong> implement their promotion <strong>and</strong><br />
dissem<strong>in</strong>ation nationally. It is equally important that<br />
appropriate technologies be researched <strong>and</strong> adapted<br />
to contribute to technical issues such as system<br />
operation <strong>and</strong> ma<strong>in</strong>tenance, <strong>and</strong> to improve service<br />
management, f<strong>in</strong>anc<strong>in</strong>g, account<strong>in</strong>g <strong>and</strong> commercial<br />
aspects.<br />
Stimulate the participation of civil society organizations<br />
<strong>in</strong> decision mak<strong>in</strong>g <strong>and</strong> service management.<br />
Participation of community-based organizations is an<br />
essential element <strong>in</strong> <strong>in</strong>creas<strong>in</strong>g access of the poor to<br />
sanitation <strong>and</strong> <strong>in</strong> improv<strong>in</strong>g the efficiency of service<br />
4)<br />
5)<br />
management, both <strong>in</strong> urban <strong>and</strong> rural sett<strong>in</strong>gs. This<br />
participation should take place <strong>in</strong> a framework of<br />
good governance, transparency <strong>and</strong> accountability,<br />
where representative community organizations are<br />
responsible for high-level decision-mak<strong>in</strong>g.<br />
Although CONASA is responsible for develop<strong>in</strong>g<br />
general sector policies <strong>and</strong> strategies <strong>and</strong> for<br />
prepar<strong>in</strong>g operational models <strong>and</strong> <strong>in</strong>struments,<br />
specific local strategies <strong>and</strong> activities are the<br />
responsibility of all sector actors <strong>and</strong> municipalities.<br />
Promotion, education <strong>and</strong> capacity build<strong>in</strong>g should<br />
be fundamental elements of a nation-wide sanitation<br />
promotion program <strong>in</strong>volv<strong>in</strong>g all public <strong>and</strong> private<br />
sector actors.<br />
Involve the coord<strong>in</strong>ated participation of nongovernmental<br />
organizations <strong>and</strong> <strong>in</strong>ternational<br />
cooperation agencies <strong>in</strong> develop<strong>in</strong>g sanitation<br />
programs.<br />
Mechanisms for dialogue <strong>and</strong> communication<br />
among different actors of the water <strong>and</strong> sanitation<br />
sector exist <strong>in</strong> <strong>Honduras</strong>, <strong>and</strong> coord<strong>in</strong>ation among<br />
non-governmental organizations, governmental <strong>and</strong><br />
<strong>in</strong>ternational agencies is essential for the success<br />
of efforts <strong>and</strong> <strong>in</strong>vestments for improv<strong>in</strong>g services<br />
for the poor. A national plan should be developed<br />
for ongo<strong>in</strong>g coord<strong>in</strong>ation with non-governmental<br />
organizations <strong>and</strong> <strong>in</strong>ternational agencies. A sector<br />
<strong>in</strong>formation system that foments the production <strong>and</strong><br />
management of knowledge useful <strong>in</strong> decision-mak<strong>in</strong>g<br />
<strong>and</strong> coord<strong>in</strong>at<strong>in</strong>g actions is also needed.<br />
Create a system to monitor the progress of sanitation<br />
programs.<br />
Preparation of a national plan requires establish<strong>in</strong>g<br />
monitor<strong>in</strong>g mechanisms, which could be designed<br />
<strong>and</strong> implemented by CONASA’s Technical Secretariat.<br />
It is equally important to consider an <strong>in</strong>formation<br />
system for the sector that would facilitate the<br />
monitor<strong>in</strong>g of programs’ <strong>and</strong> sector progress <strong>in</strong><br />
improv<strong>in</strong>g sanitation. Both the national plan <strong>and</strong> the<br />
sector <strong>in</strong>formation system are essential elements.<br />
31
Bibliography<br />
1.<br />
2.<br />
3.<br />
4.<br />
5.<br />
6.<br />
Br<strong>and</strong>, Anthony. 2003. Healthy Home <strong>and</strong> School: A<br />
Successful Experience <strong>in</strong> <strong>Honduras</strong>. Field Note. <strong>Water</strong><br />
<strong>and</strong> <strong>Sanitation</strong> Program. <strong>Honduras</strong>.<br />
Brikke Francois <strong>and</strong> Maarten Bredero. 2001. L<strong>in</strong>k<strong>in</strong>g<br />
Technology Choice with Operation <strong>and</strong> Ma<strong>in</strong>tenance.<br />
World Health Organization, IRC International <strong>Water</strong><br />
<strong>and</strong> <strong>Sanitation</strong> Centre, Operation <strong>and</strong> Ma<strong>in</strong>tenance<br />
Network of the <strong>Water</strong> Supply <strong>and</strong> <strong>Sanitation</strong><br />
Collaborative Council.<br />
CONASA (National <strong>Water</strong> <strong>and</strong> <strong>Sanitation</strong> Council).<br />
2005. Sector Programm<strong>in</strong>g Based on the National<br />
<strong>Poverty</strong> Reduction Strategy Targets. <strong>Honduras</strong>.<br />
INE (National Institute of Statistics). 2006. Permanent<br />
Household Survey. Thirty-second survey of the<br />
Household Survey Program. <strong>Honduras</strong>.<br />
INE (National Institute of Statistics). 2004. National<br />
Liv<strong>in</strong>g St<strong>and</strong>ards Survey. <strong>Honduras</strong>.<br />
INE (National Institute of Statistics). 2001. 2001<br />
National Population Census. <strong>Honduras</strong>.<br />
9.<br />
10.<br />
11.<br />
12.<br />
13.<br />
14.<br />
NJS Consultants Co. Ltd. 2005. Assessment of the<br />
Situation of Basic Services <strong>in</strong> Poor Rural Communities<br />
<strong>and</strong> Urban Zones of <strong>Honduras</strong>. <strong>Water</strong> <strong>and</strong> <strong>Sanitation</strong><br />
Program. <strong>Honduras</strong>.<br />
UNDP (United Nations Development Programme).<br />
2006. Human Development Report.<br />
World Bank. 2002. Urban Service Delivery <strong>and</strong> the<br />
Poor. Report No. 22590, Volumes I <strong>and</strong> II.<br />
Wash<strong>in</strong>gton DC.<br />
World Bank <strong>Water</strong> <strong>and</strong> <strong>Sanitation</strong> Program. 2005.<br />
Hygiene, <strong>Sanitation</strong> <strong>and</strong> <strong>Water</strong>: Introduction to the<br />
Web-based Toolkit, www.schoolsanitation.org.<br />
World Bank. 2006. <strong>Honduras</strong>: <strong>Poverty</strong> Assessment.<br />
Atta<strong>in</strong><strong>in</strong>g <strong>Poverty</strong> Reduction. Report No. 35622-HN,<br />
Volumes I <strong>and</strong> II. Wash<strong>in</strong>gton DC.<br />
World Health Organization. 1992. A Guide to the<br />
Development of On-Site <strong>Sanitation</strong>.<br />
7.<br />
8.<br />
Mairena, Ricardo. 2003. Analysis of the <strong>Water</strong><br />
<strong>and</strong> <strong>Sanitation</strong> Sector <strong>in</strong> <strong>Honduras</strong>: Infrastructure<br />
<strong>and</strong> Service Component <strong>in</strong> Rural Areas. <strong>Water</strong><br />
<strong>and</strong> <strong>Sanitation</strong> Program <strong>and</strong> Pan American Health<br />
Organization. <strong>Honduras</strong>.<br />
Moncada Gross, Luis <strong>and</strong> Anthony Br<strong>and</strong>. 2006.<br />
Assessment of the USAID Rural <strong>Water</strong> <strong>and</strong> <strong>Sanitation</strong><br />
Program <strong>in</strong> <strong>Honduras</strong> from 1999 to the Present.<br />
<strong>Honduras</strong>.<br />
32
<strong>Water</strong> <strong>and</strong> <strong>Sanitation</strong> Program<br />
Lat<strong>in</strong> America <strong>and</strong> the Caribbean Region<br />
Sub Regional Office for Central America<br />
World Bank Office<br />
Centro F<strong>in</strong>anciero Uno, 4to Piso<br />
Colonia Payaqui, Blvd. San Juan Bosco<br />
Tegucigalpa, <strong>Honduras</strong><br />
Tel: (504) 239-4551<br />
Fax: (504) 239-4555<br />
wsplac@worldbank.org<br />
www.wsp.org