Strong Breakthrough - Masan Group
Strong Breakthrough - Masan Group
Strong Breakthrough - Masan Group

Create successful ePaper yourself
Turn your PDF publications into a flip-book with our unique Google optimized e-Paper software.
NOTES TO THE CONSOLIDATED<br />
FINANCIAL STATEMENTS (continued)<br />
NOTES TO THE CONSOLIDATED FINANCIAL STATEMENTS (continued)<br />
For the year ended 31 December 2010<br />
Form B05/TCTD-HN<br />
For the year ended 31 December 2010<br />
Form B05/TCTD-HN<br />
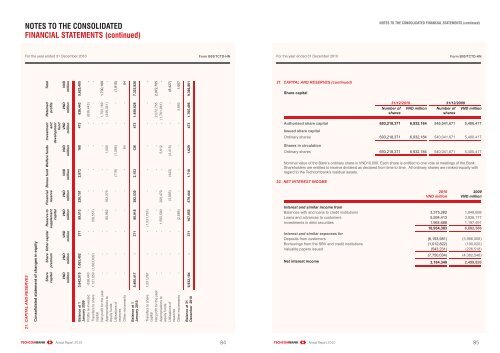
21. C APITAL AND RESERVES<br />
Consolidated statement of changes in equity<br />
Total<br />
Retained<br />
profits<br />
Bonus fund Welfare funds Investment<br />
and<br />
development<br />
fund<br />
Financial<br />
reserve<br />
Other capital Reserve to<br />
supplement<br />
capital<br />
Share<br />
premium<br />
Share<br />
capital<br />
VND<br />
million<br />
VND<br />
million<br />
VND<br />
million<br />
VND<br />
million<br />
VND<br />
million<br />
VND<br />
million<br />
VND<br />
million<br />
VND<br />
million<br />
VND<br />
million<br />
VND<br />
million<br />
3,642,015 1,063,402 371 59,513 220,151 2,872 168 473 636,443 5,625,408<br />
Balance at 1<br />
January 2009<br />
Profi ts re-invested 636,443 - - - - - - - (636,443) -<br />
1,121,959 (1,063,402) - (58,557) - - - - - -<br />
Transfers to share<br />
capital<br />
Net profi t for the year - - - - - - - - 1,700,169 1,700,169<br />
- - - 85,962 162,379 - 1,000 - (249,341) -<br />
Appropriations to<br />
equity funds<br />
- - - - - (719) (1,096) - - (1,815)<br />
Utilisations of<br />
reserves<br />
Other movements - - - - - - 64 - - 64<br />
5,400,417 - 371 86,918 382,530 2,153 136 473 1,450,828 7,323,826<br />
Balance at 1<br />
January 2010<br />
1,531,767 - - (1,531,767) - - - - - -<br />
Transfers to share<br />
capital<br />
Net profi t for the year - - - - - - - - 2,072,755 2,072,755<br />
- - - 1,555,590 200,479 - 5,912 - (1,761,981) -<br />
Appropriations to<br />
equity funds<br />
- - - - (3,565) (443) (4,419) - - (8,427)<br />
Utilisations of<br />
reserves<br />
Other movements - - - (2,886) - - - - 3,893 1,007<br />
6,932,184 - 371 107,855 579,444 1,710 1,629 473 1,765,495 9,386,861<br />
Balance at 31<br />
December 2010<br />
21. C APITAL AND RESERVES (continued)<br />
Share capital<br />
31/12/2010 31/12/2009<br />
Number of<br />
shares<br />
VND million Number of<br />
shares<br />
VND million<br />
Authorised share capital 693,218,371 6,932,184 540,041,671 5,400,417<br />
Issued share capital<br />
Ordinary shares 693,218,371 6,932,184 540,041,671 5,400,417<br />
Shares in circulation<br />
Ordinary shares 693,218,371 6,932,184 540,041,671 5,400,417<br />
Nominal value of the Bank’s ordinary share is VND10,000. Each share is entitled to one vote at meetings of the Bank.<br />
Shareholders are entitled to receive dividend as declared from time to time. All ordinary shares are ranked equally with<br />
regard to the Techcombank’s residual assets.<br />
22. NET INTEREST INCOME<br />
2010<br />
VND million<br />
2009<br />
VND million<br />
Interest and similar income from<br />
Balances with and loans to credit institutions 3,375,282 1,848,698<br />
Loans and advances to customers 5,594,413 3,836,177<br />
Investments in debt securities 1,964,688 1,197,491<br />
10,934,383 6,882,366<br />
Interest and similar expenses for<br />
Deposits from customers (6,193,981) (3,966,008)<br />
Borrowings from the SBV and credit institutions (1,012,822) (190,020)<br />
Valuable papers issued (543,231) (226,518)<br />
(7,750,034) (4,382,546)<br />
Net interest income 3,184,349 2,499,820<br />
Annual Report 2010<br />
84<br />
Annual Report 2010<br />
85