Strong Breakthrough - Masan Group
Strong Breakthrough - Masan Group
Strong Breakthrough - Masan Group

You also want an ePaper? Increase the reach of your titles
YUMPU automatically turns print PDFs into web optimized ePapers that Google loves.
NOTES TO THE CONSOLIDATED<br />
FINANCIAL STATEMENTS (continued)<br />
NOTES TO THE CONSOLIDATED FINANCIAL STATEMENTS (continued)<br />
For the year ended 31 December 2010<br />
Form B05/TCTD-HN<br />
For the year ended 31 December 2010<br />
Form B05/TCTD-HN<br />
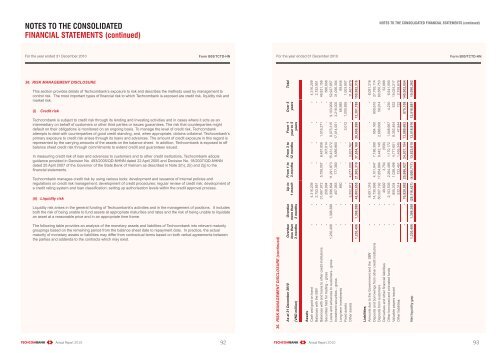
36. RISK MANAGEMENT DISCLOSURE<br />
This section provides details of Techcombank’s exposure to risk and describes the methods used by management to<br />
control risk. The most important types of financial risk to which Techcombank is exposed are credit risk, liquidity risk and<br />
market risk.<br />
(i)<br />
Credit risk<br />
Techcombank is subject to credit risk through its lending and investing activities and in cases where it acts as an<br />
intermediary on behalf of customers or other third parties or issues guarantees. The risk that counterparties might<br />
default on their obligations is monitored on an ongoing basis. To manage the level of credit risk, Techcombank<br />
attempts to deal with counterparties of good credit standing, and, when appropriate, obtains collateral. Techcombank’s<br />
primary exposure to credit risk arises through its loans and advances. The amount of credit exposure in this regard is<br />
represented by the carrying amounts of the assets on the balance sheet. In addition, Techcombank is exposed to off<br />
balance sheet credit risk through commitments to extend credit and guarantees issued.<br />
In measuring credit risk of loan and advances to customers and to other credit institutions, Techcombank adopts<br />
guidance provided in Decision No. 493/2005/QD-NHNN dated 22 April 2005 and Decision No. 18/2007/QD-NHNN<br />
dated 25 April 2007 of the Governor of the State Bank of Vietnam as described in Note 2(h), 2(i) and 2(j) to the<br />
fi nancial statements.<br />
Techcombank manages credit risk by using various tools: development and issuance of internal policies and<br />
regulations on credit risk management; development of credit procedures; regular review of credit risk; development of<br />
a credit rating system and loan classifi cation; setting up authorisation levels within the credit approval process.<br />
(ii) Liquidity risk<br />
Liquidity risk arises in the general funding of Techcombank’s activities and in the management of positions. It includes<br />
both the risk of being unable to fund assets at appropriate maturities and rates and the risk of being unable to liquidate<br />
an asset at a reasonable price and in an appropriate time frame.<br />
The following table provides an analysis of the monetary assets and liabilities of Techcombank into relevant maturity<br />
groupings based on the remaining period from the balance sheet date to repayment date. In practice, the actual<br />
maturity of monetary assets or liabilities may differ from contractual terms based on both verbal agreements between<br />
the parties and addenda to the contracts which may exist.<br />
36. RISK MANAGEMENT DISCLOSURE (continued)<br />
Total<br />
Over 5<br />
years<br />
From 1<br />
year to 5<br />
years<br />
From 3 to<br />
12 months<br />
From 1 to<br />
3 months<br />
Up to<br />
1 month<br />
Overdue<br />
more than<br />
3 months<br />
Overdue<br />
less than<br />
3 months<br />
As at 31 December 2010<br />
(VND million)<br />
Assets<br />
Cash and gold on hand - - 4,316,209 - - - - 4,316,209<br />
Balances with the SBV - - 2,752,951 - - - - 2,752,951<br />
Balances with and loans to other credit institutions - - 31,067,972 5,759,057 8,487,856 1,516,271 - 46,831,156<br />
Securities held for trading – gross - - 258,994 - 307,614 - - 566,608<br />
Loans and advances to customers - gross 1,230,406 1,398,388 6,396,894 11,291,873 15,431,072 8,075,315 9,103,909 52,927,857<br />
Investment securities – gross - - 457,063 777,380 9,589,860 17,014,001 3,218,000 31,056,304<br />
Long term investments - - 660 - - - 68,985 69,645<br />
Fixed assets - - - - - 3,012 1,000,895 1,003,907<br />
Other assets - - 3,552,912 4,077,000 3,837,767 - - 11,467,679<br />
1,230,406 1,398,388 48,803,655 21,905,310 37,654,169 26,608,599 13,391,789 150,992,316<br />
Liabilities<br />
Amounts due to the Government and the SBV - - 8,091,316 - - - - 8,091,316<br />
Deposits and borrowings from other credit institutions - - 14,730,998 4,101,947 7,186,399 954,160 809,610 27,783,114<br />
Deposits from customers - - 50,507,192 17,854,894 9,442,145 2,686,608 59,914 80,550,753<br />
Derivatives and other fi nancial liabilities - - 49,692 3,754 (558) - - 52,888<br />
Other borrowed and entrusted funds - - 2,153,536 2,264,485 1,170,172 1,048,667 4,230 6,641,090<br />
Valuable papers issued - - 855,034 1,038,496 4,777,651 8,352,404 632 15,024,217<br />
Other liabilities 532,314 722,451 1,455,345 47,844 722 2,758,676<br />
- - 76,920,082 25,986,027 24,031,154 13,089,683 875,108 140,902,054<br />
Net liquidity gap 1,230,406 1,398,388 (28,116,427) (4,080,717) 13,623,015 13,518,916 12,516,681 10,090,262<br />
Annual Report 2010<br />
92<br />
Annual Report 2010<br />
93