SwRI engineers design, build and test a prototype wind turbine array
SwRI engineers design, build and test a prototype wind turbine array
SwRI engineers design, build and test a prototype wind turbine array

You also want an ePaper? Increase the reach of your titles
YUMPU automatically turns print PDFs into web optimized ePapers that Google loves.
D017011<br />
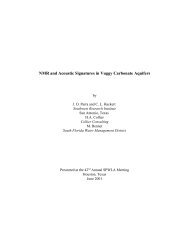
Smoke streams illustrate periodic vortex shedding<br />
from the smoke rake wake on the smoke<br />
streams. The influence of vortex shedding is<br />
minimized by rotating the rake.<br />
<strong>turbine</strong>s. In still images <strong>and</strong> video, no<br />
clear structure of the flow field was evident<br />
because of the <strong>turbine</strong>s. St<strong>and</strong>ard<br />
<strong>and</strong> slow-motion video with stroboscopic<br />
illumination synchronized to the<br />
rotation of the center <strong>turbine</strong> showed<br />
the flow field passing through the <strong>turbine</strong><br />
planes with no apparent effect.<br />
This was evidenced by the fact that the<br />
strobe light could not “freeze” images of<br />
smoke patterns. Instead, the smoke continually<br />
moved in all recorded images.<br />
<strong>SwRI</strong> researchers used a mixture of<br />
titanium dioxide (TiO 2<br />
), kerosene <strong>and</strong><br />
oleic acid to record flow patterns on<br />
the rotating blades. The mixture was<br />
painted onto the front <strong>and</strong> back sides<br />
of one of the center <strong>turbine</strong> blades, <strong>and</strong><br />
the tunnel was subsequently brought<br />
up to operating condition. This allowed<br />
the TiO 2<br />
mixture to travel on the surface<br />
under the aerodynamic forces while the<br />
kerosene evaporated, leaving a trace of<br />
the surface flow patterns.<br />
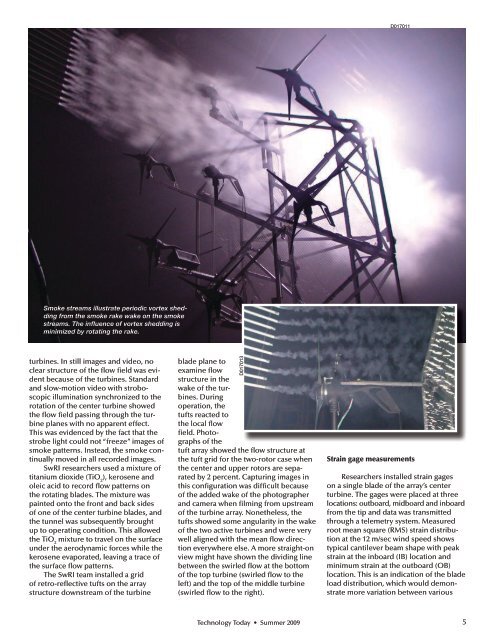
The <strong>SwRI</strong> team installed a grid<br />
of retro-reflective tufts on the <strong>array</strong><br />
structure downstream of the <strong>turbine</strong><br />
blade plane to<br />
examine flow<br />
structure in the<br />
wake of the <strong>turbine</strong>s.<br />
During<br />
operation, the<br />
tufts reacted to<br />
the local flow<br />
field. Photographs<br />
of the<br />
tuft <strong>array</strong> showed the flow structure at<br />
the tuft grid for the two-rotor case when<br />
the center <strong>and</strong> upper rotors are separated<br />
by 2 percent. Capturing images in<br />
this configuration was difficult because<br />
of the added wake of the photographer<br />
<strong>and</strong> camera when filming from upstream<br />
of the <strong>turbine</strong> <strong>array</strong>. Nonetheless, the<br />
tufts showed some angularity in the wake<br />
of the two active <strong>turbine</strong>s <strong>and</strong> were very<br />
well aligned with the mean flow direction<br />
everywhere else. A more straight-on<br />
view might have shown the dividing line<br />
between the swirled flow at the bottom<br />
of the top <strong>turbine</strong> (swirled flow to the<br />
left) <strong>and</strong> the top of the middle <strong>turbine</strong><br />
(swirled flow to the right).<br />
D017013<br />
Strain gage measurements<br />
Researchers installed strain gages<br />
on a single blade of the <strong>array</strong>’s center<br />
<strong>turbine</strong>. The gages were placed at three<br />
locations: outboard, midboard <strong>and</strong> inboard<br />
from the tip <strong>and</strong> data was transmitted<br />
through a telemetry system. Measured<br />
root mean square (RMS) strain distribution<br />
at the 12 m/sec <strong>wind</strong> speed shows<br />
typical cantilever beam shape with peak<br />
strain at the inboard (IB) location <strong>and</strong><br />
minimum strain at the outboard (OB)<br />
location. This is an indication of the blade<br />
load distribution, which would demonstrate<br />
more variation between various<br />
Technology Today • Summer 2009 5