

Satellite Radar Interferometry - Geoscience Australia
Satellite Radar Interferometry - Geoscience Australia
Satellite Radar Interferometry - Geoscience Australia

You also want an ePaper? Increase the reach of your titles
YUMPU automatically turns print PDFs into web optimized ePapers that Google loves.
<strong>Satellite</strong> <strong>Radar</strong> <strong>Interferometry</strong>: Application to Rabaul Caldera<br />
Assuming the ground area of interest is flat, the phase and the Doppler signals can be used to<br />
uniquely determine the location of the signal in 2D space. Thus an image of intensity can be formed<br />
using the 2D coordinate system from the phase and Doppler signals (Harger, 1970).<br />
While SAR can be used as a conventional imaging system, a more exciting application for geodesy<br />
is interferometric synthetic aperture radar (InSAR) where 2 or more SAR signals are combined to<br />
measure deformation of the surface. SAR systems operate by emitting and receiving a coherent,<br />
monochromatic radio beam. The radio beam is emitted at microwave frequencies, in one of the X, C,<br />
S, L or P bands (Elachi, 1988; Bamler and Hartl, 1998). The frequency and wavelength intervals of<br />
each of these bands are listed in Table 1 (Dawson, 2008).<br />
Table 1: Frequencies and wavelengths of the microwave bands used in SAR acquisitions (Dawson,<br />
2008).<br />
BAND FREQUENCY (GHZ) WAVELENGTH (CM)<br />
P < 0.3 100<br />
L 1-2 15-30<br />
S 2-4 7.5-15<br />
C 4-8 3.75-7.5<br />
X 8-12 2.5-3.75<br />
Topography<br />
Since SAR images are formed in two dimensions only, the impact of topography must be taken into<br />
account when analysing the signal. Regions of elevated topography shorten the range between the<br />
satellite and the ground, which alters the phase signal. Therefore SAR images must be corrected for<br />
topography. This can be done using a reference digital elevation model (DEM), or by deducing a<br />
topographic phase signal from two SAR images (eg: Rosen et al. 2000). In order to measure<br />
topography from two different SAR images, the satellite tracks must measure the image from<br />
slightly different trajectories. The two signals differ slightly due to parallax, and these parallax<br />
differences can be inverted to solve for height at each point.<br />
<strong>Interferometry</strong><br />
Once two SAR images have been acquired, the phase differences between the two images are used<br />
to measure line of sight deformations of the topography. The map of the phase differences is called<br />
an interferogram, where large deformation signals are represented by a series of periodic fringes in<br />
the phase. The process of forming an interferogram requires that the two phase maps are ‘coherent’,<br />
which means that the surface response between the two acquisitions remains similar. Coherence also<br />
requires that the two SAR images have been acquired from very similar look positions, otherwise<br />
parallax changes the apparent shape of the topography.<br />
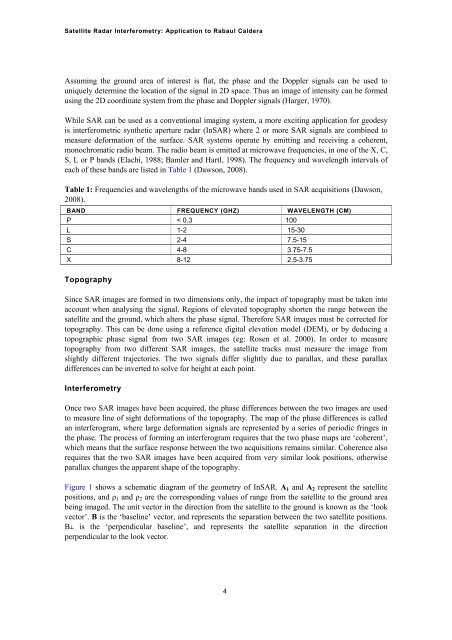
Figure 1 shows a schematic diagram of the geometry of InSAR. A 1 and A 2 represent the satellite<br />
positions, and ρ 1 and ρ 2 are the corresponding values of range from the satellite to the ground area<br />
being imaged. The unit vector in the direction from the satellite to the ground is known as the ‘look<br />
vector’. B is the ‘baseline’ vector, and represents the separation between the two satellite positions.<br />
B ┴ is the ‘perpendicular baseline’, and represents the satellite separation in the direction<br />
perpendicular to the look vector.<br />
4


