Untitled - Research and Analysis Home - State of Alaska
Untitled - Research and Analysis Home - State of Alaska
Untitled - Research and Analysis Home - State of Alaska

You also want an ePaper? Increase the reach of your titles
YUMPU automatically turns print PDFs into web optimized ePapers that Google loves.
Chapter 4<br />
<strong>Alaska</strong> Places<br />
Introduction<br />
This chapter contains 2000-2004 population estimates <strong>and</strong><br />
2000 Census population statistics for places. Places include<br />
incorporated cities or areas that are legally formed under<br />
the laws <strong>of</strong> the state, Census Designated Places (CDP), <strong>and</strong><br />
<strong>Alaska</strong> Native Village Statistical Areas (ANVSA).<br />
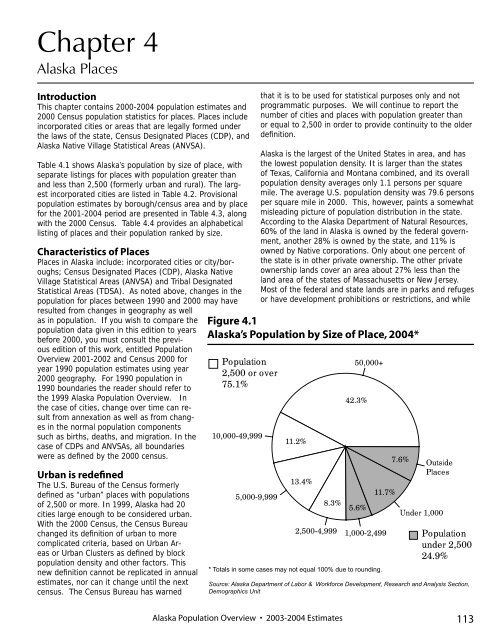
Table 4.1 shows <strong>Alaska</strong>’s population by size <strong>of</strong> place, with<br />
separate listings for places with population greater than<br />
<strong>and</strong> less than 2,500 (formerly urban <strong>and</strong> rural). The largest<br />
incorporated cities are listed in Table 4.2. Provisional<br />
population estimates by borough/census area <strong>and</strong> by place<br />
for the 2001-2004 period are presented in Table 4.3, along<br />
with the 2000 Census. Table 4.4 provides an alphabetical<br />
listing <strong>of</strong> places <strong>and</strong> their population ranked by size.<br />
Characteristics <strong>of</strong> Places<br />
Places in <strong>Alaska</strong> include: incorporated cities or city/boroughs;<br />
Census Designated Places (CDP), <strong>Alaska</strong> Native<br />
Village Statistical Areas (ANVSA) <strong>and</strong> Tribal Designated<br />
Statistical Areas (TDSA). As noted above, changes in the<br />
population for places between 1990 <strong>and</strong> 2000 may have<br />
resulted from changes in geography as well<br />
as in population. If you wish to compare the<br />
population data given in this edition to years<br />
before 2000, you must consult the previous<br />
edition <strong>of</strong> this work, entitled Population<br />
Overview 2001-2002 <strong>and</strong> Census 2000 for<br />
year 1990 population estimates using year<br />
2000 geography. For 1990 population in<br />
1990 boundaries the reader should refer to<br />
the 1999 <strong>Alaska</strong> Population Overview. In<br />
the case <strong>of</strong> cities, change over time can result<br />
from annexation as well as from changes<br />
in the normal population components<br />
such as births, deaths, <strong>and</strong> migration. In the<br />
case <strong>of</strong> CDPs <strong>and</strong> ANVSAs, all boundaries<br />
were as defined by the 2000 census.<br />
Urban is redefined<br />
The U.S. Bureau <strong>of</strong> the Census formerly<br />
defined as “urban” places with populations<br />
<strong>of</strong> 2,500 or more. In 1999, <strong>Alaska</strong> had 20<br />
cities large enough to be considered urban.<br />
With the 2000 Census, the Census Bureau<br />
changed its definition <strong>of</strong> urban to more<br />
complicated criteria, based on Urban Areas<br />
or Urban Clusters as defined by block<br />
population density <strong>and</strong> other factors. This<br />
new definition cannot be replicated in annual<br />
estimates, nor can it change until the next<br />
census. The Census Bureau has warned<br />
that it is to be used for statistical purposes only <strong>and</strong> not<br />
programmatic purposes. We will continue to report the<br />
number <strong>of</strong> cities <strong>and</strong> places with population greater than<br />
or equal to 2,500 in order to provide continuity to the older<br />
definition.<br />
<strong>Alaska</strong> is the largest <strong>of</strong> the United <strong>State</strong>s in area, <strong>and</strong> has<br />
the lowest population density. It is larger than the states<br />
<strong>of</strong> Texas, California <strong>and</strong> Montana combined, <strong>and</strong> its overall<br />
population density averages only 1.1 persons per square<br />
mile. The average U.S. population density was 79.6 persons<br />
per square mile in 2000. This, however, paints a somewhat<br />
misleading picture <strong>of</strong> population distribution in the state.<br />
According to the <strong>Alaska</strong> Department <strong>of</strong> Natural Resources,<br />
60% <strong>of</strong> the l<strong>and</strong> in <strong>Alaska</strong> is owned by the federal government,<br />
another 28% is owned by the state, <strong>and</strong> 11% is<br />
owned by Native corporations. Only about one percent <strong>of</strong><br />
the state is in other private ownership. The other private<br />
ownership l<strong>and</strong>s cover an area about 27% less than the<br />
l<strong>and</strong> area <strong>of</strong> the states <strong>of</strong> Massachusetts or New Jersey.<br />
Most <strong>of</strong> the federal <strong>and</strong> state l<strong>and</strong>s are in parks <strong>and</strong> refuges<br />
or have development prohibitions or restrictions, <strong>and</strong> while<br />
Figure 4.1<br />
<strong>Alaska</strong>’s Population by Size <strong>of</strong> Place, 2004*<br />
Population<br />
2,500 or over<br />
75.1%<br />
10,000-49,999<br />
5,000-9,999<br />
11.2%<br />
13.4%<br />
50,000+<br />
42.3%<br />
8.3% 5.6%<br />
11.7%<br />
7.6%<br />
Outside<br />
Places<br />
2,500-4,999 1,000-2,499<br />
Under 1,000<br />
* Totals in some cases may not equal 100% due to rounding.<br />
Population<br />
under 2,500<br />
24.9%<br />
Source: <strong>Alaska</strong> Department <strong>of</strong> Labor & Workforce Development, <strong>Research</strong> <strong>and</strong> <strong>Analysis</strong> Section,<br />
Demographics Unit<br />
<strong>Alaska</strong> Population Overview • 2003-2004 Estimates 113