Untitled - Research and Analysis Home - State of Alaska
Untitled - Research and Analysis Home - State of Alaska
Untitled - Research and Analysis Home - State of Alaska

Create successful ePaper yourself
Turn your PDF publications into a flip-book with our unique Google optimized e-Paper software.
depression <strong>and</strong> WWII created a series <strong>of</strong> cohorts that is<br />
widely known as the “baby boom”. These larger groups<br />
<strong>of</strong> children strained schools at every level as they passed,<br />
experienced reduced job opportunities as they entered the<br />
labor market, <strong>and</strong> will strain the social security system <strong>and</strong><br />
medical systems as they grow old. Cohorts in local areas<br />
are shaped over their lifetime by death <strong>and</strong> migration. They<br />
are increased by forces encouraging in-migration. They are<br />
reduced by forces <strong>of</strong> death <strong>and</strong> out-migration.<br />
Specific Age Groups<br />
The growth trends for various age groups <strong>of</strong>ten differ<br />
sharply from those <strong>of</strong> the population as a whole. These differences<br />
in age groups are found in Table 1.19 <strong>and</strong> Figures<br />
1.8 <strong>and</strong> 1.9.<br />
While <strong>Alaska</strong>’s total population increased 18.5% between<br />
July 1, 1990 <strong>and</strong> July 1, 2004, children under the age <strong>of</strong> five<br />
declined 5.9%, from 55,859 to 52,537. This age group currently<br />
makes up 8.0% <strong>of</strong> the state’s population. From a high<br />
in 1993, the number <strong>of</strong> young children steadily declined to a<br />
low <strong>of</strong> 48,525 in 2000, rising slowly but steadily over the last<br />
four years. The number in this age group is extremely volatile,<br />
depending on economic conditions. As a result, children<br />
under five are generally unreliable as a planning indicator<br />
for future elementary school facilities because economic<br />
booms <strong>and</strong> busts can quickly change the size <strong>of</strong> this age<br />
group. Cutbacks in military personnel in the mid 1990s <strong>and</strong><br />
fewer young adults as a result <strong>of</strong> low birth rates nationwide<br />
in the 1970s <strong>and</strong> low in-migration have acted to reduce the<br />
number <strong>of</strong> young children in the state.<br />
The population aged five to 13 are the children <strong>of</strong> elementary<br />
<strong>and</strong> junior high school age. This group has shrunk by<br />
5.5% since its peak <strong>of</strong> 101,208 in 1998. Children age 14 in<br />
2004 represent the peak <strong>of</strong> the “echo boom”, that is, they<br />
are the children <strong>of</strong> the last <strong>of</strong> the baby boomers. Peak baby<br />
boomers born in the late 1950s <strong>and</strong> 1960s tended to get<br />
married later <strong>and</strong> postpone childbearing. Since the largest<br />
cohort <strong>of</strong> “echo boom” kids is just entering high school, the<br />
current pressures on middle <strong>and</strong> high school capacities will<br />
ease, <strong>and</strong> decline in the near future.<br />
The number <strong>of</strong> high school-age children have tended to be<br />
more stable over the years. <strong>Alaska</strong>’s adult population has<br />
traditionally been too young to have large numbers <strong>of</strong> high<br />
school-age children. However, their numbers have increased<br />
steadily since 1990. In 2004, there were 45,353 youth aged<br />
14-17 in <strong>Alaska</strong>, up from 30,356 in 1990. This age group<br />
has increased from 5.5% <strong>of</strong> the state’s population in 1990<br />
to 6.9% in 2004, the highest proportion since the 1970s. In<br />
general, teenagers are less subject to changes in migration<br />
flows than younger age groups because their parents are<br />
older <strong>and</strong> generally have more stable jobs. Cutbacks in longst<strong>and</strong>ing<br />
oil <strong>and</strong> government jobs, however, could negatively<br />
impact this group. Except for rapid growth areas like Mat-Su,<br />
the number <strong>of</strong> high school students should begin to stabilize<br />
<strong>and</strong> decline in the next year <strong>of</strong> so.<br />
The age group 18-24 is most subject to increases <strong>and</strong><br />
declines in economic conditions. While nationwide this<br />
group was declining, in <strong>Alaska</strong> it reached a high <strong>of</strong> 70,175<br />
in 1984. Since 1984, this group decreased to 56,189 by<br />
1990, a loss <strong>of</strong> 20% in six years. In 1995, this age group<br />
hit a low point at 47,656. Cuts in the military population<br />
have also influenced the downward trend in this age group.<br />
This group has seen the passing <strong>of</strong> children born following<br />
the end <strong>of</strong> the baby boom in the early 1970s when fertility<br />
hit an all time low. While some have mistakenly interpreted<br />
the decline in the size <strong>of</strong> this age group to out-migration<br />
from <strong>Alaska</strong>, the trend in the size <strong>of</strong> this age group is in<br />
fact primarily a result <strong>of</strong> the passing <strong>of</strong> the “baby bust”<br />
cohorts through their early 20s. Since 1995, this group has<br />
increased steadily with the passing <strong>of</strong> the leading edge <strong>of</strong><br />
the “echo boom” into these ages. The small size <strong>of</strong> this<br />
segment <strong>of</strong> population is a portion <strong>of</strong> the reason for the<br />
relatively low unemployment rates currently being seen<br />
in <strong>Alaska</strong> <strong>and</strong> nationwide. The decreased supply <strong>of</strong> labor<br />
provided by this smaller generation should create a unique<br />
opportunity to increase the employability <strong>of</strong> persons not<br />
currently in the labor force or employed, so long as dem<strong>and</strong><br />
stays firm.<br />
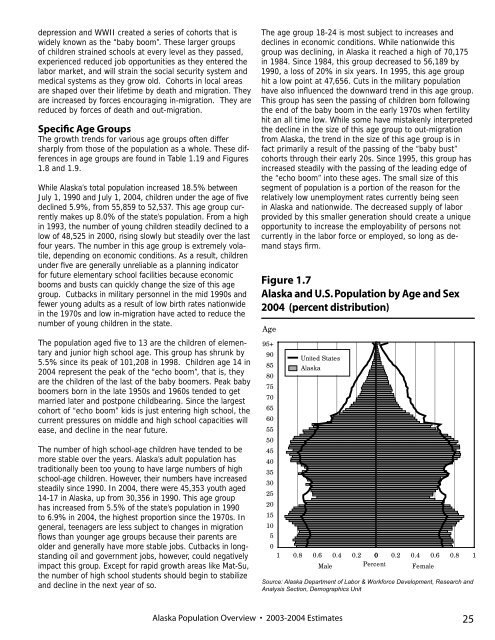
Figure 1.7<br />
<strong>Alaska</strong> <strong>and</strong> U.S. Population by Age <strong>and</strong> Sex<br />
2004 (percent distribution)<br />
Age<br />
95+<br />
90<br />
85<br />
80<br />
75<br />
70<br />
65<br />
60<br />
55<br />
50<br />
45<br />
40<br />
35<br />
30<br />
25<br />
20<br />
15<br />
10<br />
5<br />
0<br />
1<br />
0.8<br />
United <strong>State</strong>s<br />
<strong>Alaska</strong><br />
0.6 0.4<br />
Male<br />
0.2 0 0.2 0.4 0.6 0.8 1<br />
Percent Female<br />
Source: <strong>Alaska</strong> Department <strong>of</strong> Labor & Workforce Development, <strong>Research</strong> <strong>and</strong><br />
<strong>Analysis</strong> Section, Demographics Unit<br />
<strong>Alaska</strong> Population Overview • 2003-2004 Estimates 25