Untitled - Research and Analysis Home - State of Alaska
Untitled - Research and Analysis Home - State of Alaska
Untitled - Research and Analysis Home - State of Alaska

Create successful ePaper yourself
Turn your PDF publications into a flip-book with our unique Google optimized e-Paper software.
persons, or 30.7% <strong>of</strong> the population <strong>of</strong> <strong>Alaska</strong>, considered<br />
themselves to be either wholly or partly some race other<br />
than White. The number <strong>and</strong> proportions <strong>of</strong> persons by<br />
race <strong>and</strong> broad tribal group for 1980 <strong>and</strong> 1990 are shown<br />
in Tables 1.5-1.7. Of the 626,932 persons in <strong>Alaska</strong> in<br />
2000, Native Americans Alone made up 98,043 <strong>and</strong> <strong>of</strong> the<br />
658,723 race responses; the number <strong>of</strong> persons reporting<br />
Native American Alone or in Combination was 119,241.<br />
For these estimates, all Native Americans living in <strong>Alaska</strong><br />
are referred to as <strong>Alaska</strong> Natives, even though a small<br />
percentage <strong>of</strong> them belong to continental U.S. tribal<br />
groups. About 20 percent <strong>of</strong> all <strong>Alaska</strong> Natives are estimated<br />
to be living outside <strong>of</strong> <strong>Alaska</strong>. The economic boom<br />
<strong>of</strong> the early 1980s brought many non-Natives to the state.<br />
As a result, the proportion <strong>of</strong> <strong>Alaska</strong> Natives dropped from<br />
16.0% in 1980 to 15.7% in 1990. By 2000, the percentage<br />
<strong>of</strong> Native Americans was between 15.6 <strong>and</strong> 18.1%.<br />
<strong>Alaska</strong> Natives made up 4.4% <strong>of</strong> all Native Americans<br />
nationally in 1990.<br />
In 2000, <strong>Alaska</strong> American Indian <strong>and</strong> <strong>Alaska</strong> Natives (AIAN)<br />
in <strong>Alaska</strong> made up 4.0% <strong>of</strong> AIAN Alone <strong>and</strong> 2.9% <strong>of</strong> AIAN<br />
Alone or in Combination nationwide. In 2000, the White<br />
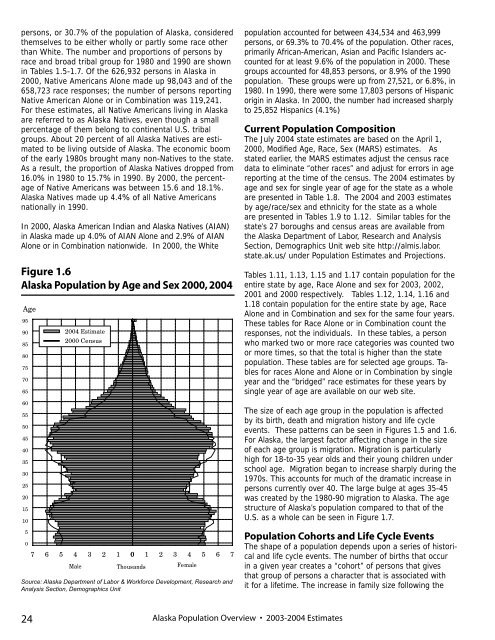
Figure 1.6<br />
<strong>Alaska</strong> Population by Age <strong>and</strong> Sex 2000, 2004<br />
Age<br />
95<br />
90<br />
85<br />
80<br />
75<br />
70<br />
65<br />
60<br />
55<br />
50<br />
45<br />
40<br />
35<br />
30<br />
25<br />
20<br />
15<br />
10<br />
5<br />
2004 Estimate<br />
2000 Census<br />
0<br />
7 6 5 4 3 2 1 0 1 2 3 4 5 6 7<br />
Male<br />
Thous<strong>and</strong>s<br />
Female<br />
Source: <strong>Alaska</strong> Department <strong>of</strong> Labor & Workforce Development, <strong>Research</strong> <strong>and</strong><br />
<strong>Analysis</strong> Section, Demographics Unit<br />
population accounted for between 434,534 <strong>and</strong> 463,999<br />
persons, or 69.3% to 70.4% <strong>of</strong> the population. Other races,<br />
primarily African-American, Asian <strong>and</strong> Pacific Isl<strong>and</strong>ers accounted<br />
for at least 9.6% <strong>of</strong> the population in 2000. These<br />
groups accounted for 48,853 persons, or 8.9% <strong>of</strong> the 1990<br />
population. These groups were up from 27,521, or 6.8%, in<br />
1980. In 1990, there were some 17,803 persons <strong>of</strong> Hispanic<br />
origin in <strong>Alaska</strong>. In 2000, the number had increased sharply<br />
to 25,852 Hispanics (4.1%)<br />
Current Population Composition<br />
The July 2004 state estimates are based on the April 1,<br />
2000, Modified Age, Race, Sex (MARS) estimates. As<br />
stated earlier, the MARS estimates adjust the census race<br />
data to eliminate “other races” <strong>and</strong> adjust for errors in age<br />
reporting at the time <strong>of</strong> the census. The 2004 estimates by<br />
age <strong>and</strong> sex for single year <strong>of</strong> age for the state as a whole<br />
are presented in Table 1.8. The 2004 <strong>and</strong> 2003 estimates<br />
by age/race/sex <strong>and</strong> ethnicity for the state as a whole<br />
are presented in Tables 1.9 to 1.12. Similar tables for the<br />
state’s 27 boroughs <strong>and</strong> census areas are available from<br />
the <strong>Alaska</strong> Department <strong>of</strong> Labor, <strong>Research</strong> <strong>and</strong> <strong>Analysis</strong><br />
Section, Demographics Unit web site http://almis.labor.<br />
state.ak.us/ under Population Estimates <strong>and</strong> Projections.<br />
Tables 1.11, 1.13, 1.15 <strong>and</strong> 1.17 contain population for the<br />
entire state by age, Race Alone <strong>and</strong> sex for 2003, 2002,<br />
2001 <strong>and</strong> 2000 respectively. Tables 1.12, 1.14, 1.16 <strong>and</strong><br />
1.18 contain population for the entire state by age, Race<br />
Alone <strong>and</strong> in Combination <strong>and</strong> sex for the same four years.<br />
These tables for Race Alone or in Combination count the<br />
responses, not the individuals. In these tables, a person<br />
who marked two or more race categories was counted two<br />
or more times, so that the total is higher than the state<br />
population. These tables are for selected age groups. Tables<br />
for races Alone <strong>and</strong> Alone or in Combination by single<br />
year <strong>and</strong> the “bridged” race estimates for these years by<br />
single year <strong>of</strong> age are available on our web site.<br />
The size <strong>of</strong> each age group in the population is affected<br />
by its birth, death <strong>and</strong> migration history <strong>and</strong> life cycle<br />
events. These patterns can be seen in Figures 1.5 <strong>and</strong> 1.6.<br />
For <strong>Alaska</strong>, the largest factor affecting change in the size<br />
<strong>of</strong> each age group is migration. Migration is particularly<br />
high for 18-to-35 year olds <strong>and</strong> their young children under<br />
school age. Migration began to increase sharply during the<br />
1970s. This accounts for much <strong>of</strong> the dramatic increase in<br />
persons currently over 40. The large bulge at ages 35-45<br />
was created by the 1980-90 migration to <strong>Alaska</strong>. The age<br />
structure <strong>of</strong> <strong>Alaska</strong>’s population compared to that <strong>of</strong> the<br />
U.S. as a whole can be seen in Figure 1.7.<br />
Population Cohorts <strong>and</strong> Life Cycle Events<br />
The shape <strong>of</strong> a population depends upon a series <strong>of</strong> historical<br />
<strong>and</strong> life cycle events. The number <strong>of</strong> births that occur<br />
in a given year creates a “cohort” <strong>of</strong> persons that gives<br />
that group <strong>of</strong> persons a character that is associated with<br />
it for a lifetime. The increase in family size following the<br />
24<br />
<strong>Alaska</strong> Population Overview • 2003-2004 Estimates