Form 6-K - Dr. Reddy's
Form 6-K - Dr. Reddy's
Form 6-K - Dr. Reddy's

Create successful ePaper yourself
Turn your PDF publications into a flip-book with our unique Google optimized e-Paper software.
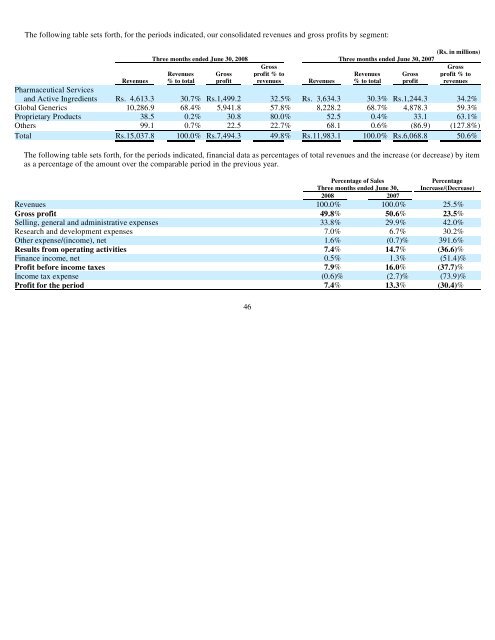
The following table sets forth, for the periods indicated, our consolidated revenues and gross profits by segment:<br />
(Rs. in millions)<br />
Three months ended June 30, 2008 Three months ended June 30, 2007<br />
Gross Gross<br />
Revenues Gross profit % to Revenues Gross profit % to<br />
Revenues % to total profit revenues Revenues % to total profit revenues<br />
Pharmaceutical Services<br />
and Active Ingredients Rs. 4,613.3 30.7% Rs.1,499.2 32.5% Rs. 3,634.3 30.3% Rs.1,244.3 34.2%<br />
Global Generics 10,286.9 68.4% 5,941.8 57.8% 8,228.2 68.7% 4,878.3 59.3%<br />
Proprietary Products 38.5 0.2% 30.8 80.0% 52.5 0.4% 33.1 63.1%<br />
Others 99.1 0.7% 22.5 22.7% 68.1 0.6% (86.9) (127.8%)<br />
Total Rs.15,037.8 100.0% Rs.7,494.3 49.8% Rs.11,983.1 100.0% Rs.6,068.8 50.6%<br />
The following table sets forth, for the periods indicated, financial data as percentages of total revenues and the increase (or decrease) by item<br />
as a percentage of the amount over the comparable period in the previous year.<br />
Percentage of Sales Percentage<br />
Three months ended June 30, Increase/(Decrease)<br />
2008 2007<br />
Revenues 100.0% 100.0% 25.5%<br />
Gross profit 49.8% 50.6% 23.5%<br />
Selling, general and administrative expenses 33.8% 29.9% 42.0%<br />
Research and development expenses 7.0% 6.7% 30.2%<br />
Other expense/(income), net 1.6% (0.7)% 391.6%<br />
Results from operating activities 7.4% 14.7% (36.6)%<br />
Finance income, net 0.5% 1.3% (51.4)%<br />
Profit before income taxes 7.9% 16.0% (37.7)%<br />
Income tax expense (0.6)% (2.7)% (73.9)%<br />
Profit for the period 7.4% 13.3% (30.4)%<br />
46