Environmental Profile Report for the European Aluminium Industry ...
Environmental Profile Report for the European Aluminium Industry ...
Environmental Profile Report for the European Aluminium Industry ...

You also want an ePaper? Increase the reach of your titles
YUMPU automatically turns print PDFs into web optimized ePapers that Google loves.
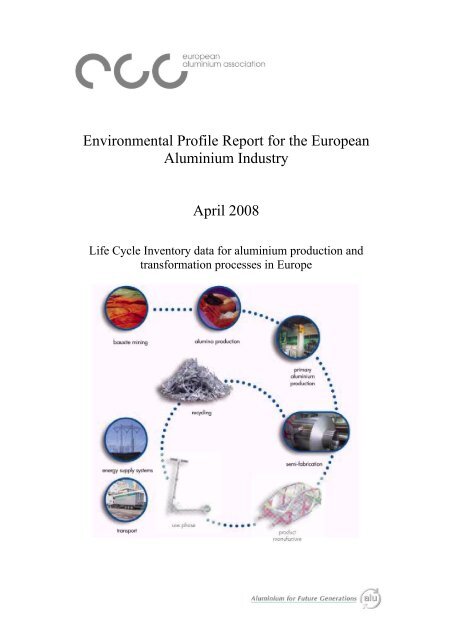
<strong>Environmental</strong> <strong>Profile</strong> <strong>Report</strong> <strong>for</strong> <strong>the</strong> <strong>European</strong><br />
<strong>Aluminium</strong> <strong>Industry</strong><br />
April 2008<br />
Life Cycle Inventory data <strong>for</strong> aluminium production and<br />
trans<strong>for</strong>mation processes in Europe
Table of content<br />
0. PREFACE......................................................................................................................................4<br />
1. THE ALUMINIUM PRODUCT LIFE CYCLE ........................................................................5<br />
2. DESCRIPTION OF THE LCI PROJECT .................................................................................6<br />
2.1 GOAL & SCOPE OF THE LCI PROJECT .....................................................................................6<br />
2.2 HOW TO USE THESE LCI DATASETS IN LCA STUDIES.............................................................9<br />
2.3 DATA COLLECTION, CONSOLIDATION AND AVERAGING .........................................................9<br />
2.4 CUT-OFF RULES....................................................................................................................10<br />
2.5 DATA QUALITY, VALIDATION AND MODELLING ...................................................................10<br />
2.6 ALLOCATION PRINCIPLES .....................................................................................................10<br />
2.7 SOFTWARE TOOL FOR LCI DATA MODELLING ......................................................................11<br />
2.8 SYSTEM BOUNDARIES & BACKGROUND DATA......................................................................11<br />
2.8.1 Thermal energy used in aluminium processes ................................................................12<br />
2.8.2 Electricity production .....................................................................................................13<br />
2.8.3 Transport ........................................................................................................................14<br />
2.9 LCI DATA AND ENVIRONMENTAL INDICATORS.....................................................................15<br />
2.10 CRITICAL REVIEW BY INDEPENDENT EXPERT........................................................................17<br />
2.11 MAIN DIFFERENCES BETWEEN CURRENT AND PAST MODELLING APPROACHES.....................17<br />
3. PRIMARY PRODUCTION .......................................................................................................19<br />
3.1 PROCESS STEPS DESCRIPTION ...............................................................................................19<br />
3.1.1 Bauxite Mining ...............................................................................................................19<br />
3.1.2 Alumina production ........................................................................................................19<br />
3.1.3 Electrolysis .....................................................................................................................20<br />
3.1.4 Cast house.......................................................................................................................21<br />
3.2 DATA COLLECTION AND AVERAGING ...................................................................................22<br />
3.2.1 Bauxite mining................................................................................................................23<br />
3.2.2 Alumina production ........................................................................................................23<br />
3.2.3 Anode & paste production ..............................................................................................24<br />
3.2.4 Electrolysis (Smelter)......................................................................................................26<br />
3.2.5 Cast house.......................................................................................................................28<br />
3.3 MATERIAL FLOW MODELLING ..............................................................................................30<br />
3.4 EAA ELECTRICITY MODEL FOR ALUMINIUM ELECTROLYSIS (SMELTERS) .............................32<br />
3.4.1 Electricity used by <strong>European</strong> primary aluminium smelters............................................32<br />
3.4.2 Electricity used <strong>for</strong> <strong>the</strong> production of imported aluminium............................................33<br />
3.4.3 EAA electricity model .....................................................................................................34<br />
3.5 EUROPEAN LCI DATASET AND ENVIRONMENTAL INDICATORS FOR PRIMARY ALUMINIUM...36<br />
4. ALUMINIUM SHEET PRODUCTION ...................................................................................38<br />
4.1 PROCESS STEPS DESCRIPTION ...............................................................................................38<br />
4.2 DATA COLLECTION, AVERAGING AND MODELLING...............................................................39<br />
4.3 EUROPEAN LCI DATASET FOR ALUMINIUM SHEET PRODUCTION ..........................................41<br />
5. ALUMINIUM FOIL PRODUCTION.......................................................................................42<br />
5.1 PROCESS STEPS DESCRIPTION ...............................................................................................42<br />
5.2 DATA CONSOLIDATION, AVERAGING AND MODELING ..........................................................43<br />
5.3 EUROPEAN LCI DATASET FOR ALUMINIUM FOIL PRODUCTION .............................................45<br />
6. ALUMINIUM EXTRUSION .....................................................................................................45<br />
6.1 PROCESS STEPS DESCRIPTION ...............................................................................................45<br />
6.2 DATA CONSOLIDATION, AVERAGING AND MODELING ..........................................................46<br />
6.3 EUROPEAN LCI DATASET FOR EXTRUSION PRODUCTION......................................................48<br />
7. ALUMINIUM RECYCLING ....................................................................................................49<br />
7.1 SCRAP TERMINOLOGY ..........................................................................................................50<br />
7.2 SCRAP RECYCLING ROUTE AND CORRESPONDING MODELS ...................................................50<br />
7.3 FURNACE TECHNOLOGIES.....................................................................................................51<br />
7.4 PRODUCTS FROM THE ALUMINIUM RECYCLING INDUSTRY....................................................52<br />
Page 2 of 72
7.5 DROSS RECYCLING AND SALT SLAG TREATMENT [6] ............................................................53<br />
7.6 ALUMINIUM SCRAP MASS FLOW MODELLING........................................................................53<br />
7.7 REMELTING MODEL..............................................................................................................54<br />
7.7.1 Data consolidation, averaging and modeling.................................................................54<br />
7.7.2 <strong>European</strong> LCI data <strong>for</strong> scrap remelting..........................................................................56<br />
7.8 RECYCLING MODEL ..............................................................................................................57<br />
7.8.1 Scrap mix ........................................................................................................................57<br />
7.8.2 Scrap preparation...........................................................................................................58<br />
7.8.3 Data consolidation, averaging and modeling.................................................................59<br />
7.8.4 Material flow and LCI data <strong>for</strong> <strong>the</strong> recycling model ......................................................61<br />
7.8.5 LCA & aluminium recycling...........................................................................................63<br />
8. GLOSSARY & DEFINITIONS.................................................................................................65<br />
9. REFERENCES............................................................................................................................69<br />
10. LIST OF FIGURES ...............................................................................................................69<br />
11. LIST OF TABLES .................................................................................................................70<br />
12. REPORT FROM THE INDEPENDENT REVIEWER......................................................72<br />
Page 3 of 72
0. Preface<br />
The <strong>European</strong> aluminium industry promotes life-cycle thinking and supports <strong>the</strong> use<br />
of LCA which contributes to fur<strong>the</strong>r environmental improvements in aluminium<br />
product development in a life cycle concept. Whenever organisations are doing LCA<br />
<strong>for</strong> aluminium products in which it is appropriate to use <strong>European</strong> data, <strong>the</strong> <strong>European</strong><br />
<strong>Aluminium</strong> Association contributes in supplying in<strong>for</strong>mation and data, making its<br />
best to provide in<strong>for</strong>mation in line with <strong>the</strong> study goal and scope.<br />
The <strong>European</strong> aluminium industry is striving to reduce <strong>the</strong> environmental footprint of<br />
its processes and products by promoting:<br />
• efficient use of resources and energy,<br />
• reduction of emissions to air and water,<br />
• reduction of waste.<br />
• high recycling rates at <strong>the</strong> end of <strong>the</strong> product life-cycle.<br />
After use, aluminium products are a valuable re-usable resource which is efficiently<br />
recycled through well-established collection schemes, scrap preparation technologies<br />
and refining processes. The <strong>European</strong> recycling rates <strong>for</strong> end products are currently<br />
around 90% <strong>for</strong> <strong>the</strong> automotive sector and <strong>for</strong> <strong>the</strong> building sector. The recovery rates<br />
of used aluminium packaging vary depending on <strong>the</strong> specific products and <strong>the</strong><br />
collection practices operated in <strong>the</strong> different countries. Concerning aluminium cans,<br />
<strong>the</strong> official <strong>European</strong> collection rate reached 56% in 2007, without considering<br />
in<strong>for</strong>mal recycling routes. Since <strong>the</strong> current aluminium product range is extremely<br />
wide, <strong>the</strong> end-of-life recycling rates can vary significantly.<br />
As supported by <strong>the</strong> whole metal industry [17], <strong>the</strong> <strong>European</strong> aluminium industry<br />
recommends to credit <strong>the</strong> environmental benefits resulting from recycling through <strong>the</strong><br />
end-of-life recycling approach and not through <strong>the</strong> inappropriate recycled metal<br />
content approach which has no real environmental significance. The end-of-life<br />
recycling approach is based on a product life cycle and material stewardship<br />
perspective. It considers <strong>the</strong> fate of products after <strong>the</strong>ir use stage and <strong>the</strong> resultant<br />
material output flows. The <strong>European</strong> aluminium industry recommends using <strong>the</strong> socalled<br />
substitution methodology to consider <strong>the</strong> benefits of aluminium recycling in<br />
LCA. This methodology is explained within <strong>the</strong> technical paper “aluminium recycling<br />
in LCA” which can be downloaded from <strong>the</strong> EAA website (www.aluminium.org ).<br />
This environmental report provides up-to-date life cycle inventory data (LCI) <strong>for</strong><br />
aluminium production and trans<strong>for</strong>mation processes in Europe. This report and <strong>the</strong><br />
associated LCI data have been developed in full reference to <strong>the</strong> 2 relevant ISO<br />
standards ISO 14040 and 14044 [8-9]. This document is based on environmental data<br />
related to <strong>the</strong> year 2005. It updates <strong>the</strong> previous datasets which have been published in<br />
<strong>the</strong> following documents [1-3]:<br />
- Ecological <strong>Profile</strong> <strong>Report</strong> <strong>for</strong> <strong>the</strong> <strong>European</strong> <strong>Aluminium</strong> <strong>Industry</strong><br />
published in 1996 (reference years 1994 and 1992)<br />
- <strong>Environmental</strong> <strong>Profile</strong> <strong>Report</strong> <strong>for</strong> <strong>the</strong> <strong>European</strong> <strong>Aluminium</strong> <strong>Industry</strong><br />
published in 2000 (reference year 1998)<br />
- The 2 updates of <strong>the</strong> <strong>Environmental</strong> <strong>Profile</strong> <strong>Report</strong> <strong>for</strong> <strong>the</strong> <strong>European</strong><br />
<strong>Aluminium</strong> <strong>Industry</strong> published in 2005 (reference year 2002)<br />
• Primary aluminium<br />
• Semi-finished aluminium products and process scrap recycling<br />
Page 4 of 72
1. The aluminium product life cycle<br />
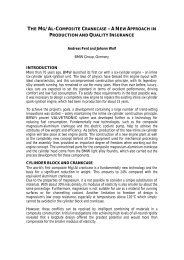
The typical life cycle of an aluminium product system can be modelled using a system<br />
of different process steps in accordance with <strong>the</strong> flow chart reported in Fig. 1.1.<br />
bauxite mining<br />
o<strong>the</strong>r raw material<br />
production<br />
bauxite NaOH petrol coke pitch<br />
<strong>Aluminium</strong><br />
Alumina extraction Fluoride anode fabrication<br />
alumina<br />
anodes<br />
Primary aluminium production<br />
(electrolysis and cast house)<br />
ingots<br />
Production of semi-finished process recycling<br />
products<br />
scrap<br />
ingots<br />
Manufacturing of consumer<br />
product<br />
Use of product<br />
used product<br />
Collection and sorting<br />
process<br />
scrap<br />
used aluminium<br />
scrap<br />
Fig. 1.1 Simplified life cycle material flow chart of an aluminium product<br />
Metal losses (not collected, incineration,<br />
oxidation , landfilled, etc.)<br />
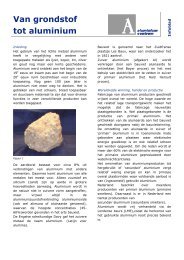
The main raw material <strong>for</strong> aluminium is bauxite, which is extracted from bauxite<br />
mines and processed into aluminium oxide at alumina plants.<br />
<strong>Aluminium</strong> metal is produced from aluminium oxide by an electrolytic process. In<br />
addition to alumina, <strong>the</strong> main raw materials are carbon anodes and aluminium<br />
fluoride. <strong>Aluminium</strong> from <strong>the</strong> smelters is alloyed and cast into ingots <strong>for</strong> rolling,<br />
extrusion or product casting.<br />
Wrought aluminium products are fabricated from ingots by hot working (mainly a<br />
rolling or an extrusion process) which is normally followed by cold working and /or<br />
finishing operations.<br />
<strong>Aluminium</strong> castings are manufactured by <strong>the</strong> solidification of molten metal, followed<br />
by finishing operations.<br />
Page 5 of 72
<strong>Aluminium</strong> production scrap is <strong>for</strong>med during <strong>the</strong> various aluminium fabrication<br />
steps. This scrap is ei<strong>the</strong>r recycled in a closed loop at <strong>the</strong> plant where it is generated,<br />
or recycled outside <strong>the</strong> plant by specialised remelters.<br />
<strong>Aluminium</strong> scrap from products after <strong>the</strong>ir service life is to a large extent recovered<br />
<strong>for</strong> recycling into new aluminium products.<br />
2. Description of <strong>the</strong> LCI project<br />
2.1 Goal & scope of <strong>the</strong> LCI project<br />
In order to update its various <strong>European</strong> LCI datasets related to aluminium processes,<br />
<strong>the</strong> EAA has decided to organise in 2006 a new extensive environmental survey<br />
covering <strong>the</strong> year 2005, in which <strong>the</strong> <strong>European</strong> aluminium producers provided input<br />
and output data of environmental relevance <strong>for</strong> <strong>the</strong>ir respective production facilities.<br />
These data have been aggregated at <strong>European</strong> level and averages representative <strong>for</strong><br />
Europe have been calculated <strong>for</strong> <strong>the</strong> various processes and sub-processes involved in<br />
<strong>the</strong> aluminium value chain. These <strong>European</strong> averages were <strong>the</strong>n used within various<br />
LCI models in order to develop generic <strong>European</strong> LCI datasets, i.e. lists of quantified<br />
elementary flows, associated with <strong>the</strong> main aluminium production or trans<strong>for</strong>mation<br />
processes.<br />
These data provided by <strong>the</strong> EAA members <strong>for</strong> <strong>the</strong>ir own process steps are <strong>the</strong> most<br />
up-to-date average data available <strong>for</strong> <strong>the</strong>se processes, and it is recommended that <strong>the</strong>y<br />
be used <strong>for</strong> LCA purposes, whenever generic aluminium data <strong>for</strong> Europe are needed.<br />
Older literature data should be disregarded, as <strong>the</strong>y may no longer be representative<br />
due to technological improvements, progress in operating per<strong>for</strong>mance, changes with<br />
regard to raw materials or waste treatment, etc.<br />
These updated environmental data and associated LCI datasets, which are annexed to<br />
this report, should be used <strong>for</strong>:<br />
- <strong>for</strong> LCA studies related to aluminium products fabricated in Europe ,<br />
i.e. product made of aluminium or containing aluminium.<br />
- <strong>for</strong> updating <strong>the</strong> various environmental and LCI databases related to<br />
aluminium processes in Europe<br />
As such, <strong>the</strong>se datasets are intended <strong>for</strong> use as a reference material <strong>for</strong> life cycle<br />
assessment (LCA) studies of products made of, or containing, aluminium. To<br />
complete <strong>the</strong> product system under study, <strong>the</strong> user should collect <strong>the</strong> following<br />
additional data and in<strong>for</strong>mation:<br />
- Inventory data on <strong>the</strong> production of components not made of<br />
aluminium,<br />
- Inventory data on <strong>the</strong> fabrication and <strong>the</strong> assembly of <strong>the</strong> final product<br />
system from semi-fabricated aluminium components and possibly<br />
o<strong>the</strong>r material pieces,<br />
- Inventory data associated with <strong>the</strong> use phase of <strong>the</strong> product system.<br />
- Inventory data related to <strong>the</strong> end of life treatment, with a special focus<br />
on <strong>the</strong> collection and recycling processes <strong>for</strong> aluminium.<br />
The geographical area covered by <strong>the</strong>se datasets is Europe which is composed of <strong>the</strong><br />
EU27 and <strong>the</strong> EFTA countries (Norway, Switzerland and Iceland).<br />
Page 6 of 72
The LCI modelling is based on a pure aluminium mass flow. Alloying elements<br />
have been substituted by pure aluminium. This simplification is reasonable <strong>for</strong> most<br />
of <strong>the</strong> wrought aluminium alloys which usually contain less than 5% of alloying<br />
elements. For cast alloys, it is recommended to <strong>the</strong> user to analyse more closely <strong>the</strong><br />
contribution of alloying elements, mainly silicon and magnesium, since such alloying<br />
elements usually constitute 5 to 15% of <strong>the</strong> mass of <strong>the</strong> casting alloys.<br />
The LCI models include <strong>the</strong> recycling of all <strong>the</strong> aluminium from process scrap, chips,<br />
dross or salt slag which are produced along <strong>the</strong> production or trans<strong>for</strong>mation route.<br />
According to this modelling approach, <strong>the</strong> only valuable aluminium product exiting<br />
<strong>the</strong> LCI model is ei<strong>the</strong>r <strong>the</strong> aluminium ingot or <strong>the</strong> aluminium semi-finished product.<br />
As a consequence, this approach supports <strong>the</strong> dataset modularity, i.e. <strong>the</strong> possibility<br />
to combine <strong>the</strong>m directly. For <strong>the</strong> datasets addressing semi-production, remelting and<br />
refining, this approach allows evaluating <strong>the</strong> true environmental aspects of <strong>the</strong>se<br />
aluminium processes, since it also considers <strong>the</strong> possible metal losses.<br />
The LCI modelling also considers ancillary processes like fuel preparation,<br />
electricity production or ancillary material production in order to develop LCI<br />
datasets mainly composed of elementary flows, i.e. material or energy directly<br />
drawn from <strong>the</strong> environment without previous human trans<strong>for</strong>mation or material or<br />
energy released into <strong>the</strong> environment without subsequent human trans<strong>for</strong>mation.<br />
The following LCI datasets have been developed from <strong>the</strong> environmental surveys<br />
covering <strong>the</strong> year 2005:<br />
• 1 dataset on primary aluminium production,<br />
• 3 datasets on semi-finished aluminium products fabrication,<br />
respectively sheet, profile & foil,<br />
• 1 dataset on clean process scrap remelting,<br />
• 1 dataset on <strong>the</strong> recycling of special scrap and end of life aluminium<br />
products.<br />
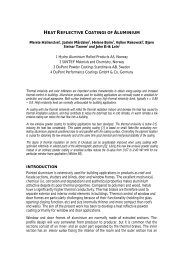
The system boundaries of <strong>the</strong>se various datasets are reported in Fig. 2.1.<br />
The ‘primary’ LCI dataset corresponds to <strong>the</strong> production of 1 tonne of ingot from<br />
primary aluminium, i.e. from bauxite mining up to <strong>the</strong> sawn aluminium ingot ready<br />
<strong>for</strong> delivery. This dataset includes all <strong>the</strong> environmental aspects of <strong>the</strong> various process<br />
steps and raw materials used to deliver 1 tonne of sawn primary ingot to <strong>the</strong> <strong>European</strong><br />
market. Since <strong>the</strong> electricity production is <strong>the</strong> major contributor to <strong>the</strong> environmental<br />
aspects, a specific electricity model has been developed based on <strong>the</strong> <strong>European</strong><br />
production and <strong>the</strong> structure of <strong>the</strong> imports which represents 36% of <strong>the</strong> primary<br />
aluminium used in Europe in 2005 (see section 3).<br />
The ‘semi-production’ LCI datasets (sheet, foil or profile) correspond to <strong>the</strong><br />
trans<strong>for</strong>mation of a sawn aluminium ingot into a semi-product, i.e. profile, sheet or<br />
foil ready <strong>for</strong> delivery to <strong>the</strong> user. These ‘semi-production’ datasets include <strong>the</strong><br />
recycling of <strong>the</strong> scrap and chips generated during this semi-fabrication stage as well as<br />
<strong>the</strong> recycling of <strong>the</strong> dross. The 3 datasets correspond respectively to <strong>the</strong> production of<br />
1 tonne of profile, sheet or foil. EAFA (<strong>European</strong> <strong>Aluminium</strong> Foil Association,<br />
www.alufoil.org) and EAA worked toge<strong>the</strong>r <strong>for</strong> developing <strong>the</strong> foil dataset (see<br />
sections 4, 5 and 6)<br />
Page 7 of 72
auxite mining<br />
o<strong>the</strong>r raw material<br />
production<br />
bauxite NaOH petrol coke pitch<br />
Primary<br />
dataset<br />
<strong>Aluminium</strong><br />
Alumina extraction Fluoride anode fabrication<br />
Semiproduction<br />
datasets<br />
alumina<br />
Primary aluminium production<br />
(electrolysis and cast house)<br />
ingots<br />
Production of semi-finished<br />
products<br />
Manufacturing of consumer<br />
product<br />
Use of product<br />
used product<br />
anodes<br />
ingots<br />
process<br />
scrap<br />
process<br />
scrap<br />
remelting<br />
Recycling<br />
dataset<br />
Remelting<br />
dataset<br />
refining<br />
Metal losses (not collected, incineration,<br />
oxidation , landfilled, etc.)<br />
Collection and sorting<br />
used aluminium<br />
scrap<br />
Fig. 2.1 System boundaries of <strong>the</strong> various LCI datasets<br />
The ‘remelting’ LCI dataset corresponds to <strong>the</strong> production of 1 tonne of aluminium<br />
ingot from clean process scrap (also called new scrap). This dataset also includes <strong>the</strong><br />
recycling of dross & skimmings. This dataset should be used <strong>for</strong> <strong>the</strong> recycling of<br />
process scrap as well as <strong>for</strong> <strong>the</strong> recycling of some specific end-of-life products using<br />
well controlled collection schemes like big aluminium pieces in building or<br />
aluminium beverage cans collected through specific collection networks.<br />
The ‘recycling’ LCI dataset corresponds to <strong>the</strong> production of 1 tonne of aluminium<br />
ingot from <strong>the</strong> modelled mix of <strong>the</strong> <strong>European</strong> scrap market (excluding clean process<br />
scrap). This datasets includes <strong>the</strong> scraps preparation phase like shredding, cutting,<br />
balling, sorting or/and de-coating as well as <strong>the</strong> melting, purifying and casting<br />
operations. It also includes <strong>the</strong> salt slag processing. EAA and OEA (Organisation of<br />
<strong>European</strong> <strong>Aluminium</strong> refiners and remelters) worked toge<strong>the</strong>r <strong>for</strong> developing this<br />
‘recycling’ dataset.<br />
The ‘recycling’ dataset is based on <strong>the</strong> recycling of <strong>the</strong> <strong>European</strong> scrap mix according<br />
to <strong>the</strong> ESSUM model [6]. Recycling efficiency and recycling routes highly depend on<br />
scrap origin and quality. As a result, <strong>for</strong> specific aluminium applications or products,<br />
it is highly recommended to analyse more closely <strong>the</strong> recycling scenario(s) and <strong>the</strong><br />
recycling routes in order to develop more adapted models and associated LCI datasets.<br />
Please contact EAA (LCI@eaa.be) or OEA (www.oea-alurecycling.org) <strong>for</strong> more<br />
specific in<strong>for</strong>mation.<br />
Page 8 of 72
2.2 How to use <strong>the</strong>se LCI datasets in LCA studies<br />
EAA recommends using <strong>the</strong>se LCI datasets in accordance with methodologies within<br />
<strong>the</strong> framework of <strong>the</strong> following international standards:<br />
• ISO 14040:2006 <strong>Environmental</strong> Management - Life Cycle Assessment –<br />
Principles and framework<br />
• ISO 14044:2006 <strong>Environmental</strong> Management – Life Cycle Assessment –<br />
Requirements and guidelines<br />
The following key features of <strong>the</strong>se standards are of special importance <strong>for</strong> aluminium<br />
• LCA is a technique <strong>for</strong> assessing <strong>the</strong> environmental aspects and potential<br />
impacts associated with a product or a service,<br />
• LCA should include <strong>the</strong> following phases:<br />
- Goal and Scope Definition<br />
- Life Cycle Inventory Analysis<br />
- Life Cycle Impact Assessment<br />
- Interpretation.<br />
LCA covers product systems which comprise <strong>the</strong> full life cycle of a product, including<br />
raw material acquisition, fabrication, transportation, use, recycling/disposal and<br />
energy and ancillary material supply operations. Ideally, elementary flows should<br />
constitute <strong>the</strong> sole input and output of such a product system, i.e. material or energy<br />
which is drawn from <strong>the</strong> environment or which is discarded to <strong>the</strong> environment<br />
without subsequent human trans<strong>for</strong>mation.<br />
As previously stated, <strong>the</strong> LCI modelling includes system extension to ancillary<br />
processes so that LCI datasets are mainly composed of elementary flows. These<br />
LCI datasets are <strong>the</strong>n ready <strong>for</strong> integration into LCA studies or LCI databases. (see<br />
section 2.8 on system boundaries).<br />
Regarding recycling, <strong>the</strong> <strong>European</strong> aluminium industry recommends crediting <strong>the</strong><br />
environmental benefits resulting from recycling through <strong>the</strong> so-called ‘substitution’<br />
methodology. This methodology is explained within <strong>the</strong> technical paper “aluminium<br />
recycling in LCA” downloadable from <strong>the</strong> EAA website (www.aluminium.org).<br />
2.3 Data collection, consolidation and averaging<br />
Inventory data <strong>for</strong> <strong>European</strong> aluminium production have been collected with full<br />
reference to ISO standards 14040 and 14044 on Life Cycle Assessment.<br />
The present life cycle inventory data <strong>for</strong> aluminium is derived from various industry<br />
surveys covering <strong>the</strong> year 2005. The various <strong>European</strong> plants participating in <strong>the</strong><br />
survey delivered absolute figures of process inputs/outputs <strong>for</strong> <strong>the</strong> whole year 2005<br />
(tonnes, GJ, m 3 , etc.). After aggregation, <strong>the</strong>se input and output data were used to<br />
calculate <strong>European</strong> averages. These <strong>European</strong> averages were <strong>the</strong>n integrated within<br />
specific LCI models in order to generate associated LCI datasets.<br />
To generate <strong>the</strong> <strong>European</strong> average, an horizontal aggregation was used,<br />
i.e. averaging <strong>for</strong> each fabrication step. This horizontal aggregation supports <strong>the</strong><br />
Page 9 of 72
modular approach which allows an easy combination between <strong>the</strong> process and which<br />
gives details on <strong>the</strong> contribution of <strong>the</strong> various process steps to <strong>the</strong> complete LCI<br />
dataset.<br />
2.4 Cut-off rules<br />
Input and output data have been collected through detailed questionnaires which have<br />
been developed and refined from <strong>the</strong> first surveys organised in 1994-1996. In practice,<br />
this means that, at least, all material flows going into <strong>the</strong> aluminium processes (inputs)<br />
higher than 1% of <strong>the</strong> total mass flow (t) or higher than 1% of <strong>the</strong> total primary energy<br />
input (MJ) are part of <strong>the</strong> system and modelled in order to calculate elementary flows.<br />
All material flows leaving <strong>the</strong> product system (outputs) accounting <strong>for</strong> more than 1%<br />
of <strong>the</strong> total mass flow is part of <strong>the</strong> system. All available inputs and outputs, even<br />
below <strong>the</strong> 1% threshold, have been considered <strong>for</strong> <strong>the</strong> LCI calculation. For hazardous<br />
and toxic materials and substances <strong>the</strong> cut-off rules do not apply.<br />
2.5 Data quality, validation and modelling<br />
Expert judgement was used to identify outliers and to select data to be included in <strong>the</strong><br />
consolidation. As far as possible, be<strong>for</strong>e any decision of excluding data, reporting<br />
companies have been contacted and outliers have been possibly corrected according to<br />
<strong>the</strong> company feedback. Data consolidation, averaging and modelling have been done<br />
by <strong>the</strong> EAA in collaboration with an independent expert. The data collection<br />
procedures, <strong>the</strong> various questionnaires and <strong>the</strong> consolidated data are part of internal<br />
environmental reports which have been submitted to <strong>the</strong> reviewer <strong>for</strong> scrutiny. These<br />
reports have been validated by <strong>the</strong> EAA Product Stewardship Working Group. The<br />
LCI models (see section 2.7) have been developed in collaboration with PE-<br />
International. Six meetings have been organised with Walter Klöpffer, <strong>the</strong> reviewer,<br />
to assess <strong>the</strong> data collection and consolidation procedures and to examine <strong>the</strong>ir<br />
integration into <strong>the</strong> LCI models.<br />
2.6 Allocation principles<br />
As much as possible, allocation has been avoided by expanding <strong>the</strong> system boundaries<br />
(see section 2.8). Each LCI dataset includes <strong>the</strong> aluminium scrap and dross recycling<br />
so that <strong>the</strong> only valuable material exiting <strong>the</strong> system is <strong>the</strong> aluminium ingot or semiproduct<br />
(sheet, foil, extrusion). The only significant allocation cases concern 2<br />
ancillary processes:<br />
1) <strong>the</strong> production of caustic soda (NaOH used in <strong>the</strong> alumina production).<br />
In such a case, NaOH and Chlorine are simultaneously produced from <strong>the</strong><br />
Solvay process. LCI data related to <strong>the</strong> caustic soda production have been<br />
allocated to NaOH on a mass basis.<br />
2) The production of electricity with co-generation of steam (CHP:<br />
combined heat and power). In this case, allocation is based on <strong>the</strong><br />
exergetic content, i.e. available or utilizable energy. This allocation<br />
principle distributes <strong>the</strong> environmental aspects of electricity production<br />
based on <strong>the</strong> exergy ratio between electricity and steam. The exergy<br />
corresponds to <strong>the</strong> utilisable energy of a system, i.e. <strong>the</strong> maximum work<br />
possible with <strong>the</strong> electricity and <strong>the</strong> steam that brings <strong>the</strong> system into<br />
equilibrium with <strong>the</strong> environment. The exergy from electricity corresponds<br />
directly to <strong>the</strong> delivered electrical energy. The exergy from steam depends<br />
on <strong>the</strong> initial temperature and pressure of <strong>the</strong> steam (be<strong>for</strong>e use) and its<br />
Page 10 of 72
final temperature and pressure after work delivery. Co-generation is used<br />
currently <strong>for</strong> about 15% of <strong>the</strong> <strong>European</strong> electricity production (source<br />
COGEN EUROPE, The <strong>European</strong> Association <strong>for</strong> <strong>the</strong> Promotion of<br />
Cogeneration www.cogen.org). The exergy of steam is usually comprised<br />
between 20 and 40% of <strong>the</strong> total exergy output. As a result, <strong>for</strong> <strong>the</strong> EU25<br />
electricity grid mix, such allocation principle distributes about 5% of <strong>the</strong><br />
environmental aspects to <strong>the</strong>rmal energy (steam) while 95% are attributed<br />
to <strong>the</strong> electricity production. Regarding <strong>the</strong> electricity model developed <strong>for</strong><br />
<strong>the</strong> primary aluminium production, allocation to <strong>the</strong>rmal energy (steam) is<br />
much lower than 5% due to <strong>the</strong> high hydropower share and <strong>the</strong> low coalbased<br />
electricity production resulting in a lower CHP ratio.<br />
The incineration of solid waste considers energy recovery (<strong>the</strong>rmal and electricity).<br />
To avoid any allocation, such energy is directly re-introduced in <strong>the</strong> LCI model and<br />
<strong>the</strong> energy input is reduced accordingly. This procedure corresponds to energetic<br />
closed-loop recycling. In any case, such energy input from incineration is very limited<br />
(less than 1%).<br />
2.7 Software tool <strong>for</strong> LCI data modelling<br />
The LCI data modelling requires not only <strong>the</strong> combination of <strong>the</strong> various aluminium<br />
processes involved in <strong>the</strong> production chain but also <strong>the</strong>ir connection to ancillary<br />
processes like electricity production, fuel extraction and preparation or ancillary raw<br />
material production. In a full LCA, <strong>the</strong> Life Cycle Inventory analysis is ideally based<br />
on elementary flows, i.e. material or energy which is drawn from <strong>the</strong> environment or<br />
which is discarded to <strong>the</strong> environment without subsequent human trans<strong>for</strong>mation.<br />
Since LCI datasets constitute <strong>the</strong> building blocks of <strong>the</strong> Life Cycle Inventory analysis,<br />
<strong>the</strong>y should be ideally based on elementary flows, except <strong>for</strong> some valuable input(s)<br />
or/and output(s), i.e. aluminium semi-products in <strong>the</strong>se specific cases.<br />
The GaBi software version 4 [13] has been used to model and develop <strong>the</strong> various<br />
LCI datasets related to <strong>the</strong> year 2005. Previously, <strong>the</strong> EAA LCI datasets were<br />
produced with <strong>the</strong> so-called “LCA-2” software which was specifically developed <strong>for</strong><br />
this purpose. The use of <strong>the</strong> GaBi software allows including additional processes and<br />
materials within <strong>the</strong> system boundaries and also offers more modelling possibilities.<br />
As a result, <strong>the</strong> new LCI modelling approach has been refined and improved in order<br />
to better approach reality. In addition, updated LCI data included in <strong>the</strong> GaBi software<br />
have been used <strong>for</strong> ancillary processes while <strong>the</strong> “LCA-2” software mainly used data<br />
from BUWAL 250 [11]. Main differences between <strong>the</strong> current modelling approach<br />
(i.e. year 2005) and past modelling approach (years 2002 &1998) are reported in<br />
section 2.11.<br />
2.8 System boundaries & background data<br />
The aluminium processes need to be supplemented by relevant supply subsystems or<br />
processing subsystems <strong>for</strong> input and output flows. This system extension is shown in<br />
Fig. 2.2 <strong>for</strong> energy and ancillary raw materials. Instead of reporting <strong>the</strong> different<br />
<strong>for</strong>ms of energy used or listing non-elementary flows, this system extension allows to<br />
list elementary flow data of <strong>the</strong> energy supply subsystem or ancillary raw material<br />
subsystem, i.e. element which are directly drawn from <strong>the</strong> environment. Outputs are<br />
<strong>the</strong>n ideally emissions to water, soil and air. In current LCA methodology, solid<br />
wastes are not listed as elementary flows provided <strong>the</strong>y are recycled, incinerated,<br />
Page 11 of 72
composted or legally landfilled. This LCA methodology integrates such incineration,<br />
recycling or landfilling operations within <strong>the</strong> system boundaries and models <strong>the</strong><br />
emissions associated with such operations. In <strong>the</strong> various LCI datasets developed<br />
within this report, <strong>the</strong> treatment of <strong>the</strong> solid wastes have not been modelled and<br />
integrated within <strong>the</strong> system boundaries, excepted <strong>for</strong> <strong>the</strong> incineration operation. In a<br />
next survey, specific data will be collected on solid waste processing and treatment in<br />
order to be able to model such operations and to integrate <strong>the</strong>m within <strong>the</strong> system<br />
boundaries.<br />
System<br />
boundaries<br />
Al production<br />
process<br />
Fig. 2.2 Inclusion of supplementary processes<br />
In addition to <strong>the</strong> environmental data related to <strong>the</strong> aluminium processes collected<br />
through <strong>the</strong> EAA surveys, additional inventory datasets (background data) related to<br />
supplementary processes have been used. The most important are (list not<br />
exhaustive):<br />
o Limestone production<br />
o Caustic soda production<br />
o <strong>Aluminium</strong> fluoride production<br />
o Petroleum coke production<br />
o Pitch production<br />
o Electricity supply systems<br />
o Fuel supply systems and fuel combustion<br />
o Transportation (boat only)<br />
For Bauxite mining, dataset from <strong>the</strong> International <strong>Aluminium</strong> Institute (reference<br />
year 2005) has been used [5]. For <strong>the</strong> supplementary processes as well as <strong>for</strong><br />
transport, <strong>the</strong> background data available within <strong>the</strong> GaBi software version 4 have been<br />
used [13].<br />
2.8.1 Thermal energy used in aluminium processes<br />
Many aluminium processes use fossil fuels (natural gas, propane, diesel, coal, etc.) as<br />
<strong>the</strong>rmal energy sources. While input figures have been collected regarding <strong>the</strong><br />
consumption of <strong>the</strong>se fuels, only restricted data have been collected regarding <strong>the</strong> air<br />
emissions which are mainly associated with <strong>the</strong> combustion of <strong>the</strong>se fuels. The<br />
collected data usually covers only particulates, SO 2 and NO x .<br />
Page 12 of 72
In order to consider properly <strong>the</strong> various air emissions associated with <strong>the</strong> combustion<br />
of <strong>the</strong> fuels, <strong>the</strong> modelling also includes <strong>the</strong> use of LCI data <strong>for</strong> fuel supply systems<br />
and fuel combustion which are available in <strong>the</strong> GaBi software (reference year 2002 –<br />
EU25).<br />
As schematised in Fig.2.3 <strong>for</strong> <strong>the</strong> air emissions associated with <strong>the</strong> alumina<br />
production process, <strong>the</strong> survey reported figures, i.e. particulates, SO 2 and NOx, are<br />
<strong>the</strong>n complemented with all <strong>the</strong> o<strong>the</strong>r air emissions which are associated with <strong>the</strong><br />
preparation and <strong>the</strong> combustion of <strong>the</strong>se fossil fuels. Precautions were taken to avoid<br />
double counting of <strong>the</strong> reported emissions.<br />
Total air emissions<br />
Heavy oil extraction, preparation<br />
& combustion<br />
(LCI data from GaBi)<br />
Natural gas extraction,<br />
preparation & combustion<br />
(LCI data from GaBi)<br />
GJ<br />
GJ<br />
Alumina<br />
Production<br />
Emissions reported at <strong>the</strong><br />
alumina production step,<br />
i.e. particulates, SO2 and<br />
NOx<br />
Air emissions coming<br />
from <strong>the</strong> LCI data related<br />
to fuel extraction,<br />
preparation and<br />
combustion<br />
Fig. 2.3 Use of background LCI data related to fuel supply systems and<br />
combustion (Background GaBi LCI data in blue)<br />
The total air emission from <strong>the</strong> alumina production is <strong>the</strong>n a combination of reported<br />
figures <strong>for</strong> <strong>the</strong> main emissions completed with LCI data representative <strong>for</strong> fuel<br />
extraction, preparation and combustion. This approach has been systematically<br />
applied <strong>for</strong> any aluminium processes in which fuel combustion takes place.<br />
2.8.2 Electricity production<br />
Electricity production has been included in <strong>the</strong> system boundaries. Electricity<br />
production is particularly critical <strong>for</strong> <strong>the</strong> electrolysis step since about 15 MWh/tonne<br />
of primary aluminium is used. A specific model has been developed to take into<br />
account <strong>the</strong> structure of <strong>the</strong> <strong>European</strong> primary aluminium production as well as <strong>the</strong><br />
primary aluminium imports to <strong>the</strong> <strong>European</strong> market. This model is described in <strong>the</strong><br />
section 3.4.<br />
For all <strong>the</strong> o<strong>the</strong>r aluminium processes, LCI data related to <strong>the</strong> EU25 electricity model<br />
(reference year 2002) are used. The corresponding power grid mix is reported in Fig<br />
2.4. This EU25 electricity LCI dataset considers 6% of transmission losses. In <strong>the</strong><br />
previous LCI modelling project referring to <strong>the</strong> years 1998 and 2002, <strong>the</strong> UCPTE<br />
electricity model was used. The distribution of <strong>the</strong> energy sources within this UCPTE<br />
model and <strong>the</strong> EU-25 model is quite significant as reported in table 2.1. Shares of<br />
hydropower and nuclear energy are significantly reduced in EU25 model vs. UCPTE<br />
while fossil fuel energy is significantly up, about 53% in EU25 model vs. 43% <strong>for</strong> <strong>the</strong><br />
UCPTE model. As a result, CO 2 & GHG emissions are increased of about 25% in <strong>the</strong><br />
new EU25 model in comparison to <strong>the</strong> UCPTE model. This change will significantly<br />
Page 13 of 72
affect <strong>the</strong> LCI data using <strong>the</strong> EU25 electricity model. It is particularly <strong>the</strong> case <strong>for</strong> <strong>the</strong><br />
sheet, foil and extrusion processes.<br />
Table 2.1 Main energy sources <strong>for</strong> <strong>the</strong> UCPTE and EU-25 electricity models<br />
Electricity Model EU25 (2002) UCPTE<br />
Used in EAA model 2005 1998 & 2002<br />
Share of Energy sources<br />
Hydro 10,3% 16,4%<br />
Hard Coal 18,9% 17,4%<br />
Brown coal 10,7% 7,8%<br />
Oil 6,0% 10,7%<br />
Gas 17,3% 7,4%<br />
Nuclear 32,1% 40,3%<br />
O<strong>the</strong>rs 4,7%<br />
Total 100,0% 100,0%<br />
Main emissions (kg/MWh)<br />
CO2 535 429<br />
Dust 0,116 0,512<br />
NOx (as NO2) 0,99 0,92<br />
SO2 2,74 2,26<br />
GHG emission<br />
Kg CO2-equiv./MWh 564 454<br />
Fig. 2.4 EU25 Power grid mix <strong>for</strong> electricity production used in <strong>the</strong> LCI modelling<br />
(except <strong>for</strong> primary aluminium production) © PE International – GaBi database,<br />
reference year 2002<br />
2.8.3 Transport<br />
Only <strong>the</strong> sea transport of bauxite and alumina has been modelled and integrated into<br />
<strong>the</strong> LCI dataset <strong>for</strong> primary aluminium. No transport data have been integrated into<br />
<strong>the</strong> o<strong>the</strong>r LCI datasets.<br />
Bauxite used in Europe is imported, mainly from Guinea, Australia and Brazil.<br />
Average transport distance <strong>for</strong> imported bauxite is about 8500 km by sea. Average<br />
transport distance <strong>for</strong> <strong>the</strong> imported alumina to Europe is around 8000 km by sea. The<br />
Page 14 of 72
model also considers 1000 km as <strong>the</strong> transport distance <strong>for</strong> bauxite used in <strong>the</strong><br />
alumina plants exporting to Europe. No transport distance has been considered <strong>for</strong> <strong>the</strong><br />
alumina produced in Europe. This transport model has been used also <strong>for</strong> bauxite and<br />
alumina which are used <strong>for</strong> <strong>the</strong> production of primary aluminium which is imported<br />
into Europe. Fig. 2.5 summarises <strong>the</strong> average transport distances used in <strong>the</strong> model.<br />
Bauxite mining (Guinea, Australia, Brazil, etc.)<br />
70% 8500km 30% 1000km<br />
Alumina production - Europe<br />
Alumina production - Imports<br />
(Jamaica, Surinam, Brazil)<br />
70%<br />
no transport<br />
considered 30% 8000km<br />
Primary <strong>Aluminium</strong> production -Europe<br />
Fig. 2.5 Average sea transport distances of bauxite and alumina<br />
A specific fuel consumption of 0.54 g of heavy oil per tonne transported and per km<br />
has been used (bulk carrier between 10.000 and 200.000 tonnes). As a result, <strong>the</strong><br />
transport of 1 tonne of alumina or bauxite on 8.000 km gives <strong>the</strong>n a consumption of<br />
4.29 kg of heavy oil.<br />
In 1998 survey, data related to road and rail transport distances were also collected<br />
and transport distances of alumina and bauxite by <strong>the</strong>se 2 transport means were also<br />
modelled. In a next survey, new data should be collected to include <strong>the</strong>se road and rail<br />
transports into <strong>the</strong> LCI model. The table 2.2 highlights <strong>the</strong> main differences between<br />
2005 & 1998 transport model.<br />
Table 2.2 Average transport distances <strong>for</strong> bauxite and alumina<br />
Year<br />
1998 & 2002<br />
Type of<br />
transport<br />
Bauxite Alumina<br />
Ocean/Cargo km 7106 3737<br />
Coastal/barge km 2 204<br />
Road km 334 15<br />
Rail km 11 42<br />
2005 Ocean/Cargo km 6250* 2400*<br />
*Average distances considering also imported bauxite and alumina.<br />
2.9 LCI data and environmental indicators<br />
The above described modelling allows developing LCI datasets which are mainly<br />
composed of elementary flows. The detailed datasets are available on request as excel<br />
document (please email lci@eaa.be). For each dataset, most significant and relevant<br />
elementary flows are also reported in this master document as summary tables.<br />
For each LCI dataset, indicators have been calculated and reported <strong>for</strong> a pre-defined<br />
set of impact categories. It is important to highlight that <strong>the</strong>se environmental<br />
Page 15 of 72
indicators are purely in<strong>for</strong>mative and should not be used <strong>for</strong> evaluating <strong>the</strong><br />
environmental aspects of aluminium processes in Europe or <strong>for</strong> comparative<br />
purposes between various materials. As highlighted in ISO 14040 and 14044,<br />
only <strong>the</strong> environmental aspects of a product system or a service in a life cycle<br />
perspective, i.e. from cradle to grave or from cradle to recycling, is<br />
environmentally sound. The predefined set of impact categories is reported in Table<br />
2.3. Table 2.4 gives a short explanation and definition of <strong>the</strong>se impact categories.<br />
Table 2.3 Pre-defined set of environmental impact categories.<br />
Impact categories Unit Methodology<br />
Depletion of Abiotic Resources (ADP) [kg Sb-Equiv.] CML2001<br />
Acidification Potential (AP) [kg SO 2 -Equiv.] CML2001<br />
Eutrophication Potential (EP) [kg Phosphate-Equiv.] CML2001<br />
Greenhouse Gas emission (GWP 100 years) [kg CO 2 -Equiv.] CML2001<br />
Ozone Layer Depletion Potential (ODP, steady state) [kg R11-Equiv.] CML2001<br />
Photo-oxidant Creation Potential (POCP) [kg E<strong>the</strong>ne-Equiv.] CML2001<br />
Primary energy from renewable raw materials [MJ] net cal. value<br />
Primary energy from non-renewable resources [MJ] net cal. value<br />
Table 2.4 Brief description of <strong>the</strong> pre-selected environmental impact categories<br />
Indicator<br />
Short description<br />
Resources are classified on <strong>the</strong> basis of <strong>the</strong>ir origin as biotic and abiotic. Biotic resources are derived<br />
Depletion of<br />
from living organisms. Abiotic resources are derived from <strong>the</strong> non-living world (e.g., land, water, and<br />
Abiotic Resources<br />
air). Mineral and power resources are also abiotic resources, some of which (like fossil fuels) are<br />
(ADP)<br />
Acidification<br />
Potential (AP)<br />
Eutrophication<br />
Potential (EP)<br />
Greenhouse Gas<br />
emission (GWP<br />
100 years)<br />
Ozone Layer<br />
Depletion<br />
Potential (ODP,<br />
steady state)<br />
Photo-oxidant<br />
Creation Potential<br />
(POCP)<br />
Primary energy<br />
from renewable<br />
raw materials<br />
Primary energy<br />
from nonrenewable<br />
resources<br />
derived from <strong>for</strong>merly living nature. ADP estimates <strong>the</strong> consumption of <strong>the</strong>se abiotic resources.<br />
This relates to <strong>the</strong> increase in quantity of acid substances in <strong>the</strong> low atmosphere, at <strong>the</strong> cause of “acid<br />
rain” and <strong>the</strong> decline of surface waters and <strong>for</strong>ests. Acidification potential is caused by direct outlets of<br />
acids or by outlets of gases that <strong>for</strong>m acid in contact with air humidity and are deposited to soil and<br />
water. Examples are: SO 2 , NOx, Ammonia. The main sources <strong>for</strong> emissions of acidifying substances<br />
are agriculture and fossil fuel combustion used <strong>for</strong> electricity production, heating and transport.<br />
Aqueous eutrophication is characterized by <strong>the</strong> introduction of nutrients in <strong>the</strong> <strong>for</strong>m of phosphatised<br />
and nitrogenous compounds <strong>for</strong> example, which leads to <strong>the</strong> proliferation of algae and <strong>the</strong> associated<br />
adverse biological effects. This phenomenon can lead to a reduction in <strong>the</strong> content of dissolved oxygen<br />
in <strong>the</strong> water which may result to <strong>the</strong> death of flora and fauna.<br />
The “greenhouse effect” is <strong>the</strong> increase in <strong>the</strong> average temperature of <strong>the</strong> atmosphere caused by <strong>the</strong><br />
increase in <strong>the</strong> average atmospheric concentration of various substances of anthropogenic origin (CO 2 ,<br />
methane, CFC...). Greenhouse gases are components of <strong>the</strong> atmosphere that contribute to <strong>the</strong><br />
greenhouse effect by reducing outgoing long wave heat radiation resulting from <strong>the</strong>ir absorption by<br />
<strong>the</strong>se gases like CO 2 , CH4 and PFC.<br />
Stratospheric ozone depletion (especially above poles) results mainly from a catalytic destruction of<br />
ozone by atomic chlorine and bromine. The main source of <strong>the</strong>se halogen atoms in <strong>the</strong> stratosphere is<br />
photodissociation of chlorofluorocarbon (CFC) compounds, commonly called freons, and of<br />
bromofluorocarbon compounds known as halons. These compounds are transported into <strong>the</strong><br />
stratosphere after being emitted at <strong>the</strong> surface.<br />
The majority of tropospheric ozone <strong>for</strong>mation occurs when nitrogen oxides (NOx), carbon monoxide<br />
(CO) and volatile organic compounds (VOCs), such as xylene, react in <strong>the</strong> atmosphere in <strong>the</strong> presence<br />
of sunlight. NOx and VOCs are called ozone precursors. There is a great deal of evidence to show that<br />
high concentrations (ppm) of ozone, created by high concentrations of pollution and daylight UV rays<br />
at <strong>the</strong> earth's surface, can harm lung function and irritate <strong>the</strong> respiratory system<br />
Primary energy is energy that has not been subjected to any conversion or trans<strong>for</strong>mation process.<br />
Renewable energy refers to solar power, wind power, hydroelectricity, biomass and biofuels. For<br />
aluminium primary production, hydropower is <strong>the</strong> most significant renewable energy <strong>for</strong> electricity<br />
production.<br />
Primary energy is energy that has not been subjected to any conversion or trans<strong>for</strong>mation process. Nonrenewable<br />
energy is energy taken from finite resources like coal, crude oil, natural gas or uranium.<br />
For each LCI dataset, <strong>the</strong> various processes and materials involved in <strong>the</strong> system<br />
boundaries have been classified in 5 categories, i.e. direct processes, auxiliary,<br />
Page 16 of 72
transport, electricity and <strong>the</strong>rmal energy so that <strong>the</strong> LCI data and <strong>the</strong> indicators can<br />
be distributed among such 5 categories. These 5 categories are defined as follows:<br />
- Direct process: Direct material consumption/use or direct emissions<br />
associated with <strong>the</strong> aluminium processes. The following processes are considered as<br />
aluminium processes:<br />
• Primary production: bauxite mining, alumina production,<br />
•<br />
•<br />
anode/paste production, electrolysis, casting.<br />
Semi-production: ingot homogenisation, ingot scalping, hot rolling,<br />
cold rolling, annealing, finishing & packaging, extrusion, foil rolling,<br />
scrap remelting, dross recycling.<br />
Recycling: scrap preparation (shredding, baling, etc.), scrap remelting,<br />
scrap refining, dross recycling, salt slag treatment.<br />
- Electricity: all <strong>the</strong> processes and materials needed to produce <strong>the</strong> electricity<br />
directly used by <strong>the</strong> aluminium processes. It includes fuel extraction and preparation.<br />
- Thermal energy: all <strong>the</strong> processes and materials needed to produce <strong>the</strong><br />
<strong>the</strong>rmal energy directly used in <strong>the</strong> aluminium processes, excluding pitch and coke<br />
used <strong>for</strong> <strong>the</strong> anode production<br />
- Auxiliary: all ancillary processes and materials used in <strong>the</strong> aluminium<br />
processes. It concerns mainly caustic soda, lime and aluminium fluoride.<br />
- Transport: Only sea transport <strong>for</strong> bauxite and alumina.<br />
2.10 Critical review by independent expert<br />
The data collection and consolidation exercise as well as <strong>the</strong> LCI datasets<br />
development have been reviewed by Professor Dr. Walter Klöpffer, Editor-in-chief,<br />
International Journal of Life Cycle Assessment, Am Dachsberg 56E, D-60435<br />
Frankfurt. The reviewing report of Professor Klöpffer is annexed at <strong>the</strong> end of this<br />
document. The reviewing process has been organised through an interactive approach<br />
and in agreement with <strong>the</strong> ISO 14040 and 14044 recommendations. Six meetings<br />
were organised with <strong>the</strong> reviewer in order to present and assess <strong>the</strong> data collection and<br />
consolidation procedures and to examine <strong>the</strong>ir integration into <strong>the</strong> LCI models.<br />
2.11 Main differences between current and past modelling approaches<br />
Table 2.5 summarises <strong>the</strong> main differences between <strong>the</strong> current and past modelling<br />
approaches. A major difference concerns <strong>the</strong> modelling tool. The updated LCI data<br />
have been modelled with <strong>the</strong> GaBi software (version 4) which includes LCI data <strong>for</strong><br />
<strong>the</strong> various ancillary processes. This new tool gives definitely more modelling<br />
possibilities than <strong>the</strong> previous software, i.e. <strong>the</strong> so-called “LCA-2”, which was<br />
developed specifically <strong>for</strong> <strong>the</strong> <strong>European</strong> <strong>Aluminium</strong> Association and which contained<br />
a limited number of LCI data <strong>for</strong> ancillary processes. The geographical boundaries has<br />
also been expanded from “EU15 + EFTA countries” to “EU27+EFTA countries”. The<br />
substitution of alloying elements by pure aluminium in <strong>the</strong> model is also a novelty<br />
compared to previous modelling approach. This substitution of alloying elements<br />
allows an easy tracking of <strong>the</strong> metal loss from <strong>the</strong> new LCI datasets while it was not<br />
directly possible with <strong>the</strong> “old” datasets.<br />
For <strong>the</strong> primary model, a new and refined electricity model has been developed. This<br />
model is explained under <strong>the</strong> section 3.4. The modelling of <strong>the</strong> cast house has been<br />
also slightly changed to include <strong>the</strong> sawing of ingot ends and <strong>the</strong>ir direct remelting.<br />
Page 17 of 72
For semi-finished products production and scrap remelting, <strong>the</strong> most significant<br />
change concerns <strong>the</strong> inclusion in <strong>the</strong> model of <strong>the</strong> dross recycling and <strong>the</strong> salt slag<br />
treatment. For foil production, <strong>the</strong> new model assumes that 20% of <strong>the</strong> production<br />
uses strip casting technology while <strong>the</strong> old model was based only on <strong>the</strong> classical<br />
production route; no distinction between thin and thick gauges have been possible<br />
from <strong>the</strong> new collected data. For <strong>the</strong> refining model, a new <strong>European</strong> scrap mass flow<br />
analysis based on <strong>the</strong> ESSUM model [6] has been used to better control <strong>the</strong> material<br />
input into <strong>the</strong> recycling model.<br />
Table 2.5 Main differences between LCI modelling approaches of 1998 and 2005<br />
Generic differences 2005 2002 & 1998<br />
Modelling tool GaBi software LCA 2 software<br />
Main data sources <strong>for</strong> ancillary processes<br />
GaBi & ELCD<br />
(ref years between 2002 & 2006)<br />
BUWAL 250<br />
(ref year 1998)<br />
Geographical boundaries EU 27 + EFTA EU 15 + EFTA<br />
Electricity production model (excluding EU25 model developed in GaBi UCPTE model<br />
electrolysis step)<br />
(2002 figures)<br />
LCI data modularity<br />
(i.e. easy combination between <strong>the</strong> LCI<br />
datasets)<br />
Yes<br />
(Substitution of alloying<br />
elements by pure aluminium and<br />
dross/salt slag recycling are<br />
included)<br />
No<br />
(No substitution of alloying<br />
elements by pure aluminium<br />
and dross & salt slag recycling<br />
not included)<br />
Specific differences 2005 2002 & 1998<br />
Transport<br />
modelling<br />
Only sea transport <strong>for</strong> bauxite<br />
and alumina<br />
Sea, rail and road transport <strong>for</strong><br />
bauxite and alumina<br />
<strong>European</strong><br />
Electricity model<br />
Primary aluminium<br />
modelling<br />
Semi-production<br />
(extrusion, rolling,<br />
foil)<br />
Sheet production<br />
Foil production<br />
Recycling<br />
Electricity model<br />
<strong>for</strong> imports<br />
Cast house<br />
Production chain<br />
Process<br />
recycling<br />
scrap<br />
Ingot<br />
homogenisation<br />
Modelling<br />
Foil gauge<br />
Remelting model<br />
Refining model<br />
Based on a consolidation of<br />
energy sources at country level<br />
and a modelling of electricity<br />
production at country level<br />
which is <strong>the</strong>n consolidated at<br />
<strong>European</strong> level<br />
Based on national grid mix of<br />
significant importing countries<br />
and specific mix <strong>for</strong> Russian<br />
aluminium producers<br />
Based on real conditions<br />
considering <strong>the</strong> recycling of<br />
sawn ends, sawn ingot as output<br />
All process steps from ingot up<br />
to semi-product, excluding ingot<br />
sawing<br />
The recycling of all <strong>the</strong> scrap<br />
produced along production chain<br />
are considered, including <strong>the</strong><br />
dross and salt slag recycling,<br />
sawn ingot as output<br />
Included<br />
Based 20% on strip casting and<br />
80% on classical production<br />
route<br />
No distinction between thick and<br />
thin gauge<br />
Dross recycling and salt slag<br />
treatment included<br />
<strong>Aluminium</strong> scrap input based on<br />
ESSUM model [6].<br />
Based on a consolidation of<br />
energy sources at <strong>European</strong><br />
level and <strong>the</strong> modelling of<br />
electricity production based on<br />
<strong>the</strong> consolidated <strong>European</strong><br />
electricity mix<br />
Based on IAI 1995 statistical<br />
report on energy sources and<br />
specific grid mix <strong>for</strong> Russian<br />
producers based on GDA study<br />
(German <strong>Aluminium</strong><br />
Association)<br />
Based on virtual aluminium<br />
input of 100% liquid<br />
aluminium, unsawn ingot as<br />
output<br />
All process steps from ingot up<br />
to semi-product, including ingot<br />
sawing.<br />
The remelting of all <strong>the</strong> scrap<br />
produced along production<br />
chain are considered, but <strong>the</strong><br />
recycling of <strong>the</strong> dross and salt<br />
slag is not included, unsawn<br />
ingot as output<br />
Not directly included (see page<br />
22 of <strong>the</strong> previous report)<br />
Based 100% on classical<br />
production route (hot rolling,<br />
cold rolling and foil production)<br />
Distinction between thin gauge<br />
(5-20µm) and thick gauge (20-<br />
200µm)<br />
Dross recycling and salt slag<br />
treatment NOT included<br />
No specific model <strong>for</strong> scrap<br />
flow analysis<br />
Page 18 of 72
3. Primary production<br />
3.1 Process steps description<br />
3.1.1 Bauxite Mining<br />
The common raw material <strong>for</strong> aluminium production, bauxite is composed primarily<br />
of one or more aluminium hydroxide compounds, plus silica, iron and titanium oxides<br />
as <strong>the</strong> main impurities.<br />
More than 150 million tonnes of bauxite are mined each year. The major locations of<br />
deposits are found in a wide belt around <strong>the</strong> equator. Bauxite is currently being<br />
extracted in Australia (in excess of 40 million tonnes per year), Central and South<br />
America (Jamaica, Brazil, Surinam, Venezuela, Guyana), Africa (Guinea), Asia<br />
(India, China), Russia, Kazakhstan and Europe (Greece). Bauxite is mainly extracted<br />
by open-cast mining.<br />
The environmental data related to bauxite mining have been collected and developed<br />
by <strong>the</strong> International <strong>Aluminium</strong> Institute (IAI) <strong>for</strong> <strong>the</strong> year 2005 [5] (see table 3.2).<br />
3.1.2 Alumina production<br />
Bauxite has to be processed into pure aluminium oxide (alumina) be<strong>for</strong>e it can be<br />
converted to aluminium by electrolysis. This is achieved through <strong>the</strong> use of <strong>the</strong> Bayer<br />
chemical process in alumina refineries. The aluminium oxide contained in bauxite is<br />
selectively leached from <strong>the</strong> o<strong>the</strong>r substances in an alkaline solution within a digester.<br />
Caustic soda and lime are <strong>the</strong> main reactants in this leaching process which takes<br />
place in autoclaves at temperature between 100 and 350°C (depending on alumina<br />
reactivity). The solution is <strong>the</strong>n filtered to remove all insoluble particles which<br />
constitute <strong>the</strong> so-called red mud. On cooling, <strong>the</strong> aluminium hydroxide is <strong>the</strong>n<br />
precipitated from <strong>the</strong> soda solution, washed and dried while <strong>the</strong> soda solution is<br />
recycled. The aluminium hydroxide is <strong>the</strong>n calcined, usually in fluidised-bed furnaces,<br />
at about 1100°C. The end-product, aluminium oxide (Al 2 O 3 ), is a fine grained white<br />
powder.<br />
Bauxite<br />
Precipitator<br />
NaOH<br />
Crusher<br />
Filter<br />
Calcination<br />
Cooler<br />
Al 2<br />
O 3<br />
x 3H 2<br />
O<br />
Digester<br />
Red Mud Residue<br />
Alumina Al 2 O 3<br />
Fig.3.1 Alumina production process<br />
Page 19 of 72
About 2.2 tonnes of bauxite is used in Europe per tonne of alumina. The calcination<br />
process and, to a lesser extent, <strong>the</strong> leaching process consumes most of <strong>the</strong> <strong>the</strong>rmal<br />
energy. About 10 GJ of <strong>the</strong>rmal energy is used per tonne of alumina as well as<br />
230 kWh/t of electricity (see table 3.3 <strong>for</strong> details).<br />
Solid waste arising in alumina production are composed of 2 main streams:<br />
- Tailings, inerts and sand which are separated from <strong>the</strong> bauxite ore prior <strong>the</strong><br />
leaching process<br />
- The residue of <strong>the</strong> leaching process which is frequently called “red mud”. Even if<br />
constituents are non-toxic and largely insoluble, red mud requests special<br />
handling due to <strong>the</strong> residual alkaline content resulting from <strong>the</strong> extraction<br />
process. Current practice is to deposit red mud on or near <strong>the</strong> site in specially<br />
designed sealed ponds from which excess water is returned to <strong>the</strong> process. With<br />
time, <strong>the</strong> alkali residues react with carbon dioxide from <strong>the</strong> air to <strong>for</strong>m sodium<br />
carbonate. Red mud disposal sites can be re-cultivated once <strong>the</strong>y have dried out.<br />
The use of red mud as filler material <strong>for</strong> road construction or as additive in<br />
cement industry is still marginal, but increasing.<br />
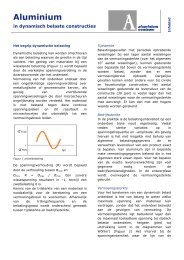
3.1.3 Electrolysis<br />
Primary aluminium is produced in electrolysis plants (frequently called "smelters"),<br />
where <strong>the</strong> pure alumina is reduced into aluminium metal by <strong>the</strong> Hall-Héroult process.<br />
Between 1920 and 1925 kg of alumina is needed to produce 1 tonne of aluminium.<br />
The reduction of alumina into liquid aluminium is operated at around 950 degrees<br />
Celsius in a fluorinated bath (i.e. cryolite) under high intensity electrical current. This<br />
process takes place in electrolytic cells (or "pots", see Fig. 3.2), where carbon<br />
cathodes <strong>for</strong>m <strong>the</strong> bottom of <strong>the</strong> pot and act as <strong>the</strong> negative electrode. Carbon anodes<br />
(positive electrodes) are held at <strong>the</strong> top of <strong>the</strong> pot and are consumed during <strong>the</strong><br />
process when <strong>the</strong>y react with <strong>the</strong> oxygen coming from <strong>the</strong> alumina. There are two<br />
major types of cell technology in use. All potlines built in Europe since <strong>the</strong> early<br />
1970s use <strong>the</strong> prebake anode technology, where <strong>the</strong> anodes, manufactured from a<br />
mixture of petroleum coke and coal tar pitch (acting as a binder), are ‘pre-baked’ in<br />
separate anode plants. In <strong>the</strong> Söderberg technology, <strong>the</strong> carbonaceous mixture is fed<br />
directly into <strong>the</strong> top part of <strong>the</strong> pot, where ‘self-baking’ anodes are produced using <strong>the</strong><br />
heat released by <strong>the</strong> electrolytic process. In 2005, <strong>the</strong> <strong>European</strong> production mix was<br />
90% of prebake technology <strong>for</strong> 10% of Söderberg technology.<br />
Page 20 of 72
Fig. 3.2 <strong>Aluminium</strong> electrolytic cell – prebake technology<br />
The electrical energy required <strong>for</strong> <strong>the</strong> primary smelting process constitutes <strong>the</strong> major<br />
part of energy consumption in aluminium primary production and has <strong>the</strong>re<strong>for</strong>e been<br />
very carefully handled. Specific consumption data have been obtained from all<br />
smelters in order to calculate a true weighted average. The total consumption consists<br />
of <strong>the</strong> following elements:<br />
- Rectifying loss<br />
- DC power usage<br />
- Pollution control equipment<br />
- Auxiliary power (general plant use)<br />
- Electric transmission losses of 2% have been taken into account from power<br />
stations to primary smelters, as all primary smelters have <strong>the</strong>ir energy<br />
delivered by high voltage lines from power stations located nearby, and<br />
operate <strong>the</strong>ir own trans<strong>for</strong>mer facilities.<br />
In 2005, <strong>the</strong> average electricity consumption of <strong>the</strong> <strong>European</strong> smelters was<br />
14914 kWh/tonne of aluminium (min. 13000 kWh – Max 18000 kWh). For imported<br />
primary aluminium which represents 36% of <strong>the</strong> use, this average electricity<br />
consumption is 15227 kWh/tonne. Both values of electricity consumption have been<br />
increased by 2% in <strong>the</strong> model <strong>for</strong> considering <strong>the</strong> transmission losses between <strong>the</strong><br />
power plant and <strong>the</strong> smelters. A specific electricity model is developed under <strong>the</strong><br />
section 3.4 <strong>for</strong> <strong>the</strong> production of <strong>the</strong> electricity which is used at <strong>the</strong> electrolysis step.<br />
3.1.4 Cast house<br />
At regular intervals, molten aluminium tapped from <strong>the</strong> pots is transported to <strong>the</strong> cast<br />
house where it is alloyed (according to <strong>the</strong> user’s needs) in holding furnaces by <strong>the</strong><br />
addition of o<strong>the</strong>r metals and aluminium scrap cleaned of oxides and gases, and <strong>the</strong>n<br />
cast into ingots. Cast houses produce a wide variety of products and alloys. Since it is<br />
not possible to produce one dataset <strong>for</strong> every type of product and alloy, average data<br />
have been developed <strong>for</strong> a generic aluminium ingot covering ingot <strong>for</strong> rolling (slabs),<br />
<strong>for</strong> extrusion (billets) or <strong>for</strong> remelting. Rolling slabs and extrusion billets (see Fig 3.3)<br />
are produced through Direct Chill (DC) casting technology (liquid metal is poured<br />
Page 21 of 72
into short moulds on a plat<strong>for</strong>m and <strong>the</strong>n cooled when <strong>the</strong> plat<strong>for</strong>m is lowered into a<br />
water-filled pit).<br />
Fig. 3.3 DC-cast extrusion billets (cylindrical) or rolling slabs (rectangular)<br />
Be<strong>for</strong>e exiting <strong>the</strong> cast house, <strong>the</strong> ends of <strong>the</strong> rolling slabs and extrusion billets are<br />
usually sawed and directly recycled into <strong>the</strong> holding furnace. In <strong>the</strong> current model, <strong>the</strong><br />
product exiting <strong>the</strong> cast house is a sawn rolling ingot, a sawn extrusion ingot or an<br />
ingot <strong>for</strong> remelting.<br />
Fur<strong>the</strong>r treatment of rolling and extrusion ingots, such as homogenisation and<br />
scalping are covered in <strong>the</strong> semi-finished product sections (see sections 4, 5 and 6)<br />
3.2 Data collection and averaging<br />
The yearly input and output data were collected through 3 environmental surveys<br />
covering <strong>the</strong> year 2005 and focussing respectively on alumina production, on anode<br />
and paste production and on electrolysis and casting. Survey coverage in terms of<br />
number of replies, tonnages and <strong>European</strong> coverage is reported in table 3.1.<br />
Table 3.1 <strong>European</strong> representativity of <strong>the</strong> primary data<br />
Process No. of responses Total production Coverage<br />
(EU27 + EFTA)<br />
Alumina production 6 6,57 Mt (89% used <strong>for</strong><br />
90%<br />
aluminium production)<br />
Paste and anode 22 (16 anodes and 6<br />
2,3 Mt 90%<br />
production<br />
paste)<br />
Electrolysis and cast<br />
house<br />
35 (27 pre-bake and 8<br />
Söderberg)<br />
4,5 Mt 92%<br />
After aggregation, <strong>European</strong> averages have been calculated according to <strong>the</strong> following<br />
reference flows:<br />
- Alumina: total tonnage of alumina production<br />
- Paste and anode: total tonnage of paste production plus total tonnage of<br />
baked anode production<br />
- Electrolysis: total tonnage of liquid aluminium produced at <strong>the</strong> electrolysis<br />
- Cast house: total tonnage of sawn ingot production<br />
Details about direct inputs and outputs of each process are given in <strong>the</strong> next subsections.<br />
Page 22 of 72
3.2.1 Bauxite mining<br />
Input and output data have been taken from <strong>the</strong> IAI survey based on <strong>the</strong> year 2005.<br />
These data, reported in table 3.2, refers to <strong>the</strong> extraction and <strong>the</strong> preparation of 1<br />
tonne of bauxite ready <strong>for</strong> delivery to <strong>the</strong> alumina plant.<br />
Table 3.2 Direct input and output data <strong>for</strong> <strong>the</strong> extraction and preparation of 1 tonne of<br />
bauxite<br />
Unit<br />
Bauxite mining<br />
Area<br />
World (IAI)<br />
Year 2005<br />
Inputs<br />
Raw materials<br />
Fresh Water m 3 0,5<br />
Sea Water m 3 0,1<br />
Fuels and electricity<br />
Diesel Oil kg 1,1<br />
Heavy Oil kg 0,2<br />
Electricity kWh 1,9<br />
Outputs<br />
Air emissions<br />
Particulates kg 0,95<br />
Water emissions<br />
Fresh Water m 3 0,47<br />
Sea Water m 3 0,05<br />
No data about land occupation and about rehabilitation conditions and time have been<br />
collected. Considering <strong>the</strong> growing importance of <strong>the</strong> land use impact category within<br />
LCA studies, it would make sense to collect such types of data within a next survey.<br />
3.2.2 Alumina production<br />
Direct input and output data related to <strong>the</strong> production of 1 tonne of alumina are<br />
reported in table 3.3. Average <strong>European</strong> figures of <strong>the</strong> year 2005 can be compared<br />
with figures of <strong>the</strong> years 2002 and 1998 as well with worldwide figures (survey<br />
organised by IAI) <strong>for</strong> <strong>the</strong> years 2000 and 2005.<br />
About 2200 kg of bauxite is used in Europe <strong>for</strong> producing 1000 kg of alumina.<br />
Bauxite consumption slightly increased since 1998 due to <strong>the</strong> progressive use of lower<br />
grade concentrate. Average bauxite consumption at worldwide level is significantly<br />
higher, i.e. around 2700 kg due to <strong>the</strong> use of lower grade concentrate. Red mud<br />
production follows this trend. While 706 kg are produced in Europe in 2005 per tonne<br />
of alumina, 1142 kg are produced at worldwide level.<br />
<strong>European</strong> producers uses 67 kg of caustic soda and 43 kg of calcined lime as reactive<br />
chemicals. 3,25 m 3 of fresh water enters <strong>the</strong> process and 1,9 m 3 exits, giving a<br />
consumption of about 1,35 m 3 . About 1,4 m 3 of water is used.<br />
<strong>European</strong> alumina production uses mainly heavy oil (204 kg/tonne) as a source of<br />
<strong>the</strong>rmal energy while worldwide production is more balanced between coal, heavy oil<br />
and natural gas. Compared to worldwide averages, <strong>the</strong>rmal energy is lower in Europe<br />
while electricity consumption is higher.<br />
Page 23 of 72
Table 3.3 Direct input and output data <strong>for</strong> <strong>the</strong> production of 1 tonne of alumina<br />
Unit<br />
Alumina production (1 tonne of<br />
alumina)<br />
Area<br />
Europe (EAA)<br />
World (IAI)<br />
Year 2005 2002 1998 2005 2000<br />
Inputs<br />
Raw materials<br />
Bauxite kg 2199 2147 2138 2739 2685<br />
Caustic Soda (NaOH 100%) kg 67 59 60 89 82<br />
Calcined Lime kg 43 47 46 40 45<br />
Fresh Water m 3 3,25 3,6 3,7 7,9 3,3<br />
Sea Water m 3 0 0,1 3,4<br />
Fuels and electricity<br />
Coal kg 0 0 8,5 88,4 96<br />
Diesel Oil kg 0,3 19,6 0 0,7 0,6<br />
Heavy Oil kg 204,1 222,4 212 101,4 115<br />
Natural Gas kg 24,0 17,6 26,4 92,8 96,8<br />
Propane kg 3,0<br />
Total Thermal energy MJ 9.514 10.649 10.043 10.970 11.925<br />
Electricity kWh 241 237 230 126 106<br />
Outputs<br />
Air emissions<br />
Particulates kg 0,23 0,21 0,67 0,17 0,63<br />
NOx (as NO2) kg 1,22 1,06 1,57 0,88 1,17<br />
SO2 kg 3,94 7,59 10,5 3,4 5,3<br />
Water emissions<br />
Fresh Water m 3 1,9 2,8 2,3 5,3 3,3<br />
Sea Water m 3 0,1 3,4<br />
Oil/Grease kg 0,078 0,084 0,47 0,07<br />
Suspended Solids kg 0,07 0,13 0,26 0,05 0,74<br />
Mercury g 0,0001 0,012 0,001<br />
By-products <strong>for</strong> external recycling<br />
Bauxite residue kg 8,4 5,8 11,1 1,2<br />
O<strong>the</strong>r by-Products kg 4,5 0,4 5,6 1,8<br />
Solid waste<br />
Bauxite residue (red mud) kg 706 713 669 1142 990<br />
O<strong>the</strong>r waste (sand, tailings, etc.) kg 60 26 21 25 25<br />
No specific data have been collected about land occupation and rehabilitation time <strong>for</strong><br />
<strong>the</strong> red mud deposits. Considering <strong>the</strong> growing importance of <strong>the</strong> land use impact<br />
category within LCA studies, it would make sense to collect such types of data within<br />
a next survey.<br />
3.2.3 Anode & paste production<br />
Direct input and output data related to <strong>the</strong> production of 1 tonne of mixed paste (10%)<br />
and anode (90%) are reported in table 3.4. Average <strong>European</strong> figures of <strong>the</strong> year 2005<br />
can be compared with figures of <strong>the</strong> years 2002 and 1998 as well with worldwide<br />
figures (survey organised by IAI) <strong>for</strong> <strong>the</strong> years 2000 and 2005.<br />
Page 24 of 72
Table 3.4 Direct input and output data <strong>for</strong> <strong>the</strong> production of 1 tonne of anode (90%<br />
prebake anode, 10% carbon paste)<br />
Unit<br />
Anode / paste production<br />
Area<br />
Europe (EAA) World (IAI)<br />
Year 2005 2002 1998 2005 2000<br />
Inputs<br />
Raw materials<br />
Petrol Coke kg 737 712 691 681 689<br />
Pitch kg 173 178 171 171 182<br />
Recycled butts kg 165 164 188 N.A. N.A.<br />
Total carbon input 1075 1054 1050<br />
O<strong>the</strong>r raw material inputs<br />
Fresh Water m 3 3 1,9 4,3 2,3 2,2<br />
Sea Water m 3 1,4 2,6 0,002<br />
Refractory materials kg 11 8,8 10,1 6,2 12,5<br />
Steel (<strong>for</strong> anodes) kg 1,2 1,6 5,1 3,1<br />
Fuels and electricity<br />
Coal kg 0 4,3 0,0 2,2 2,1<br />
Diesel Oil kg 0,02 2,7 0,2 2,3 3,2<br />
Heavy Oil kg 14,2 16,7 23,1 11,3 14,1<br />
Natural Gas kg 45,9 44,7 41,0 42,3 42,4<br />
Total Thermal energy MJ 2677 2987 2820 2568 2721<br />
Electricity kWh 145 153 131 129 141<br />
Outputs<br />
Air emissions<br />
Fluoride Gaseous (as F) kg 0,052 0,087 0,09 0,014 0,046<br />
Fluoride Particulate (as F) kg 0,035 0,063 0,05 0,002 0,01<br />
Particulates kg 0,21 0,25 0,31 0,207 0,3<br />
NOx (as NO2) kg 0,32 0,29 0,24 0,253 0,29<br />
SO2 kg 1,54 1,23 0,91 1,95 1,7<br />
Total PAH kg 0,051 0,062 0,098 0,06 0,055<br />
BaP (Benzo-a-Pyrene) g 0,14 0,67 3,2 0,08 0,24<br />
Water emissions<br />
Fresh Water m 3 2,3 0,92<br />
Sea Water m 3 1,4<br />
Fluoride (as F) kg 0,0005<br />
Oil/Grease kg 0,0001<br />
PAH (6 Borneff components) g 0,1 0,13<br />
Suspended Solids kg 0,3 0,002<br />
By-products <strong>for</strong> external recycling<br />
O<strong>the</strong>r by-Products kg 10,5 6,1 26,5 6,2 6,4<br />
Refractory material kg 6 9,3 6,7 6,9<br />
Steel kg 4,1 0,7 3,7 3,9<br />
Solid waste<br />
Carbon waste kg 1,7 5,1 4,6 18,1 5,4<br />
O<strong>the</strong>r landfill waste kg 2,6 3,2 4,1 5,7<br />
Refractory waste - landfill kg 0,4 2,6 10,5 1,8 6,2<br />
Scrubber sludges kg 0,6 0 0,5 1,9<br />
In 2002 and 2005 as compared to 1998, return butts have contributed less as raw<br />
material <strong>for</strong> <strong>the</strong> production of anodes (165 kg/t instead of 188). Use of Petrol coke has<br />
Page 25 of 72
increased accordingly (737 kg/tonne) in 2005. Fuel and electricity consumption in<br />
Europe is stable and similar to global figures. Fresh water and seawater are used<br />
mainly <strong>for</strong> gas scrubbing.<br />
Regarding air emissions, particulate fluoride (-55% over 2002) and gaseous fluoride<br />
(minus 60% over 2002) decrease in Europe but are still higher than <strong>the</strong> world (IAI)<br />
average. The more intensive use of recycled anode butts (contaminated with fluorides)<br />
may explain <strong>the</strong>se higher figures as well as possible difference in exhaust fume<br />
treatment technology. Since 1998, PAH emissions decrease to <strong>the</strong> range of <strong>the</strong> world<br />
(IAI) average. BaP is significantly reduced from 1998 (3,2g/t) till 2005 (0,14g/t) but<br />
<strong>European</strong> figure is higher than global average (0,08 g/t).<br />
By-products and waste are quite stable in Europe. Carbon waste is higher at global<br />
level than in Europe.<br />
3.2.4 Electrolysis (Smelter)<br />
Direct input and output data related to <strong>the</strong> production of 1 tonne of liquid aluminium<br />
at <strong>the</strong> electrolysis step are reported in table 3.5. Average <strong>European</strong> figures of <strong>the</strong> year<br />
2005 can be compared with figures of <strong>the</strong> years 2002 and 1998 as well with<br />
worldwide figures (survey organised by IAI) <strong>for</strong> <strong>the</strong> years 2000 and 2005.<br />
Comments on input trends<br />
Alumina consumption is stable around 1923-1925 kg/tonne. Gross (536 kg/t) and net<br />
(428kg/t) carbon anode & paste consumption are slightly down from 1998 till 2005.<br />
<strong>Aluminium</strong> fluoride consumption (18,9kg/t) is stable.<br />
<strong>European</strong> electricity consumption in 2005 reaches 14914 kWh/t, i.e. 4% down<br />
compared to 1998. This positive trend results from optimised operating conditions,<br />
combined with <strong>the</strong> progressive phasing out of Söderberg plants which reduce <strong>the</strong>ir<br />
share in total <strong>European</strong> production. Average electricity consumption at global level is<br />
about 2,5% higher in 2005, i.e. 15289 kWh/t.<br />
Fresh water is mainly use <strong>for</strong> cooling but also, in some cases, <strong>for</strong> wet scrubbing. Fresh<br />
water use highly depends on <strong>the</strong> location of <strong>the</strong> smelters since big discrepancies<br />
appear between water stressed areas, unstressed areas and coastal regions.<br />
Accordingly, <strong>the</strong> average <strong>European</strong> fresh water input figure from table 3.5 couldn’t be<br />
considered as a reliable <strong>European</strong> average.<br />
Seawater use is involved <strong>for</strong> wet scrubbing, i.e. <strong>for</strong> smelter air cleaning systems. This<br />
process is relevant to a limited number of companies, but significant quantities are<br />
reported, since <strong>the</strong> principle is based on absorbing smelter air emissions into seawater<br />
in harmless concentrations. Accordingly, <strong>the</strong> average <strong>European</strong> seawater input figure<br />
from table 3.5 cannot be considered as a reliable <strong>European</strong> average.<br />
Page 26 of 72
Table 3.5 Direct inputs and outputs <strong>for</strong> <strong>the</strong> production of 1 tonne of liquid aluminium<br />
at <strong>the</strong> electrolysis step (smelter).<br />
Unit<br />
Electrolysis<br />
Area<br />
Europe (EAA) World (IAI)<br />
Year 2005 2002 1998 2005 2000<br />
Inputs<br />
Raw materials<br />
Alumina kg 1925 1924 1923 1923 1925<br />
Anode/paste (gross) kg 536 553 557<br />
Anode/paste (net) kg 428 447 448 435 441<br />
<strong>Aluminium</strong> Fluoride kg 18,9 19,0 18,7 16,4 17,4<br />
Cathode Carbon kg 6,3 10,3 7,5 8 6,1<br />
O<strong>the</strong>r raw material inputs<br />
Fresh Water m3 9,6 5,2 5,3 2,9<br />
Sea Water m3 58 69,2 17,6 20,7<br />
Refractory materials kg 8,6 9,88 8,6 5,4 6,1<br />
Steel (<strong>for</strong> cathodes) kg 5,4 7,5 9,4 6,6 5,5<br />
Collar/ramming paste kg 6,5<br />
Fuels and electricity<br />
Diesel Oil kg 1,5<br />
Heavy Oil kg 0,7<br />
Natural Gas kg 2,4<br />
Electricity kWh 14.914 15.389 15.574 15.289 15365<br />
Outputs<br />
Air emissions<br />
Fluoride Gaseous (as F) kg 0,56 0,53 0,54 0,55 0,55<br />
Fluoride Particulate (as F) kg 0,44 0,41 0,61 0,49 0,5<br />
Particulates kg 2,3 2,33 2,62 3,7 3,3<br />
NOx (as NO2) kg 0,65 0,41 0,16 0,32 0,35<br />
SO2 kg 8,2 8,3 8,85 14,9 13,6<br />
Total PAH kg 0,041 0,031 0,047 0,29 0,13<br />
BaP (Benzo-a-Pyrene) g 1,3 1,47 2,75 2,6 5<br />
CF4 kg 0,087 0,164 0,252 0,13 0,22<br />
C2F6 kg 0,01 0,014 0,028 0,013 0,021<br />
Water emissions<br />
Fresh Water m 3 9,1 4,8 4,9 3,1<br />
Sea Water m 3 57 69,3 17,6 20,9<br />
Fluoride (as F) kg 0,62 0,56 0,32 0,2<br />
Oil/Grease kg 0,001 0,005 0,008 0,008<br />
PAH (6 Borneff components) g 3,32 1,81 1,64 3,77<br />
Suspended Solids kg 0,81 0,57 0,2 0,21<br />
By-products <strong>for</strong> external recycling<br />
Anode butts kg 107 106 109<br />
Refractory material kg 0,9 2,3 0,5<br />
SPL carbon fuel/reuse kg 4,7 7,7 9,6 4,8 9,9<br />
SPL refr.bricks-reuse kg 4,8 7,9 4 5,5<br />
Steel kg 5,8 11,5 7 8,9 6,9<br />
O<strong>the</strong>r by-products kg 5 5,45 4,5 5,1<br />
Solid waste (landfilled)<br />
Carbon waste kg 6,8 3,3 3,1 6,9 4,6<br />
Refractory waste - landfill kg 0,3 0,07 0,5 1,2<br />
Scrubber sludges & filter dust kg 1,3 1,9 2 4,7 13,7<br />
SPL - landfill kg 13,4 19,9 22,9 13,2 17,3<br />
Waste alumina kg 1,4 2,3 2,6 4,7<br />
O<strong>the</strong>r landfill waste kg 5,3 6,3 5,1 7,3<br />
Page 27 of 72
Comments on output trends<br />
<strong>European</strong> fluoride air emissions are stable and similar to <strong>the</strong> global figures. Regarding<br />
o<strong>the</strong>r air emissions, Europe appears more efficient than rest of <strong>the</strong> world regarding<br />
SO 2 , PAH (Polycyclic Aromatic Hydrocarbons) and BaP (Benzo[a]Pyrene) but less<br />
efficient regarding NOx. PFC emissions in 2005 (0,087 kg CF 4 /t & 0,010 kg C 2 F 6 /t)<br />
are significantly reduced compared to 1998, i.e. about 65% reduction. <strong>European</strong> PFC<br />
figures are about 30% lower than global average. Reduction in PFC emissions results<br />
from a better control of <strong>the</strong> alumina feeding process which significantly reduces <strong>the</strong><br />
frequency of <strong>the</strong> anode effects as well as from <strong>the</strong> lower contribution of <strong>the</strong> Söderberg<br />
technology to <strong>the</strong> <strong>European</strong> mix.<br />
As stressed <strong>for</strong> <strong>the</strong> water input, <strong>European</strong> average emission data <strong>for</strong> water output is<br />
not very significant.<br />
In 2005, about 20 kg of solid by-products are recycled and about 27 kg of solid waste<br />
are landfilled in Europe per tonne of liquid aluminium. Global figures are similar to<br />
<strong>European</strong> ones.<br />
3.2.5 Cast house<br />
Direct input and output data related to <strong>the</strong> production of 1 tonne of sawn ingot at <strong>the</strong><br />
cast house are reported in table 3.6. Average <strong>European</strong> figures of <strong>the</strong> year 2005 can be<br />
compared with figures of <strong>the</strong> years 2002 and 1998 as well with worldwide figures<br />
(survey organised by IAI) <strong>for</strong> <strong>the</strong> years 2000 and 2005.<br />
Comments on input trends<br />
<strong>Aluminium</strong> input of <strong>the</strong> cast house is not only composed of liquid aluminium coming<br />
from <strong>the</strong> electrolysis but consists also in solid metals like alloying elements,<br />
aluminium scrap and ingot <strong>for</strong> remelting, mainly <strong>for</strong> preparing <strong>the</strong> right alloy<br />
composition and <strong>for</strong> remelting <strong>the</strong> ends of <strong>the</strong> extrusion ingot and rolling ingots which<br />
are usually sawn at <strong>the</strong> cast house location. In 2005, solid metal input represents about<br />
25% of <strong>the</strong> metal input.<br />
As already stated <strong>for</strong> <strong>the</strong> electrolysis step, water input is highly dependent on <strong>the</strong><br />
smelter location so that a <strong>European</strong> average has little significance.<br />
The use of fuels at <strong>European</strong> level is quite similar to <strong>the</strong> global consumption. Europe<br />
uses more electricity but <strong>the</strong> consumption stays small compared to <strong>the</strong> use at <strong>the</strong><br />
electrolysis step. Comparison with <strong>the</strong> year 1998 is not directly possible since figures<br />
related to 1998 have been extrapolated in order to reflect an input of 100% liquid<br />
aluminium.<br />
Page 28 of 72
Table 3.6 Direct inputs and outputs <strong>for</strong> <strong>the</strong> production of 1 tonne of sawn aluminium<br />
ingot at <strong>the</strong> cast house.<br />
Unit<br />
Ingot Casting<br />
Area Europe (EAA) World (IAI)<br />
Year 2005 2002 1998 2005 2000<br />
Inputs<br />
Raw materials<br />
Liquid aluminium from electrolysis kg 784 843 832<br />
<strong>Aluminium</strong> ingot kg 99 133 169<br />
<strong>Aluminium</strong> scrap kg 108 35<br />
Total <strong>Aluminium</strong> kg 991 1011 1001<br />
Alloy additives kg 31 17 11 20 20<br />
Chlorine kg 0,030 0,06 0,1 0,036 0,07<br />
O<strong>the</strong>r raw material inputs<br />
Fresh Water m3 3,1 7,5 4,7 4,5 3,15<br />
Sea Water m3 0,8 1 0,23<br />
Refractory materials kg 0,7<br />
Fuels and electricity<br />
Coal kg 1,2<br />
Diesel Oil kg 0,8 0,1* 1,4 0,1<br />
Heavy Oil kg 7,7 10,9* 5,7 10<br />
Natural Gas kg 20,3 13,9* 24 41,6<br />
Total Thermal energy MJ 1276 1081,6 1424 2312<br />
Electricity kWh 126 16* 83 81<br />
Outputs<br />
Air emissions<br />
Particulates kg 0,042 0,06 0,0003 0,02 0,1<br />
NOx (as NO2) kg 0,17 0,18 0,064 0,11 0,16<br />
SO 2 kg 0,32 0,62 0,031 0,04 0,29<br />
HCl (Hydrogen Chloride) kg 0,042 0,02 0,01 0,07<br />
Water emissions<br />
Fresh Water m 3 5,9 8,7 5,6 4,8<br />
Oil/Grease kg 0,007 0,01 0,01 0,01<br />
Suspended Solids kg 0,02 0,02 0,03 0,03<br />
By-products <strong>for</strong> external recycling<br />
Dross kg 15,7 20,5 18,6 13,3 16,0<br />
Filter dust kg 0,65 0,14 0,63 0,72<br />
Refractory material kg 0,44 0,47 0,24 0,61<br />
Scrap sold kg 2,2 1,63 2,8<br />
Solid waste (landfill)<br />
Dross - landfill kg 2,1 1,36 2,5 9,7<br />
Filter dust - landfill kg 0,2 0,19 0,15 0,5<br />
Refractory waste - landfill kg 0,4 0,8 0,9 1,2 0,8<br />
O<strong>the</strong>r landfill wastes kg 1,3 1,02 0,2 1,6<br />
(*) Figures extrapolated <strong>for</strong> 100% liquid aluminium as an input<br />
Page 29 of 72
Comments on outputs<br />
<strong>European</strong> averages of air emissions at cast house are not very significant since, in<br />
many cases, such figures are included in <strong>the</strong> electrolysis step and no specific figures<br />
are given <strong>for</strong> <strong>the</strong> cast house.<br />
Most significant by-product is <strong>the</strong> dross (mix of aluminium oxide and entrapped<br />
aluminium metal) which represents 17.8 kg/t in Europe from which 15.7 kg is<br />
recycled. After mechanical hot pressing <strong>for</strong> extracting most of <strong>the</strong> liquid metal, <strong>the</strong><br />
dross is recycled internally or externally in rotary furnaces (see section 7.5).<br />
3.3 Material flow modelling<br />
Average <strong>European</strong> data of <strong>the</strong> year 2005, reported in tables 3.3 to 3.6, are used to<br />
model <strong>the</strong> primary production route by combining such processes along <strong>the</strong><br />
production chain, i.e. from bauxite mining up to sawn primary ingot. Such process<br />
combination requires some simplifications and some hypo<strong>the</strong>ses regarding <strong>the</strong><br />
material flow modelling, which are reported below:<br />
- Cast house modelling:<br />
- <strong>Aluminium</strong> input: <strong>Aluminium</strong> input of <strong>the</strong> cast house is usually composed not only<br />
liquid aluminium from <strong>the</strong> smelter but also solid materials like alloying elements,<br />
aluminium scrap and/or ingot <strong>for</strong> remelting. Solid material represents about 25% of<br />
<strong>the</strong> input. The modelling will consider such addition of solid aluminium but as pure<br />
aluminium which is internally recycled within <strong>the</strong> cast house. As a result, alloying<br />
elements (31 kg/tonne of ingot) are <strong>the</strong>n substituted by a pure solid aluminium input.<br />
- Dross recycling: <strong>the</strong> model includes <strong>the</strong> dross recycling within <strong>the</strong> system while it is<br />
not <strong>the</strong> case <strong>for</strong> <strong>the</strong> table 3.6. It is assumed that aluminium recovered from dross<br />
recycling is returned as input to <strong>the</strong> cast house.<br />
- Metal losses at <strong>the</strong> cast house: <strong>the</strong> model considers <strong>the</strong> metal losses due to <strong>the</strong><br />
dross which are landfilled, <strong>the</strong> oxidation of <strong>the</strong> aluminium melt and <strong>the</strong> aluminium<br />
metal which is not recovered from <strong>the</strong> dross. The model calculates <strong>the</strong> metal losses to<br />
6 kg/tonne (i.e. 0.6% of metal losses).<br />
Based on above assumption, 1006 kg of liquid aluminium from <strong>the</strong> electrolysis are<br />
<strong>the</strong>n needed to produce 1 tonne of sawn extrusion or rolling ingot.<br />
- Anode and paste production modelling<br />
While carbon paste is entirely consumed during <strong>the</strong> electrolysis process using <strong>the</strong><br />
Söderberg technology, carbon anode used in smelters using pre-bake technology is<br />
not entirely consumed. When about 80% of <strong>the</strong> anode is consumed, <strong>the</strong> so-called<br />
anode butt is <strong>the</strong>n removed from <strong>the</strong> cell (and replaced by a new one). This anode butt<br />
is <strong>the</strong>n returned to <strong>the</strong> anode production facility where it is crushed and recycled into<br />
<strong>the</strong> anode production process. In <strong>the</strong> modelling process, slight adaptations of <strong>the</strong> raw<br />
material input were needed in order to make it consistent with <strong>the</strong> recycled input from<br />
anode butt which are coming back from <strong>the</strong> electrolysis process.<br />
- Materials flow modelling<br />
Considering above modelling assumptions, <strong>the</strong> average consumptions of main raw<br />
materials <strong>for</strong> producing 1 tonne of ingot have been calculated and are reported in<br />
Fig.3.4 and table 3.7.<br />
Page 30 of 72
Within this new model, 1006 kg of liquid aluminium from <strong>the</strong> electrolysis are needed<br />
to produce 1 tonne of sawn ingot. The amount of 6 kg represents <strong>the</strong> metal losses<br />
mainly due to oxidation during casting, sawing and scrap remelting. In <strong>the</strong> previous<br />
model, 1001 kg of liquid aluminium were needed to produce 1 tonne of ingot. As<br />
reminder, <strong>the</strong> previous model did not substitute alloying elements by pure aluminium<br />
and did not include dross recycling within <strong>the</strong> system boundaries so that metal losses<br />
could not be directly evaluated.<br />
Table 3.7 Main raw materials <strong>for</strong> <strong>the</strong> production of 1 tonne of primary ingot.<br />
Main raw materials Process step<br />
Year<br />
2005 2002 1998<br />
Bauxite (input alumina) Alumina 4259 4131 4111<br />
Caustic Soda (50%) Alumina 260 226 231<br />
Lime Alumina 83 90 88<br />
Alumina Electrolysis 1936 1924 1923<br />
Anode/paste (net) Electrolysis 428 447 448<br />
Liquid aluminium Casting 1006 1000 1001<br />
The substitution of alloying elements in <strong>the</strong> new model apparently increases <strong>the</strong><br />
alumina consumption since 1936 kg are needed per tonne of sawn ingot while 1923<br />
kg were consumed in 1998. 4259 kg of bauxite are used according to <strong>the</strong> new model<br />
vs. 4111 kg according to <strong>the</strong> 1998 model.<br />
Bauxite mining<br />
50% NaOH<br />
production<br />
260 kg<br />
4259 kg<br />
bauxite<br />
Transport<br />
Limestone<br />
mining<br />
Lime<br />
calcination<br />
83 kg<br />
Alumina<br />
production<br />
Petrol<br />
coke<br />
Pitch<br />
production<br />
395kg<br />
93 kg<br />
Anode and paste<br />
production<br />
AIF3<br />
production<br />
536 kg<br />
108 kg of anode butt<br />
18.9kg<br />
Transport<br />
1936 kg<br />
alumina<br />
Electrolysis<br />
(10% Söderberg/<br />
90% prebaked)<br />
1006 kg<br />
liquid metal<br />
Cast house<br />
1000 kg<br />
slab, billet, etc.<br />
Fig. 3.4 Main raw material inputs <strong>for</strong> primary aluminium production in Europe.<br />
Page 31 of 72
3.4 EAA electricity model <strong>for</strong> aluminium electrolysis (smelters)<br />
Since most of <strong>the</strong> energy used <strong>for</strong> producing primary aluminium is electricity at <strong>the</strong><br />
electrolysis step, it is crucial to model precisely this electricity production. As about<br />
one third of <strong>the</strong> primary aluminium used in Europe is imported, it is also necessary to<br />
take into account specific data relative to <strong>the</strong> electricity which is used <strong>for</strong> <strong>the</strong><br />
production of primary aluminium which is imported to Europe. The two next subsections<br />
explain how <strong>European</strong> production and imported primary aluminium are<br />
considered to build <strong>the</strong> EAA electricity model.<br />
3.4.1 Electricity used by <strong>European</strong> primary aluminium smelters<br />
The electricity model uses <strong>the</strong> electricity consumption reported by <strong>the</strong> various<br />
<strong>European</strong> smelters participating in <strong>the</strong> survey. This consumption is distributed among<br />
various energy sources as stipulated in <strong>the</strong>ir electricity contract. The model is<br />
developed in several steps which are described below:<br />
1) Consolidation at National level <strong>for</strong> each energy source.<br />
The electricity consumption reported by <strong>the</strong> smelters is firstly aggregated by energy<br />
sources at national level. This consolidation gives, <strong>for</strong> <strong>the</strong> year 2005, a table listing,<br />
<strong>for</strong> each <strong>European</strong> country producing primary aluminium (included in <strong>the</strong> reporting<br />
survey), <strong>the</strong> electricity consumption in TWh or GWh <strong>for</strong> each energy sources. For<br />
confidentiality issue, this matrix cannot be reproduced.<br />
2) Consolidation at <strong>European</strong> level <strong>for</strong> calculating <strong>the</strong> total electricity<br />
consumption<br />
National consumptions are <strong>the</strong>n consolidated at <strong>European</strong> level in order to calculate<br />
<strong>the</strong> total electricity consumption in Europe <strong>for</strong> <strong>the</strong> primary aluminium production of<br />
<strong>the</strong> reporting smelters.<br />
3) Calculating contribution of each country per energy source<br />
The contribution of each energy source within each country is <strong>the</strong>n calculated by<br />
dividing <strong>the</strong> “country vs. energy sources” matrix by <strong>the</strong> total <strong>European</strong> electricity<br />
consumption. This normalisation allows distributing <strong>the</strong> production of 1 kWh at<br />
<strong>European</strong> level among <strong>the</strong> various <strong>European</strong> countries and energy sources.<br />
4) Modelling <strong>the</strong> electricity production in each <strong>European</strong> country according to<br />
<strong>the</strong> specific distribution of <strong>the</strong> energy sources<br />
For each country, <strong>the</strong> production of electricity is modelled according to <strong>the</strong> specific<br />
distribution of <strong>the</strong> energy sources. This model uses <strong>the</strong> various LCI datasets <strong>for</strong><br />
electricity production, available in <strong>the</strong> GaBi software, which are country-specific and<br />
specific to <strong>the</strong> energy source. Each of <strong>the</strong>se LCI datasets related to electricity<br />
production has been weighted according to <strong>the</strong>ir respective contribution in <strong>the</strong><br />
<strong>European</strong> model.<br />
5) Building <strong>the</strong> <strong>European</strong> model<br />
The various national LCI blocks are <strong>the</strong>n combined at <strong>European</strong> level in order to<br />
model <strong>the</strong> LCI datasets associated with <strong>the</strong> production of 1kWh of electricity used in<br />
Europe <strong>for</strong> <strong>the</strong> production of primary aluminium.<br />
Page 32 of 72
Table 3.10, under section 3.4.3, reports <strong>the</strong> <strong>European</strong> consolidation of <strong>the</strong> energy<br />
sources <strong>for</strong> <strong>the</strong> electricity production which is used by <strong>the</strong> <strong>European</strong> smelters. Such<br />
figures are reported <strong>for</strong> <strong>the</strong> years 2005, 2002 and 1998.<br />
3.4.2 Electricity used <strong>for</strong> <strong>the</strong> production of imported aluminium<br />
In 2005, 36% of <strong>the</strong> primary aluminium used in Europe (i.e. EU27 & EFTA countries)<br />
came from imports. This figure has been calculated from average customs statistics<br />
(source Eurostat) on 4 years from 2003 until 2006 in order to remove any influence of<br />
year-specific data inconsistent with <strong>the</strong> overall trend.<br />
As reported in table 3.8, most of <strong>the</strong>se imports come from Russia (40%), Mozambique (18%)<br />
and Brazil (12%).<br />
Table 3.8 Geographical distribution of <strong>the</strong> primary aluminium imports into Europe –<br />
average on years 2003 – 2006 (source Eurostat)<br />
Area Import share Origins<br />
Rest of Europe: 48%<br />
80% Russia, 8% Montenegro, 5% Bosnia<br />
Herzegovina, 3% Ukraine<br />
Africa 23%<br />
71% Mozambique, 9% Cameroon, 7%<br />
South Africa, 7 % Egypt<br />
Latin America 14% 90% Brazil<br />
Asia 10%<br />
47% United Arab Emirates, 40%<br />
Tajikistan<br />
North America 4% 91% Canada<br />
Oceania 1%<br />
Total 100%<br />
Table 3.8 is used to model <strong>the</strong> electricity production <strong>for</strong> <strong>the</strong> primary aluminium imported into<br />
Europe. The various steps and hypo<strong>the</strong>ses of this modelling methodology are <strong>the</strong> following:<br />
- Only countries listed in table 3.8 have been considered <strong>for</strong> <strong>the</strong> model. These<br />
countries represent more than 90% of <strong>the</strong> aluminium imported into Europe.<br />
- Use of <strong>the</strong> national electricity grid mix <strong>for</strong> <strong>the</strong> countries listed in table 3.8,<br />
except <strong>for</strong> Russia and Ukraine <strong>for</strong> which specific data provided by <strong>the</strong><br />
aluminium producer have been used. Data from <strong>the</strong> International Energy<br />
Agency (reference year 2005) have been used to determine <strong>the</strong> national grids<br />
<strong>for</strong> electricity production [18].<br />
- Weighting and consolidation of <strong>the</strong> country grid mixes have been done at<br />
regional level. Consolidated figures are reported in table 3.9.<br />
- For each of <strong>the</strong>se regions, modelling of <strong>the</strong> electricity production based on<br />
<strong>the</strong> calculated electricity grid mix, using power plant data which are<br />
representative <strong>for</strong> <strong>the</strong> region, e.g. electricity from natural gas in Latin<br />
America uses Brazilian data or electricity from coal in Africa uses South<br />
African data.<br />
- Consolidation of <strong>the</strong> electricity production data at global level. The<br />
consolidation of <strong>the</strong> energy sources <strong>for</strong> <strong>the</strong> electricity production which is<br />
used by imported aluminium is reported in table 3.9.<br />
Page 33 of 72
Table 3.9 Energy sources <strong>for</strong> <strong>the</strong> electricity used <strong>for</strong> <strong>the</strong> production of imported<br />
primary aluminium<br />
Area<br />
Electricity production<br />
Import<br />
Natural<br />
share Hydropower Coal Oil<br />
Biomass Nuclear<br />
gas<br />
Rest of Europe 48% 88,4% 2,9% 0,1% 4,3% 0,0% 4,3%<br />
Africa 23% 85,6% 6,9% 1,6% 5,8% 0,0% 0,4%<br />
North America 4% 58,0% 17,0% 3,0% 6,0% 1,0% 15,0%<br />
Latin America 13% 84,0% 2,0% 3,0% 5,0% 4,0% 2,0%<br />
Asia 10% 45,1% 0,0% 1,1% 53,9% 0,0% 0,0%<br />
Oceania 1%<br />
Not considered<br />
Consolidation<br />
81,5% 4,0% 1,0% 9,8% 0,6% 3,1%<br />
Based on <strong>the</strong> energy survey of <strong>the</strong> year 2005 organised by <strong>the</strong> International aluminium<br />
Institute and based on <strong>the</strong> structure of <strong>the</strong> primary imports, <strong>the</strong> calculation of <strong>the</strong> specific<br />
electricity consumption at <strong>the</strong> smelter gives 15227 kWh/tonne <strong>for</strong> <strong>the</strong> imported aluminium,<br />
excluding <strong>the</strong> assumed 2% of transmission losses.<br />
3.4.3 EAA electricity model<br />
Fig. 3.5 schematises <strong>the</strong> EAA electricity model combining <strong>the</strong> 64% of <strong>European</strong> production<br />
and <strong>the</strong> 36% of primary aluminium imports.<br />
Electricity Model <strong>for</strong> <strong>the</strong><br />
<strong>European</strong> production 64%<br />
Electricity model <strong>for</strong> primary<br />
<strong>Aluminium</strong> production<br />
imported to Europe<br />
36%<br />
EAA electricity<br />
model <strong>for</strong> <strong>the</strong><br />
<strong>European</strong> primary<br />
aluminium<br />
Fig. 3.5 EAA model of electricity production <strong>for</strong> <strong>the</strong> <strong>European</strong> primary aluminium<br />
considering <strong>the</strong> aluminium imports<br />
Table 3.10 reports <strong>the</strong> share of <strong>the</strong> various energy sources <strong>for</strong> <strong>the</strong> electricity production of <strong>the</strong><br />
EAA model, including <strong>the</strong> imports. Figures related to <strong>the</strong> previous model developed <strong>for</strong> <strong>the</strong><br />
years 1998 and 2002 are also reported.<br />
Table 3.10 Distribution of <strong>the</strong> energy sources <strong>for</strong> <strong>the</strong> EAA electricity model<br />
<strong>European</strong> model Imports EAA model<br />
Year 2005 2002 1998 2005 2002 1998 2005 2002 1998<br />
Production share 64% 68% 61% 36% 32% 39%<br />
Share of Energy sources<br />
Hydro 44,9% 45,7% 40,5% 81,5% 67,9% 71,0% 58,0% 52,8% 52,4%<br />
Hard Coal 14,8% 15,8% 17,5% 4,0% 26,4% 23,7% 10,9% 19,2% 19,9%<br />
Brown coal 5,8% 6,7% 7,7% 0,0% 3,7% 4,6% 4,7%<br />
Oil 2,7% 4,8% 5,1% 1,0% 0,0% 0,4% 2,1% 3,3% 3,3%<br />
Gas 9,8% 7,6% 5,5% 9,8% 4,2% 3,6% 9,8% 6,5% 4,8%<br />
Nuclear 21,8% 19,4% 23,7% 3,1% 1,4% 1,3% 15,0% 13,6% 15,0%<br />
O<strong>the</strong>r (biomass) 0,2% 0,6% 0,3% 0,0%<br />
Total 100,0% 100,0% 100,0% 100,0% 100,0% 100,0% 100,0% 100,0%<br />
Page 34 of 72
According to <strong>the</strong> consolidated model (EAA model), hydropower appears clearly <strong>the</strong> most<br />
significant source of energy to produce <strong>the</strong> electricity consumed by <strong>the</strong> primary aluminium<br />
which is used in Europe. This hydropower share increased from about 53% in 2002 and 1998<br />
to 58% in 2005.<br />
For <strong>the</strong> <strong>European</strong> model, <strong>the</strong> increase of <strong>the</strong> share of <strong>the</strong> hydropower since 1998 results<br />
mainly from expansion and new plants located in Nordic countries (Norway and Iceland).<br />
Regarding imports, <strong>the</strong> high share of hydropower can be explained as follows:<br />
- In Russia, most of <strong>the</strong> smelters are located directly in <strong>the</strong> neighbourhood of<br />
hydropower plants which supply directly <strong>the</strong>ir electricity<br />
- The o<strong>the</strong>r countries exporting primary aluminium to Europe use mostly<br />
hydropower to produce <strong>the</strong>ir electricity, e.g. Mozambique, Cameroon,<br />
Canada or Tajikistan.<br />
The second point also explains <strong>the</strong> big difference with <strong>the</strong> previous modelling approach which<br />
only differentiated 2 exporting regions: Imports from Russia and imports from Western<br />
world. In this previous model, <strong>the</strong> share of hydropower <strong>for</strong> <strong>the</strong> imports from Western world<br />
reached 61% while it reaches about 75% with <strong>the</strong> new model considering <strong>the</strong> precise origins<br />
of <strong>the</strong> imported aluminium.<br />
While coal represented about 25% of <strong>the</strong> energy source in <strong>the</strong> 1998 EAA model, it represents<br />
15% only in <strong>the</strong> 2005 model, 10,9% from hard coal and 3,7% from brown coal. In <strong>the</strong><br />
meantime, natural gas is becoming a significant energy source since its share has doubled<br />
from 4,8% in 1998 to 9,8% in 2005. The nuclear energy is stable around 15%.<br />
Primary energy resources, main air emissions figures and GHG emission associated with <strong>the</strong><br />
electricity production <strong>for</strong> 1 tonne of primary aluminium is reported in table 3.11.<br />
Table 3.11 Energy resources, air and GHG emissions <strong>for</strong> <strong>the</strong> electricity consumed by<br />
<strong>the</strong> electrolysis step <strong>for</strong> 1 tonne of primary aluminium according to <strong>the</strong> EAA model<br />
Unit<br />
<strong>European</strong> smelters<br />
EAA model<br />
Year 2005 2002 1998 2005 2002 1998<br />
Smelter consumption kWh 14914 15389 15574 15027 15389 15574<br />
Total consumption (including 2%<br />
transmissin losses)<br />
Primary energy resources<br />
Air emissions<br />
kWh 15212 15697 15885 15328 15697 15885<br />
brown coal kg 983 1523 1993 634 1034 1207<br />
hard coal kg 883 925 1049 703 1112 1187<br />
natural gas kg 367 312 194 383 267 166,4<br />
crude oil kg 126 225 248 93 161 164<br />
nuclear electricity kWh 3316 2979 3627 2299 2071 2241<br />
hydroelectricity kWh 6830 7002 6225 8890 8114 8072<br />
CO2 kg 4562 5259 5617 4230 5405 5499<br />
CO kg 1,47 0,92 0.89 1,4 0,9 0.84<br />
SO2 kg 15,5 23,7 36.4 13,4 23,1 30.0<br />
NOx (as NO2) kg 7,8 11,2 12.0 7,5 12,3 12.5<br />
CH4 kg 9,8 13,3 13.6 8,6 16,7 17.0<br />
Dust kg 1 6,6 6.9 0,9 7,5 7.6<br />
GHG kg CO2 equiv 4836 4462 5783 5884<br />
For <strong>the</strong> electricity production, significant reductions are observed in term of air emissions and<br />
primary energy consumption, compared to <strong>the</strong> year 1998 and 2002. Only natural gas increases<br />
while all o<strong>the</strong>r primary energy resources are reduced. This is particularly <strong>the</strong> case <strong>for</strong> <strong>the</strong><br />
combined EAA model due to <strong>the</strong> high hydropower share of <strong>the</strong> electricity consumed by <strong>the</strong><br />
aluminium production which is imported to Europe. The CO 2 emission <strong>for</strong> <strong>the</strong> production of<br />
Page 35 of 72
electricity which is used at <strong>the</strong> electrolysis step is <strong>the</strong>n significantly reduced since 4230 kg of<br />
CO 2 per tonne of electrolysed aluminium is calculated in 2005 against 5405 kg in 2002 or<br />
5499 kg in 1998. This reduction of about 23% is mainly due to <strong>the</strong> higher share of<br />
hydropower and <strong>the</strong> improved efficiency of power plants. SO 2 , NO x , CH 4 and dust are also<br />
significantly reduced.<br />
3.5 <strong>European</strong> LCI dataset and environmental indicators <strong>for</strong> primary aluminium<br />
The GaBi software was used to calculate <strong>the</strong> <strong>European</strong> LCI dataset <strong>for</strong> primary<br />
aluminium in accordance with <strong>the</strong> modelling hypo<strong>the</strong>ses reported in sections 3.3 and<br />
3.4. <strong>European</strong> averages of <strong>the</strong> year 2005, as reported in tables 3.3 to 3.6, have been<br />
used <strong>for</strong> <strong>the</strong> model. The only exception concerns air emissions of <strong>the</strong> electrolysis step<br />
<strong>for</strong> <strong>the</strong> imported aluminium. In such case, worldwide IAI data of <strong>the</strong> year 2005 have<br />
been used. The full LCI dataset is available on request at lci@eaa.be. Table 3.12<br />
reports <strong>the</strong> main LCI data while table 3.13 reports <strong>the</strong> associated in<strong>for</strong>mative<br />
environmental indicators.<br />
Comments on input trends<br />
In 2005, it is calculated that 4259 kg of bauxite is directly needed to produce 1 tonne<br />
of primary aluminium against 4111 kg and 4131 kg respectively in 1998 and 2002.<br />
This increase results from <strong>the</strong> progressive use of lower grade concentrate and from <strong>the</strong><br />
higher alumina consumption resulting from <strong>the</strong> new modelling approach substituting<br />
alloying elements by pure aluminium. Limestone and sodium chloride are <strong>the</strong> two<br />
o<strong>the</strong>r major raw materials which are consumed (alumina process).<br />
Except <strong>for</strong> natural gas, <strong>the</strong> consumption of fossil fuels is considerably reduced. This<br />
reduction results mainly from <strong>the</strong> refined electricity model which relies more on<br />
hydropower-based electricity and from <strong>the</strong> better efficiency of fuel-based power plant<br />
compared to BUWAL data [11] used in <strong>the</strong> previous modelling approach. The<br />
reduction of electricity consumption (4% vs. 1998) at <strong>the</strong> electrolysis step and <strong>the</strong><br />
reduction of anode consumption (4% vs. 1998) also contribute to this decrease in<br />
fossil-based primary energy.<br />
C omments on output trends<br />
Regarding air emissions, significant reductions are observed <strong>for</strong> dust, organic<br />
compounds, CO 2 , SO 2 , CH 4 and NO x , mainly due to <strong>the</strong> lower contribution of <strong>the</strong><br />
electricity production and <strong>the</strong> optimised process and combustion conditions. Fluoride<br />
emissions (HF & fluorides) are stable. PAH and BaP emissions are increased vs. 1998<br />
due to <strong>the</strong> contribution of emissions from imported aluminium. PFC emissions, i.e.<br />
C 2 F 6 (R116 - hexafluoroethane) and CF 4 (Tetrafluoromethane), are significantly<br />
reduced thanks to a better control of <strong>the</strong> anode effects.<br />
Red mud (1375 kg/tonne) is slightly increasing vs. 1998 but stable vs. 2002. Solid<br />
waste <strong>for</strong> landfilling, mainly composed of refractories, accounts <strong>for</strong> about 25<br />
kg/tonne. About 40 kg of solid output <strong>for</strong> recovery or recycling are produced from<br />
which 25 kg is bauxite residue (red mud) which is fur<strong>the</strong>r processed.<br />
Page 36 of 72
Table 3.12 Main LCI data <strong>for</strong> <strong>the</strong> production of 1 tonne of primary aluminium used in<br />
Europe – data of <strong>the</strong> year 2005, 2002 and 1998.<br />
Year 2005<br />
2002 1998<br />
Main inputs (kg)<br />
Total<br />
Direct<br />
Thermal<br />
Comments/difference<br />
Auxiliary Electricity<br />
Transport Total Total<br />
process<br />
energy<br />
Bauxite 4272 4259 13 0 0 0 4131 4111<br />
Energy sources<br />
Crude oil 762 285,7 14,2 99,4 343,2 19,5 1381 1369<br />
Hard coal 892 110,2 35,0 738,2 8,1 0,4 1360 1464<br />
Brown coal 756 6,6 69,4 675,8 3,8 0,3 1144 1328<br />
Natural gas 650 28,8 24,2 404,7 190,8 1,5 445 408<br />
Main outputs (kg)<br />
Emissions to air<br />
Carbon dioxide - CO2 8566 1804 353 4584 1758 68 10521 10634<br />
Carbon monoxide - CO 3,08 0,52 0,25 1,53 0,57 0,21 3,3 96<br />
Fluorides (particles) 0,55 0,55 0,00 0,00 0,00 0,00 0,44 0,49 Excluding HF<br />
Hydrogen chloride - HCl 0,24 0,04 0,00 0,18 0,01 0,00 1,26 1,4<br />
Hydrogen fluoride - HF 0,60 0,56 0,00 0,03 0,00 0,00 0,71 0,75<br />
Nitrogen oxides - Nox 14,0 1,2 0,4 8,2 2,7 1,4 24 27<br />
Sulphur dioxide -SO2 34,2 11,5 0,6 15,0 6,3 0,8 66,3 72<br />
Methane 14,32 2,06 0,56 9,21 2,43 0,06 21 20<br />
Group NMVOC to air (non-methane volatile organic compounds)<br />
Group PAH to air 0,151 0,150 0,000 0,000 0,000 0,000 0,066 0,1<br />
Benzo{a}pyrene 0,0024 0,0024 0,0000 0,0000 0,0000 0,0000 0,0018 0,0032<br />
R 116 (hexafluoroethane -C2F6) 0,010 0,010 0,000 0,000 0,000 0,000 0,014 0,028<br />
Tetrafluoromethane -CF4 0,109 0,109 0,000 0,000 0,000 0,000 0,16 0,252<br />
Ethane 0,314 0,051 0,009 0,137 0,114 0,003 Not listed in 1998<br />
Propane 0,406 0,089 0,009 0,147 0,156 0,005 Not listed in 1998<br />
Total NMVOC to air 2,008 0,646 0,057 0,713 0,526 0,067 9,9 9,9<br />
Particles to air<br />
Aluminum oxide (dust) 1,34 1,34 0,00 0,00 0,00 0,00 Not listed in 1998<br />
Dust (PM10) 0,15 0,01 0,00 0,08 0,06 0,00 Not listed in 1998<br />
Dust (PM2.5) 0,73 0,00 0,01 0,58 0,13 0,00 Not listed in 1998<br />
Dust (unspecified) 7,27 6,49 0,36 0,34 0,03 0,04 Not listed in 1998<br />
Total particles to air 9,49 7,84 0,38 1,00 0,22 0,04 16,5 27<br />
Solid waste (deposited)<br />
Red mud (dry) 1375 1374 0 0 0 0 1373 1286<br />
Main residues from alumina<br />
production<br />
Solid Waste (landfilled)<br />
Refractory (including SPL landfilled) 15,1 15,1 0,0 0,0 0,0 0,0 22,2 22,2 SPL included<br />
Sludge 4,0 2,2 1,9 0,0 0,0 0,0 2,0<br />
Dross (Fines) 5,8 5,8 0,0 0,0 0,0 0,0 0,8 0,11<br />
Solid output <strong>for</strong> incineration<br />
Carbon waste (including SPL carbon<br />
Incineration included in <strong>the</strong> 2005<br />
0,0 (12,6) 0,0 0,0 0,0 0,0 7,7 9,6<br />
fraction )<br />
model<br />
Solid output <strong>for</strong> recovery or recycling<br />
Dross 0,0 (15,7) 0,0 0,0 0,0 0,0 20,5 18,6<br />
Aluminum oxide (alumina) 1,4 1,4 0,0 0,0 0,0 0,0<br />
Bauxite residue 25,2 25,2 0,0 0,0 0,0 0,0 11,2<br />
Refractory (including SPL refractory<br />
fraction)<br />
7,8 7,8 0,0 0,0 0,0 0,0 13,5<br />
Smelter by-products 4,5 4,5 0,0 0,0 0,0 0,0 9,6<br />
Steel scrap (St) 0,0 (7,3) 0,0 0,0 0,0 0,0 11,9 7<br />
Dross recycling included in <strong>the</strong><br />
2005 model<br />
Steel recycling and production<br />
included in <strong>the</strong> 2005 model<br />
E nvironmental indicators<br />
Associated environmental indicators <strong>for</strong> <strong>the</strong> predefined impact categories are reported<br />
in table 3.13. This set of environmental indicators is purely in<strong>for</strong>mative and<br />
should not be used <strong>for</strong> evaluating <strong>the</strong> environmental footprint of <strong>the</strong> primary<br />
aluminium in Europe or <strong>for</strong> comparative purposes between various materials. As<br />
highlighted in ISO 14040 and 14044, only <strong>the</strong> environmental aspects of a product<br />
system or a service in a life cycle perspective, i.e. from cradle to grave or from<br />
cradle to recycling, is environmentally sound.<br />
Page 37 of 72
Table 3.13 Main environmental indicators <strong>for</strong> <strong>the</strong> production of 1 tonne of sawn<br />
primary aluminium ingot used in Europe.<br />
EAA indicators (per tonne of primary ingot)<br />
Total<br />
Direct<br />
process<br />
Auxiliary Electricity Thermal energy Transport<br />
Depletion of Abiotic Resources (ADP) [kg Sb-Equiv.] 45,36 8,03 1,61 23,64 11,65 0,43<br />
Acidification Potential (AP) [kg SO2-Equiv.] 43,94 12,03 0,87 20,98 8,20 1,86<br />
Eutrophication Potential (EP) [kg Phosphate-Equiv.] 1,94 0,19 0,06 1,13 0,38 0,19<br />
GHG emission (GWP 100 years) [kg CO2-Equiv.] 9677 2594 368 4826 1820 69<br />
Ozone Layer Depletion Potential (ODP, steady state) [kg R11-Equiv.] 9,79E-04 3,19E-06 2,73E-05 9,44E-04 4,39E-06 8,45E-08<br />
Photo-oxidant Creation Potential (POCP) [kg E<strong>the</strong>ne-Equiv.] 2,670 0,659 0,067 1,293 0,541 0,110<br />
Primary energy from renewable raw materials (net cal. value) [MJ] 42386 28 138 42162 56 1<br />
Primary energy from non-renewable resources (net cal. value) [MJ] 130699 16872 4358 84169 24395 905<br />
This table highlights that electricity production contributes significantly to <strong>the</strong> various<br />
environmental indicators. GHG emission reaches 9677 kg CO 2 -equiv./tonne of<br />
aluminium ingot, 50% coming from <strong>the</strong> electricity production (4826 kg/t) while <strong>the</strong><br />
aluminium processes (mainly anode/paste consumption and PFC emissions)<br />
contribute to slightly more than 25%, <strong>the</strong>rmal energy (mainly at <strong>the</strong> alumina step),<br />
auxiliary processes and transport account <strong>for</strong> slightly less 25% of this indicator.<br />
Primary energy consumption from non-renewable resources reaches 131 MJ/kg in<br />
total, 84 MJ resulting from <strong>the</strong> electricity production, 24 MJ from <strong>the</strong> <strong>the</strong>rmal energy,<br />
17 MJ from <strong>the</strong> aluminium processes (mainly anode/paste consumption) and 5 MJ<br />
from transport and auxiliary processes.<br />
4 . <strong>Aluminium</strong> sheet production<br />
4 .1 Process steps description<br />
With a thickness comprised between 0.2 and 6 mm, sheet is <strong>the</strong> most common<br />
aluminium rolled product. The starting stock <strong>for</strong> most rolled products is <strong>the</strong> DC<br />
(Direct Chill semi-continuous cast) ingot. The size of <strong>the</strong> ingot depends on <strong>the</strong> size of<br />
<strong>the</strong> DC unit available, <strong>the</strong> hot rolling mill capacity, volume required <strong>for</strong> a particular<br />
end use and to some extent <strong>the</strong> alloys being cast. Ingots up to over 32 tons in weight,<br />
500 - 600 mm thick, 2000 mm wide and 9000 mm long are produced. Be<strong>for</strong>e rolling<br />
operations, <strong>the</strong> rolling ingot is machined to cut <strong>the</strong> ends (sawing) and to even <strong>the</strong><br />
surfaces (scalping).<br />
According to alloy grade, a <strong>the</strong>rmal treatment of homogenisation may be applied (see<br />
Fig. 4.1). The DC ingot is <strong>the</strong>n pre-heated to around 500°C prior to successive passes<br />
through a hot rolling mill where it is reduced in thickness to about 4 - 6 mm. The strip<br />
from <strong>the</strong> hot rolling mill is coiled and stored be<strong>for</strong>e cold rolling which is usually done<br />
in <strong>the</strong> same site. Cold mills, in a wide range of types and sizes are available; some are<br />
single stand, o<strong>the</strong>rs 3 stands and some 5 stands. Final thickness of <strong>the</strong> cold rolled strip<br />
or sheet is usually comprised between 0.2 and 2 mm.<br />
Finishing operations include:<br />
- Sizing, e.g. trimming, slitting and blanking<br />
- Annealing according to alloy grades<br />
- Final surface preparation (excluding coating and/or painting)<br />
Page 38 of 72
eak-down<br />
tandem<br />
homogenization hot rolling cold rolling annealing<br />
Fig. 4.1 Main process steps in aluminium sheet production<br />
The sheet production from sawn ingot up to finished sheet generates about 380 kg of<br />
scrap by tonne of sheet. These scrap are recycled into new ingot through remelting<br />
which is usually per<strong>for</strong>med on-site in integrated cast houses. This internal recycling of<br />
process scrap is part of <strong>the</strong> LCI dataset <strong>for</strong> <strong>the</strong> sheet production as illustrated in<br />
Fig.4.2.<br />
4.2 Data collection, averaging and modelling<br />
The LCI dataset related to sheet production were developed through an EAA survey<br />
covering <strong>European</strong> aluminium rolling mills as well as <strong>the</strong>ir integrated cast house in<br />
which process scrap are remelted into rolling ingots (slabs). Data from 20 <strong>European</strong><br />
rolling mills have been collected and included in <strong>the</strong> <strong>European</strong> consolidation.<br />
The EAA survey coverage <strong>for</strong> <strong>the</strong> year 2005 reaches about 70% <strong>for</strong> <strong>the</strong> sheet<br />
production in Europe as well as <strong>for</strong> <strong>the</strong> process scrap recycling. Detailed figures are<br />
reported in Table 4.1.<br />
Integrated cast-houses<br />
(slabs production)<br />
Table 4.1 EAA survey coverage <strong>for</strong> <strong>European</strong> rolling mills<br />
Total production in Total production Survey coverage<br />
Europe (Mt) reported (Mt) (%)<br />
3.77 2.55 68<br />
Rolling mills 4.39 3.33 (1) 76<br />
(1) Total strip, sheet and plate output excluding hot rolled plate and hot rolled strip<br />
Regarding alloys, <strong>the</strong> LCI dataset corresponds to 28% hard alloys (e.g. 2xxx, 7xxx,<br />
5xxx with Mg > 1,5%), 46% intermediate alloys (e.g. 3xxx, 5xxx with Mg
Fig. 4.2 Flow diagram <strong>for</strong> aluminium sheet production<br />
(RER: EU27 + EFTA countries).<br />
Direct input and output data related to <strong>the</strong> sheet production chain and <strong>the</strong> remelting of<br />
process scrap are reported in Table 4.2. These inputs and outputs are normalised to<br />
1000 kg of finished aluminium sheet.<br />
Page 40 of 72
Table 4.2 Direct inputs and outputs <strong>for</strong> <strong>the</strong> sheet production and <strong>the</strong> corresponding<br />
scrap remelting – Figures normalised to 1000 kg of finished sheet.<br />
<strong>Aluminium</strong> rolling processes - Figures <strong>for</strong> 1 tonne of sheet<br />
output<br />
Sheet<br />
production<br />
Scrap<br />
Remelting<br />
Year<br />
2005<br />
2002 1998<br />
<strong>Aluminium</strong> inputs<br />
Unit<br />
Unscalped rolling ingots kg 1004 1004 1012 1012<br />
Clean scrap kg 383<br />
<strong>Aluminium</strong> outputs<br />
Finished cold rolled sheet kg 1000 1000 1000 1000<br />
Energy inputs<br />
Heavy Oil<br />
kg 0,0 1,0 1,0<br />
Diesel and light fuel Oil<br />
kg 4,6 0,1 4,8 3,2 0,75<br />
Natural Gas<br />
kg 41 28 68,8 89 94,4<br />
Propane<br />
kg 0,0 1,0 1,0<br />
Total <strong>the</strong>rmal energy MJ 2.083 1359 3.441 4201 4349<br />
Electricity kWh 662 64,4 726 600 667<br />
Ancillary products, inputs<br />
Fluxing salts kg 1,72 1,72 1,8 0,38<br />
Argon kg 0,86 0,86 1 0,91<br />
Chlorine kg 0,05 0,05 0,025 0,008<br />
Filter tones kg 0,59 0,13 0,73<br />
Emulsion, hot rolling (oil content) kg 1,46 0,00 1,46<br />
Oil, cold rolling kg 3,83 0,00 3,83 2,4 3,8<br />
Lubricants and hydraulic oils kg 0,95 0,02 0,97<br />
Paper & cardboard <strong>for</strong> packaging kg 1,85 0,00 1,85 0,02 0,1<br />
Wood <strong>for</strong> packaging kg 8,17 0,00 8,17 5,9 10<br />
Steel <strong>for</strong> packaging kg 0,48 0,00 0,48 0,5 0,5<br />
Plastic <strong>for</strong> packaging kg 0,52 0,00 0,52 0,25 0,4<br />
Water inputs<br />
Water m 3 5,9 4,2 10,2 10,1 42<br />
Emissions to air<br />
Carbon monoxide (CO) kg 0,46 0,04 0,50<br />
Dust/particulates, total kg 0,02 0,02 0,03<br />
Dust/particulates PM10 (
Table 4.3 Main LCI data <strong>for</strong> <strong>the</strong> production of 1 tonne of aluminium sheet from <strong>the</strong><br />
rolling ingot<br />
Year 2005<br />
2002 1998<br />
Inputs (kg/t)<br />
Total<br />
Direct<br />
process,<br />
<strong>the</strong>rmal &<br />
ancillary<br />
Electricity Total * Total *<br />
<strong>Aluminium</strong> rolling ingot 1004,3 1012 1012<br />
Energy resources<br />
Crude oil 26,5 14,5 12,1 21,4 21<br />
Hard coal 61,0 1,1 59,9 64,2 71,9<br />
Brown coal 97,6 1,3 96,4 67,7 75,7<br />
Natural gas 102,0 72,8 29,2 92,3 99,3<br />
Outputs (kg/t)<br />
Cold rolled strip/sheet 1000 1000 1000<br />
Main air emissions<br />
CO2 589 217 385 464 499<br />
NOx 1,03 0,31 0,71 0,76 0,81<br />
SO2 2,11 0,14 1,97 1,52<br />
Dust 0,12 0,04 0,08 0,3 0,33<br />
VOC (unspec.) 0,38 0,38 0,00 0,45 0,44<br />
Methane 1,29 0,54 0,75 1,2 1,3<br />
* dross recycling and ingot homogeneisation not included in 1998 & 2002 modeling<br />
Table 4.4 <strong>Environmental</strong> indicators <strong>for</strong> <strong>the</strong> sheet production<br />
EAA indicators (per tonne of aluminium sheet)<br />
Total<br />
Direct, auxillary &<br />
<strong>the</strong>rmal<br />
Electricity<br />
Abiotic Depletion (ADP) [kg Sb-Equiv.] 4,04 1,97 2,07<br />
Acidification Potential (AP) [kg SO2-Equiv.] 2,96 0,44 2,53<br />
Eutrophication Potential (EP) [kg Phosphate-Equiv.] 0,164 0,065 0,098<br />
Greenhouse gas emission (GWP 100 years) [kg CO2-Equiv.] 644 237 407<br />
Ozone Layer Depletion Potential (ODP, steady state) [kg R11-Equiv.] 9,76E-05 7,27E-07 9,69E-05<br />
Photo-Oxidant Creation Potential (POCP) [kg E<strong>the</strong>ne-Equiv.] 0,282 0,138 0,144<br />
Primary energy from renewable raw materials (net cal. value) [MJ] 731 121 610<br />
Primary energy from non-renewable resources (net cal. value) [MJ] 12019 4117 7902<br />
5.<br />
<strong>Aluminium</strong> foil production<br />
5.1 Process steps description<br />
<strong>Aluminium</strong> foil is used in varying gauges and in a number of alloys <strong>for</strong> a variety of<br />
applications. It is available in thickness from 5 microns to 200 microns (i.e. 0.005 to<br />
0.2 mm) and can be supplied in a range of finishes.<br />
Similarly to <strong>the</strong> sheet production, <strong>the</strong> classical production route uses an aluminium<br />
rolling ingot (slab) as starting material <strong>for</strong> <strong>the</strong> production of rolled aluminium foil,<br />
which is first rolled into foil stock, i.e. <strong>the</strong> specific input <strong>for</strong> foil fabrication.<br />
Foil fabrication is carried out by cold rolling from foil stock with a thickness of 0,5-<br />
1,0 mm as input. For thinner foil thickness, <strong>the</strong> final rolling steps are carried out by<br />
“double-rolling”, i.e. rolling toge<strong>the</strong>r two foil layers at <strong>the</strong> same time. During cold<br />
rolling a mineral oil fraction is used <strong>for</strong> cooling and lubrication.<br />
Page 42 of 72
In addition to <strong>the</strong> classical production route, aluminium foil can also be produced<br />
directly through <strong>the</strong> strip casting process consisting in casting <strong>the</strong> molten aluminium<br />
directly into a strip which is cold rolled into a foil. In <strong>the</strong> LCI dataset, a ratio of 80%<br />
classical route/20% strip casting was used.<br />
The foil production from as-cast ingot up to finished sheet generates about 600 kg of<br />
scrap by tonne of foil. These scrap are recycled into new ingot through remelting<br />
which is usually per<strong>for</strong>med on-site in integrated cast houses. This internal recycling of<br />
process scrap is part of <strong>the</strong> LCI dataset <strong>for</strong> <strong>the</strong> foil production as illustrated in Fig. 5.1<br />
in <strong>the</strong> next section.<br />
5.2 Data consolidat ion, averaging and modeling<br />
EAFA (<strong>European</strong> <strong>Aluminium</strong> Foil Association, w ww.alufoil.org) and EAA worked<br />
toge<strong>the</strong>r <strong>for</strong> developing <strong>the</strong> foil dataset. As reported in table 5.1, <strong>the</strong> EAA-EAFA<br />
survey coverage <strong>for</strong> <strong>the</strong> year 2005 reaches about 50% <strong>for</strong> <strong>the</strong> foil production in<br />
Europe (EU27 + EFTA countries).<br />
Table 5.1 Survey coverage <strong>for</strong> <strong>European</strong> foil production<br />
Total production in Total production Survey coverage<br />
Europe (kt) reported (kt) (%)<br />
Foil production 800 406 51<br />
The flow diagram <strong>for</strong> foil production is reported in Fi g. 5.1 . As described in section<br />
5.1, <strong>the</strong> LCI process modelling is based on 20% of <strong>the</strong> production done through strip<br />
casting technology and 80% through classical production route.<br />
Fig. 5.1 Flow diagram <strong>for</strong> aluminium foil production.<br />
(RER: EU27 + EFTA countries).<br />
Page 43 of 72
In table 5.2, <strong>the</strong> specific input and output data related to 1 tonne of foil production are<br />
reported. The first column refers to <strong>the</strong> foil production process, i.e. from ingot up to<br />
packaging be<strong>for</strong>e delivery to <strong>the</strong> foil converter while <strong>the</strong> second column refers to <strong>the</strong><br />
remelting of 595 kg of process scrap.<br />
Table 5.2 Direct inputs and outputs <strong>for</strong> <strong>the</strong> foil production and <strong>the</strong> corresponding<br />
scrap recycling – Figures normalised to 1000 kg of finished foil.<br />
<strong>Aluminium</strong> foil production - Figures <strong>for</strong> 1 tonne of finished foil<br />
Foil<br />
production<br />
Scrap<br />
remelting<br />
Total<br />
Total thin<br />
gauge*<br />
Total thick<br />
gauge*<br />
Year<br />
2005<br />
1998**<br />
Main aluminium inputs<br />
Unit<br />
ingots kg 1007 1007 1032 1027<br />
Clean scrap kg 595<br />
Main aluminium outputs<br />
Dross/skimmings kg 24,5 33 27,7<br />
Metal content of dross/skimmings % 60%<br />
Clean scrap kg 595<br />
Finished foil kg 1000 1000 1000 1000<br />
End use energy inputs<br />
Heavy Oil<br />
kg 2,9 1,7 4,6<br />
Diesel and light fuel Oil<br />
kg 0,4 0,2 0,6 16 5,9<br />
Natural Gas kg 92 46 138 167 132<br />
O<strong>the</strong>r energy source (LPG) kg 0,0 1,7 1,7<br />
Total <strong>the</strong>rmal energy MJ 4.342 2257 6.599 8.323 6.291<br />
Electricity kWh 1.486 107,0 1.593 1.936 1.605<br />
Ancillary products, inputs<br />
Fluxing salts kg 2,86 2,86 0,8 0,66<br />
Argon kg 1,43 1,43 1,9 1,6<br />
Chlorine kg 0,03 0,03 0,016 0,013<br />
Filter tones kg 1,24 0,22 1,46<br />
Emulsion, hot rolling (oil content) kg 2,70 2,70<br />
Oil, cold rolling kg 24,10 24,1 41 31<br />
Lubricants and hydraulic oils kg 0,67 0,03 0,70<br />
Paper & cardboard <strong>for</strong> packaging kg 1,90 1,90 0,13 0,12<br />
Wood <strong>for</strong> packaging kg 28,50 28,5 41 39<br />
Steel <strong>for</strong> packaging kg 3,10 3,10 2,4 2,4<br />
Plastic <strong>for</strong> packaging kg 0,63 0,63 0,84 0,49<br />
Water input<br />
Water input*** m 3 9,1 7,0 16,1 124 100<br />
Emissions to air<br />
Carbon monoxide (CO) kg 0,41 0,06 0,47<br />
Dust/particulates, total kg 0,30 0,03 0,33<br />
Dust/particulates PM10 (
5.3 <strong>European</strong> LCI dataset <strong>for</strong> aluminium foil production<br />
The GaBi software was used to calculate <strong>the</strong> <strong>European</strong> LCI dataset <strong>for</strong> foil production<br />
in accordance with <strong>the</strong> model described in Fig. 5.1. This LCI dataset is available on<br />
request at lci@eaa.be. Main LCI data are reported in table 5.3 and associated<br />
environmental indicators are listed in table 5.4.<br />
Table 5.3 Main LCI data <strong>for</strong> <strong>the</strong> production of 1 tonne of aluminium foil from an<br />
ingot<br />
Year<br />
2005 1998<br />
Direct,<br />
auxillary &<br />
<strong>the</strong>rmal<br />
Electricity<br />
Total thin<br />
gauge*<br />
Total thick<br />
gauge*<br />
Total<br />
Main Inputs<br />
<strong>Aluminium</strong> ingot 1007 1027 1032<br />
Non-renewable energy resources<br />
Crude oil 63 36,0 26,7 79 58<br />
Hard coal 137 4,2 132,6 221 183<br />
Brown coal 216 2,9 213,3 233 193<br />
Natural gas 212 147,5 64,3 220 175<br />
Main outputs<br />
<strong>Aluminium</strong> foil 1000 1000 1000<br />
Main air emissions<br />
Carbon dioxide -CO2 1238 385 853 1367 1090<br />
Nitrogen oxides - NOx 2,69 1,11 1,58 2,4 1,9<br />
Sulphur dioxide - SO2 4,88 0,52 4,36 4,8 3,9<br />
Dust 0,53 0,35 0,18 0,69 1<br />
VOC (unspec.) 2,22 2,22 0,00 12 6,4<br />
*dross recycling not included in 1998<br />
Table 5.4 <strong>Environmental</strong> indicators <strong>for</strong> <strong>the</strong> production of 1 tonne of aluminium foil<br />
from an ingot.<br />
<strong>Environmental</strong> indicators (per tonne of foil)<br />
Total<br />
Direct, auxillary &<br />
<strong>the</strong>rmal<br />
Electricity<br />
Abiotic Depletion (ADP) [kg Sb-Equiv.] 8,59 4,02 4,58<br />
Acidification Potential (AP) [kg SO2-Equiv.] 6,90 1,31 5,60<br />
Eutrophication Potential (EP) [kg Phosphate-Equiv.] 0,37 0,16 0,22<br />
Greenhouse gas emission (GWP 100 years) [kg CO2-Equiv.] 1353 454 899<br />
Ozone Layer Depletion Potential (ODP, steady state) [kg R11-Equiv.] 2,16E-04 1,75E-06 2,15E-04<br />
Photo-oxidant Creation Potential (POCP) [kg E<strong>the</strong>ne-Equiv.] 0,72 0,40 0,32<br />
Primary energy from renewable raw materials (net cal. value) [MJ] 1.731 381 1.350<br />
Primary energy from non-renewable resources (net cal. value) [MJ] 25.898 8.416 17.483<br />
6. <strong>Aluminium</strong> extrusion<br />
6.1 Process steps description<br />
<strong>Aluminium</strong> profiles are produced by <strong>the</strong> extrusion process. The term extrusion is<br />
usually applied to both <strong>the</strong> process, and <strong>the</strong> product obtained, when a hot cylindrical<br />
billet of aluminium is pushed through a shaped die.<br />
Page 45 of 72
The starting material <strong>for</strong> aluminium extrusion production is an extrusion ingot<br />
(usually called log or billet), i.e. a several meters long cylinder with a diameter<br />
typically comprised between 20 and 50 cm. These billets are usually produced by DC<br />
casting technology. The ends (tops and tails) of <strong>the</strong> billets are usually sawed at <strong>the</strong><br />
cast house <strong>for</strong> direct remelting. Depending on <strong>the</strong> extrusion presses, <strong>the</strong> billet can be<br />
cut in smaller cylinder pieces be<strong>for</strong>e <strong>the</strong> extrusion process. Just be<strong>for</strong>e extrusion, <strong>the</strong><br />
billet is pre-heated usually around 450 °C - 500 °C. At <strong>the</strong>se temperatures <strong>the</strong> flow<br />
stress of <strong>the</strong> aluminium alloys is very low and by applying pressure by means of a<br />
ram to one end of <strong>the</strong> billet <strong>the</strong> metal flows through <strong>the</strong> steel die, located at <strong>the</strong> o<strong>the</strong>r<br />
end of <strong>the</strong> container to produce a profile, <strong>the</strong> cross sectional shape of which is defined<br />
by <strong>the</strong> shape of <strong>the</strong> die. The resulting profile (see Fig. 6.1) can be used in long lengths<br />
or cut into short parts <strong>for</strong> use in structures, vehicles or components<br />
DIE<br />
EXTRUSION<br />
BILLET<br />
RAM<br />
Fig. 6.1 Extrusion process principle and some aluminium extruded products<br />
The extrusion from cast billet up to finished profile generates about 320 kg of scrap<br />
by tonne of extrusion. These scrap are recycled into new ingot through remelting<br />
which is per<strong>for</strong>med ei<strong>the</strong>r on-site in integrated cast houses or externally. The<br />
recycling of process scrap is part of <strong>the</strong> LCI dataset <strong>for</strong> <strong>the</strong> extrusion production as<br />
illustrated in Fig. 6.2<br />
6.2 Data consolidation, averaging and modeling<br />
41 plants/sites have been integrated in <strong>the</strong> consolidation process representing 978kt of<br />
extrusion output, i.e. about 33% of <strong>the</strong> <strong>European</strong> production as reported in table 6.1.<br />
Table 6.1 Survey coverage <strong>for</strong> aluminium extrusion<br />
Total production in EU27 Total production Survey coverage<br />
and EFTA countries<br />
reported<br />
2.980.000 tonnes 978.000 tonnes 33%<br />
The questionnaire included general questions about <strong>the</strong> type of alloys, <strong>the</strong> type of<br />
semi-products and <strong>the</strong>ir applications. Consolidated percentages representative <strong>for</strong> <strong>the</strong><br />
<strong>European</strong> extrusion mix are reported in table 6.2.<br />
Page 46 of 72
Table 6.2 General data about extrusion alloys and product types<br />
Type of alloys<br />
Thermal treatment after<br />
extrusion<br />
Type of extruded products<br />
Applications<br />
Hard alloys, e.g. 2xxx, 7xxx, 5xxx (Mg > 1,5%) 1%<br />
Soft alloys, e.g. 1xxx, 3xxx, 5xxx (Mg 300 mm) 14%<br />
O<strong>the</strong>r tubes & profiles 78%<br />
O<strong>the</strong>r types of products 1%<br />
Total 100%<br />
Aeronautics 0%<br />
O<strong>the</strong>r transports 22%<br />
Building 43%<br />
Engineering 16%<br />
O<strong>the</strong>rs (including stockists) 19%<br />
Total 100%<br />
Regarding alloys, <strong>the</strong> consolidation corresponds to soft alloys exclusively, mainly<br />
6xxx series. Aged extrusion products represent 91% of <strong>the</strong> output while 9% is non-<br />
of <strong>the</strong> production. 14% of <strong>the</strong> production<br />
aged products. Bar and rods represents 7%<br />
refers to big size profile or tube with a diameter of <strong>the</strong> circumscribing circle bigger<br />
than 300 mm while <strong>the</strong> big majority of <strong>the</strong> production is smaller tubes and profiles<br />
(78% of <strong>the</strong> production). In absence of hard alloys, <strong>the</strong>re is almost no application in<br />
aeronautics. Never<strong>the</strong>less, 22% of <strong>the</strong> extrusion output is used in transport. The<br />
biggest market is building, i.e. 43%, while engineering applications stands <strong>for</strong> 16%.<br />
19% of <strong>the</strong> production goes to o<strong>the</strong>r applications, including stockists<br />
The flow diagram <strong>for</strong> extrusion is reported in Fig.6.2. In Table 6.3, <strong>the</strong> specific inputs<br />
and outputs are reported respectively <strong>for</strong> <strong>the</strong> extrusion production chain and <strong>for</strong> <strong>the</strong><br />
process scrap remelting. These data are normalised to <strong>the</strong> production of 1 tonne of<br />
extrusion.<br />
Fig. 6.2 Flow diagram <strong>for</strong> aluminium extrusion production<br />
(RER: EU27 + EFTA countries).<br />
Page 47 of 72
Table 6.3 Direct inputs and outputs <strong>for</strong> extrusion and <strong>the</strong> corresponding scrap<br />
recycling – Figures normalised to 1000 kg of finished extruded product.<br />
Unit<br />
Extrusion<br />
Scrap<br />
Remelting<br />
Total<br />
Year<br />
6.3 <strong>European</strong> LCI dataset <strong>for</strong> extrusion production<br />
2002 1998<br />
Main aluminium inputs<br />
Extrusion ingot kg 1008 1008 1013 1013<br />
Clean scrap kg 324<br />
Main aluminium outputs<br />
Dross/skimmings kg 10 15,3 18,4<br />
Metal content of dross/skimmings % 60%<br />
Clean scrap kg 324<br />
Finished profile kg 1000 1000 1000 1000<br />
End use Energy<br />
Heavy Oil kg 0,4 0,4<br />
Diesel and light fuel Oil kg 1,1 0,3 1,4 1,25 0, 65<br />
Natural Gas<br />
kg 47,7 25,6 73,3 81 101<br />
Total <strong>the</strong>rmal energy MJ 2.402 1.216 3.619 3.904 4.827<br />
Electricity kWh 758 118 876 913 1321<br />
Ancillaries inputs<br />
Argon kg 0,73 0,73 0,53<br />
Chlorine kg 0,04 0,04 0,011 0,081<br />
Water input (mainly cooling) m3 2,4 3,5 5,9 11 30<br />
Acids, calculated as 100% H 2 SO 4 kg 6,9 6,9<br />
Alkalis, calculated as 100% NaOH kg 11,3 11,3 15 28<br />
Paper & cardboard <strong>for</strong> packaging kg 7,5 7,5<br />
Wood <strong>for</strong> packaging kg 26 26 17 28<br />
Steel <strong>for</strong> packaging kg 0,7 0,7 1,8 0,9<br />
Plastic <strong>for</strong> packaging kg 2,5 2,5 4,5 2,1<br />
Outputs<br />
Water output m3 1,9 2,8 4,7 9 26<br />
Emissions to air<br />
NOX, as nitrogen dioxide kg 0,15 0,22 0,37<br />
SO2 kg 0,03 0 0,03<br />
Dust/particulates, total kg 0,04 0,04<br />
Water<br />
Water output<br />
m3 1,83 3,26 5,1<br />
Hazardous waste<br />
Spent caustic bath/sludge <strong>for</strong> land-filling kg 3,6 0 3,6<br />
Spent caustic bath/sludge <strong>for</strong> fur<strong>the</strong>r processing kg 21,6 0 21,6<br />
33 29<br />
Hazardous waste <strong>for</strong> land-filling kg 1,26 0,51 1,8 2,4 1,6<br />
O<strong>the</strong>r hazardous waste <strong>for</strong> fur<strong>the</strong>r processing kg 9,33 0 9,3<br />
Hazardous waste <strong>for</strong> incineration kg 1,72 0,04 1,8 2,2 1,7<br />
Total hazardous waste kg 37,5 0,5 38,1 37,6 32,3<br />
Non-hazardous waste (excluding aluminium scrap, dross/skimmings & demolition waste)<br />
Non-haz. waste <strong>for</strong> land-filling kg 2,05 1,74 3,79<br />
Non-haz. waste <strong>for</strong> incineration kg 2,11 0,07 2,18<br />
Non-haz. waste <strong>for</strong> fur<strong>the</strong>r processing kg 8,74 0,26 9<br />
Total non-hazardous waste kg 12,9 2,07 14,97 19 23<br />
By-products<br />
Metal scrap <strong>for</strong> recycling, excluding aluminium kg 6,81 0,46 7,27<br />
The GaBi software was used to calculate <strong>the</strong> <strong>European</strong> LCI dataset <strong>for</strong> extrusion<br />
production in accordance with <strong>the</strong> flow diagram described in Fig. 6.2. The LCI dataset<br />
is available on request at lci@eaa.be . Main LCI data <strong>for</strong> 1 tonne of extrusion are<br />
reported in table 6.4 and associated indicators in table 6.5.<br />
2005<br />
Page 48 of 72
Table 6.4 Main LCI data <strong>for</strong> <strong>the</strong> production of 1 tonne of aluminium extrusion from<br />
an ingot<br />
Year 2005<br />
2002 1998<br />
Inputs (kg)<br />
Total<br />
Process,<br />
<strong>the</strong>rmal & Electricity Total * Total *<br />
auxillary<br />
<strong>Aluminium</strong> ingot 1008 1013 1013<br />
Non renewable energy resources<br />
Crude oil 22,7 7,9 14,8 31 43<br />
Hard coal 77,1 3,7 73,5 104 151<br />
Brown coal 126,2 8,0 118,2 110 158<br />
Natural gas 123,7 88,1 35,6 106 135<br />
Outputs (kg)<br />
<strong>Aluminium</strong> extrusion 1000 1000 1000<br />
Main air emissions<br />
CO2 683 211 472 632 860<br />
NOx 1,56 0,69 0,88 1,1 1,5<br />
SO2 2,6 0,21 2,4 3,2 3,2<br />
Dust 0,11 0,01 0,10 0,47 0,69<br />
Methane 1,58 0,66 0,92 1,6 2,2<br />
Table 6.5 <strong>Environmental</strong> indicators <strong>for</strong> <strong>the</strong> production of 1 tonne of aluminium<br />
extrusion from an ingot<br />
EAA indicators (per tonne of aluminium profile)<br />
Total<br />
Direct, auxilary &<br />
<strong>the</strong>rmal<br />
Electricity<br />
Abiotic Depletion (ADP) [kg Sb-Equiv.] 4,70 2,16 2,53<br />
Acidification Potential (AP) [kg SO2-Equiv.] 3,80 0,70 3,10<br />
Eutrophication Potential (EP) [kg Phosphate-Equiv.] 0,22 0,10 0,12<br />
Greenhouse gas emission (GWP 100 years) [kg CO2-Equiv.] 726 227 498<br />
Ozone Layer Depletion Potential (ODP, steady state) [kg R11-Equiv.] 1,22E-04 3,33E-06 1,19E-04<br />
Photo-Oxidant Creation Potential (POCP) [kg E<strong>the</strong>ne-Equiv.] 0,23 0,06 0,18<br />
Primary energy from renewable raw materials (net cal. value) [MJ] 1146 398 748<br />
Primary energy from non-renewable resources (net cal. value) [MJ] 14311 4625 9686<br />
7. <strong>Aluminium</strong> recycling<br />
<strong>Aluminium</strong> has been recycled since <strong>the</strong> metal first began to be used commercially in<br />
<strong>the</strong> opening decades of <strong>the</strong> 20th century. Since that time a large number of remelters<br />
and refiners have been established, converting new and old aluminium scrap into new<br />
ingot, deoxidiser <strong>for</strong> <strong>the</strong> steel industry and master alloys. It is estimated that 75% of<br />
<strong>the</strong> aluminium ever produced is still in use today.<br />
There are very good commercial reasons why this recycling has always taken place.<br />
The high intrinsic value of aluminium makes remelting economically attractive. Using<br />
today's technology aluminium and its alloys can be melted and reused without loss of<br />
quality. Remelting <strong>the</strong> aluminium metal into a new ingot requires much less energy<br />
than <strong>the</strong> primary aluminium production from its ore. <strong>Aluminium</strong> recycling thus saves<br />
raw materials and energy, and also reduces demands on landfill sites.<br />
Recycling is a major consideration in continued aluminium use, representing one of<br />
<strong>the</strong> key attributes of this metal, with far-reaching economic, ecological and social<br />
implications. More than half of all <strong>the</strong> aluminium currently produced in <strong>the</strong> <strong>European</strong><br />
Page 49 of 72
Union (EU-27) originates from recycled raw materials and that trend is on <strong>the</strong><br />
i ncrease. In view of growing end-use demand and a lack of sufficient domestic<br />
primary aluminium production in this part of <strong>the</strong> world, Europe has a huge stake in<br />
maximising <strong>the</strong> collection of all available aluminium, and developing <strong>the</strong> most<br />
resource-efficient scrap treatments and melting processes.<br />
The economic, environmental and technical aspects of aluminium recycling are<br />
largely described in <strong>the</strong> brochure “<strong>Aluminium</strong> recycling, The Road to High Quality<br />
Products” published jointly by <strong>the</strong> EAA and <strong>the</strong> Organisation of <strong>European</strong> <strong>Aluminium</strong><br />
Refiners and Remelters (OEA) [7]. This brochure is available from <strong>the</strong> EAA website<br />
(www.aluminium.org ).<br />
The ‘recycling’ data were obtained through a survey organised by <strong>the</strong> OEA<br />
(Organisation of <strong>European</strong> <strong>Aluminium</strong> Refiners and Remelters) in cooperation with<br />
<strong>the</strong> IAI (International <strong>Aluminium</strong> Institute). The high fragmentation of <strong>the</strong> aluminium<br />
recycling industry limits <strong>the</strong> <strong>European</strong> coverage. However, a significant ef<strong>for</strong>t has<br />
been dedicated to model <strong>the</strong> scrap mass flows and <strong>the</strong>ir recycling routes in order to<br />
develop 2 models representative of <strong>the</strong> aluminium recycling of <strong>the</strong> <strong>European</strong> scrap<br />
mix.<br />
7.1 Scrap terminology<br />
A wide variety of aluminium scrap is processed by <strong>the</strong> secondary industry.<br />
<strong>Aluminium</strong> scrap terms and definitions are covered in EN 12258-3.<br />
New scrap (also called process scrap) is surplus material that arises during <strong>the</strong><br />
production and fabrication of aluminium products up to <strong>the</strong> point where <strong>the</strong>y are sold<br />
to <strong>the</strong> final consumer. Thus extrusion discards, sheet edge trim, turnings, millings and<br />
dross could all be described as new scrap.<br />
Old scrap is <strong>the</strong> aluminium material which is recovered after an aluminium product or<br />
component has been produced, used and finally collected <strong>for</strong> recycling. Old scrap<br />
could be a used aluminium beverage can, a car cylinder head, window frames or<br />
electrical conductor cable.<br />
7.2 Scrap recycling route and corresponding models<br />
Most new aluminium scrap comes into <strong>the</strong> recycling industry directly from <strong>the</strong><br />
fabricators. It is <strong>the</strong>re<strong>for</strong>e of known quality and alloy and is often uncoated. It can<br />
<strong>the</strong>n be melted with little preparation, apart perhaps from baling. Such scrap are<br />
usually collected by <strong>the</strong> so-called remelters and melted in reverbatory furnaces (see<br />
description in table 7.1) in order to produce new wrought aluminium alloys. Some<br />
new scrap that arises during semi-finishing processes may be coated with paints, ink<br />
or plastics. This scrap can be decoated by passing scrap through an oven or a mesh<br />
conveyer whilst hot gases are circulated through <strong>the</strong> mesh to volatilise or burn off <strong>the</strong><br />
coating. De-coating is usually <strong>the</strong> only significant scrap preparation step which can be<br />
applied to <strong>the</strong> scrap input by <strong>the</strong> remelters. The first model called “scrap remelting”<br />
will address this specific recycling route organised trough <strong>the</strong> remelters. No<br />
scrap preparation phase is included.<br />
Old aluminium scrap comes into <strong>the</strong> recycling industry via a very diversified and<br />
efficient network of metal merchants and waste management companies which have<br />
Page 50 of 72
<strong>the</strong> technology to recover aluminium from vehicles, household goods, etc. This is<br />
often done using heavy equipment such as shredders, toge<strong>the</strong>r with magnetic<br />
separators, to remove iron, sink-and-float installations, or by <strong>the</strong> use of eddy current<br />
installations to separate aluminium from o<strong>the</strong>r materials.<br />
After collection, sorting and preparation, <strong>the</strong>se old scrap are usually purchased by <strong>the</strong><br />
so-called refiners and are melted into casting alloys, also called foundry alloys.<br />
Refiners recycle not only scrap from end-of-life aluminium products but also, scrap<br />
from foundries, turnings, skimmings (dross) and aluminium metallics. The second<br />
model called “scrap recycling” will specifically address this recycling route<br />
organised through <strong>the</strong> refiners. It will include <strong>the</strong> scrap preparation phase.<br />
7.3 Furnace technologies<br />
Several melting processes are used. The choice of process depends upon a number of<br />
variables. These include <strong>the</strong> composition of <strong>the</strong> scrap, <strong>the</strong> processes available within a<br />
given plant, and economic and scheduling priorities. A breakdown of <strong>the</strong> most<br />
common melting technologies is given in table 7.1. Molten metal fluxing (to treat <strong>the</strong><br />
molten metal: chemical adjustment, cleaning, yield maximisation, degassing, etc.) and<br />
filtration technology (to remove any unwanted materials prior to casting) has been<br />
developed to produce aluminium alloys of <strong>the</strong> correct quality.<br />
Remelters use mainly reverbatory furnaces so that <strong>the</strong> “scrap remelting” model is<br />
based on this furnace technology only. Refiners use a combination of rotary and<br />
reverbatory furnaces which represent about 90% of <strong>the</strong>ir furnace technology while<br />
induction technology is quite marginal. As a result, <strong>the</strong> “scrap recycling” model is<br />
based on a mix of rotary and reverbatory furnace technologies.<br />
Page 51 of 72
Table 7.1 Furnace types and specificities <strong>for</strong> aluminium recycling.<br />
Furnace<br />
type<br />
erberatory<br />
Rev<br />
Rotary<br />
ion (not used in<br />
models)<br />
Induct<br />
Variations Principal application Specificities / features<br />
Comments<br />
Standard Melting larger volumes<br />
of clean scrap and<br />
primary feedstock<br />
- Large metal capacity (
processes include sand and permanent mould casting, high- and low-pressure casting<br />
and investment casting.<br />
The actual mix of recycling technique s applied to a specific product depends on many<br />
factors. The treatment of recycling in each specific LCA study should preferably be<br />
discussed with aluminium industry representatives (more in<strong>for</strong>mation at lci@eaa.be)<br />
7.5 Dross recycling and salt slag treatment [6]<br />
In absence of fluxing salt, melting aluminium usually produces residues such as dross<br />
or skimmings which is mainly composed of aluminium oxides and entrapped<br />
aluminium metal. Depending on <strong>the</strong> scrap input quality and size, between 20 and 100<br />
kg of dross can be produced per tonne of ingot with a metal content varying from 30<br />
to 60%. <strong>Aluminium</strong> metal contained in dross or skimmings, is recycled as part of <strong>the</strong><br />
aluminium refiners ’ operations. Large pieces of metal are separated from cool<br />
skimmings by manual sorting be<strong>for</strong>e s kimmings are fed to impact or ball mills in<br />
which <strong>the</strong> more friable aluminium oxide is ground up; finer metal fractions may <strong>the</strong>n<br />
be recovered with subsequent screen ing operations. <strong>Aluminium</strong> metallics, as a<br />
product of skimmings recycling operations, are recovered by a variety of methods<br />
with varying yi eld. Skimmings can also be fed directly into rotary<br />
furnaces and<br />
treated with more or less salt flux. Specific data have been also collected to model<br />
dross/skimmings recycling.<br />
Salt flux is used mainly in rotary furnace in order to clean <strong>the</strong> melt and to collect <strong>the</strong><br />
contaminants within <strong>the</strong> so-called salt slag. Salt slag contains between 5 and 20% of<br />
aluminium metal. Most of <strong>the</strong> salt slag is treated to recover <strong>the</strong> aluminium metal. This<br />
treatment includes a crushing and grinding process aiming at recovering <strong>the</strong> metal<br />
granulate which contains about 80% of aluminium metal. About 75% of <strong>the</strong> metal is<br />
recovered in <strong>the</strong> metal granulate. This metal granulates are melted in rotary furnaces.<br />
The non-metallic residue is <strong>the</strong>n leached and <strong>the</strong> residual metal is oxidised. The<br />
oxides and o<strong>the</strong>rs insoluble compounds are <strong>the</strong>n separated from <strong>the</strong> leaching solution<br />
through filtration. The last step consists in a crystallisation process to regenerate <strong>the</strong><br />
salt flux. Specific input and output data have been collected in order to model this salt<br />
slag treatment and associated aluminium recovery.<br />
7 .6 <strong>Aluminium</strong> scrap mass flow modelling<br />
The scrap mass flow modelling has been done through a joint ef<strong>for</strong>t between <strong>the</strong><br />
<strong>European</strong> <strong>Aluminium</strong> Association and <strong>the</strong> Organisation of <strong>European</strong> <strong>Aluminium</strong><br />
Refiners and Remelters (OEA). The scrap flow modelling uses <strong>the</strong> calculation<br />
methodology as described in [6]. The <strong>European</strong> consolidation <strong>for</strong> <strong>the</strong> year 2005 is<br />
reported in table 7.2 according to <strong>the</strong> various categories listed in EN 13920 [10]. This<br />
consolidation considers all new and old scrap which are tolled or purchased in<br />
Europe. Internal scrap are not considered. Scrap flows highlighted in yellow are<br />
considered in model 2 (aluminium recycling) while o<strong>the</strong>r scrap flows refer to <strong>the</strong><br />
model 1 (process scrap remelting).<br />
Page 53 of 72
Table 7.2 <strong>European</strong> scrap mass balance <strong>for</strong> <strong>the</strong> year 2005 expressed in kt (flows in<br />
yellow are part of model 2 “recycling scrap”)<br />
Rotary<br />
Refiners<br />
Reverberatory Remelters<br />
Furnace furnace<br />
Resource Origin Model Total Metal Total Metal Total Metal<br />
Extrusion scrap Fabrication kt 1<br />
471 458<br />
Foundry scrap Fabrication kt 2 228 190<br />
Turnings (extrusion & rolling) Fabrication kt 2 110 92 110 92<br />
Turnings (foil) Fabrication kt 2 13 13 13 13<br />
Turnings (foundry) Fabrication kt 2 231 194 231 194<br />
Building Manufacturing kt 1 89 83 154 150<br />
Transportation Manufacturing kt 1 135 127 222 209<br />
Consumer durables Manufacturing kt 1 38 35 49 46<br />
Cans & rigid packaging Manufacturing kt 1 & 2 200 173 200 173<br />
Flexible packaging Manufacturing kt 2 83 71 21 21<br />
Cable & wire Manufacturing kt 1 46 46<br />
Engineering Manufacturing kt 1 111 104 222 209<br />
O<strong>the</strong>r Manufacturing kt 1 19 18 25 23<br />
Turnings Manufacturing kt 2 56 47 55 47<br />
Total new scrap<br />
kt 720 607 1068 952 1343 1267<br />
Building End-of-Life kt 1&2 100 94 97 91<br />
Shredded transport scrap End-of-Life kt 1&2 760 642 0 0 33 31<br />
Dismantled transport scrap End-of-Life kt 1&2 16 15 148 139 158 149<br />
Cans and rigid packaging End-of-Life kt 1&2 12 11 47 44 233 219<br />
Flexible packaging End-of-Life kt 2 182 130<br />
Engineering End-of-Life kt 1&2 307 260 34 29 31 29<br />
Consumer durables End-of-Life kt 2 216 183<br />
O<strong>the</strong>r End-of-Life kt 2 33 28<br />
Total old scrap<br />
kt 1344 1139 510 435 552 519<br />
About 5.5 million tonnes of scrap (3.6 million tonnes by refiners and 1.9 by remelters)<br />
are used in Europe. For this analysis dross generated by primary cast houses is<br />
excluded and new packaging scrap, which is in reality mostly internal scrap, is<br />
included. OEA and EAA statistics <strong>for</strong> <strong>the</strong> year 2005 give a total tonnage of recycled<br />
aluminium of 4.8 million tonnes, which is perfectly in line with <strong>the</strong> metal content of<br />
scrap used in <strong>the</strong> model. Hence <strong>the</strong> scrap model used in this exercise is well<br />
representative of <strong>the</strong> reality.<br />
Approximately 50% of <strong>the</strong> scrap input of <strong>the</strong> refiners is composed of old scrap. Most<br />
of <strong>the</strong> new scrap going to <strong>the</strong> refiners are scrap from cast alloys (foundries),<br />
contaminated scrap (turnings) or thin-walled scrap possibly coated. The Model 2<br />
“scrap recycling” addresses such category of scrap which are mainly used <strong>for</strong><br />
producing casting alloys (see flows in yellow in table 7.2). The model 1 “scrap<br />
remelting” focuses on clean process scrap of wrought alloys which are mainly used by<br />
<strong>the</strong> remelters and by some refiners to produce new wrought alloys. These 2 models<br />
and <strong>the</strong> associated LCI data are described in <strong>the</strong> next sections<br />
7.7 Remelting model<br />
7.7.1 Data consolidation, averaging and modeling<br />
Input and output data used in <strong>the</strong> “scrap remelting” model have been collected by <strong>the</strong><br />
EAA. These data are representative <strong>for</strong> integrated cast houses which are part of rolling<br />
plants. 15 integrated cast houses have been included in <strong>the</strong> consolidation, representing<br />
a production of about 2.66 Mt of ingot. Such integrated cast houses usually uses a<br />
Page 54 of 72
mixed aluminium input composed mainly of clean process scrap (66%), ingot <strong>for</strong><br />
re melting (21%) and alloying elements (3%) and some liquid aluminium (10%)<br />
coming from special scrap (i.e. turnings) remelting in ano<strong>the</strong>r furnaces. For<br />
simplification, only scrap input are considered, i.e. o<strong>the</strong>r aluminium inputs are<br />
substituted by aluminium scrap. Table 7.3 reports <strong>the</strong> consolidated direct inputs and<br />
outputs calculated <strong>for</strong> 1 tonne of ingot.<br />
Table 7.3 Direct inputs and outputs <strong>for</strong> <strong>the</strong> production of 1 tonne of ingot from clean<br />
process scrap (data <strong>for</strong> model 1) – consolidated data <strong>for</strong> <strong>the</strong> years 2005, 2002 & 1998<br />
Year 2005 2002 1998<br />
<strong>Aluminium</strong> inputs<br />
Clean scrap kg 1009 1014 1014<br />
Alloying elements kg 29 25 21,8<br />
Main aluminium outputs<br />
Sawn ingots (slab or billet) kg 1000 1000 1000<br />
Dross/skimmings kg 42 42 32,7<br />
Metal content of dross/skimmings 60% 60% 60%<br />
Energy inputs<br />
Heavy Oil kg 2,7 5,6 1,7<br />
Diesel and light fuel Oil kg 0,3 0,3 0,1<br />
Natural Gas<br />
kg 68,1 67,2 67,0<br />
Propane kg 2,7 0,0<br />
Total <strong>the</strong>rmal energy MJ 3.367 3.314 3.136<br />
Electricity kWh 133 179 174<br />
Ancillary products, inputs<br />
Fluxing salts kg 0,50 0,68 0,89<br />
Argon kg 2,26 1,56 2,67<br />
Chlorine kg 0,14 0,14 0,039<br />
Water m 3 9,66 12,55 78<br />
Emissions to air<br />
Chlorine kg 0,006 N.L. N.L.<br />
Carbon monoxide (CO) kg 0,095 N.L. N.L.<br />
Dust/particulates, total kg 0,041 N.L. N.L.<br />
NOX, as nitrogen dioxide kg 0,329 N.L. N.L.<br />
SO2<br />
kg 0,051 N.L. N.L.<br />
VOC kg 0,050 N.L. N.L.<br />
Water<br />
Water output m 3 9,17 N.L. N.L.<br />
Waste (excluding dross, aluminium scrap & demolition waste)<br />
Hazardous waste <strong>for</strong> land-filling kg 2,69<br />
Hazardous waste <strong>for</strong> incineration kg 0,06<br />
Total hazardous waste kg 2,75 2,70<br />
Non-haz. waste <strong>for</strong> land-filling kg 0,32<br />
Non-haz. waste <strong>for</strong> incineration kg 0,27<br />
Non-haz. waste <strong>for</strong> fur<strong>the</strong>r processing kg 1,01<br />
Total non-hazardous waste kg 1,59 6,00 1,5<br />
By-products<br />
Metal scrap <strong>for</strong> recycling, excluding aluminium kg 0,51<br />
Unit<br />
Process scrap remelting & casting<br />
About 3300-3400 MJ of <strong>the</strong>rmal energy are used to melt <strong>the</strong> scrap and to cast <strong>the</strong><br />
aluminium. This figure can be compared to <strong>the</strong> <strong>the</strong>oretical energy value of 1140<br />
MJ/tonne which is needed to heat up and to melt pure aluminium from 20°C up to<br />
720°C [16].<br />
Page 55 of 72
7.7.2 <strong>European</strong> LCI data <strong>for</strong> scrap remelting<br />
The GaBi software was used to calculate <strong>the</strong> <strong>European</strong> LCI dataset <strong>for</strong> producing 1<br />
tonne of sawn ingot from new scrap in accordance with <strong>the</strong> data reported in table 7.3.<br />
The model includes <strong>the</strong> dross recycling. The LCI dataset is available on request at<br />
lci@eaa.be. Main LCI data <strong>for</strong> <strong>the</strong> production of 1 tonne aluminium ingot from new<br />
scrap are reported in table 7.4 and associated indicators in table 7.5. The metal losses<br />
d ue to <strong>the</strong> remelting process, after dross recycling, is calculated to 0.75%, i.e.<br />
7,5 kg/tonne.<br />
Table 7.4 Main LCI data <strong>for</strong> <strong>the</strong> production of 1 tonne of aluminium ingot from<br />
process scrap<br />
Year 2005<br />
2002 1998<br />
Process,<br />
Inputs (kg)<br />
Total <strong>the</strong>rmal & Electricity Total * Total *<br />
O<strong>the</strong>rs<br />
<strong>Aluminium</strong> scrap (100% metal) 1007 1014 1014<br />
Non renewable energy resources<br />
Crude oil (resource) 5,9 3,4 2,4 11,9 6,2<br />
Hard coal (resource) 12,5 0,5 12,0 20,0 18,7<br />
Brown coal (resource) 20,1 0,9 19,2 21,5 20,1<br />
Natural gas (resource) 87,5 80,9 6,6 74,0 76,7<br />
Outputs (kg)<br />
<strong>Aluminium</strong> ingot 1000 1000 1000 1000<br />
Main air emissions<br />
CO2 298 219 79 291 316<br />
NOx 0,39 0,25 0,14 0,42 0,41<br />
SO2 0,52 0,13 0,39 0,81 0,53<br />
Dust 0,06 0,05 0,01 0,12 0,1<br />
Organic emissions (total) 0,84 0,67 0,17 0,89 0,96<br />
VOC (unspecified) 0,05 0,05 0,00<br />
Methane 0,72 0,56 0,16<br />
* no substitution of alloying elements and no dross recycling included in 1998 & 2002<br />
modeling<br />
Table 7.5 <strong>Environmental</strong> indicators <strong>for</strong> <strong>the</strong> production of 1 tonne of aluminium ingot<br />
from process scrap<br />
EAA indicators (per tonne of ingot)<br />
Total<br />
Direct process, <strong>the</strong>rmal<br />
& auxilary<br />
Electricity<br />
Abiotic Depletion (ADP) [kg Sb-Equiv.] 2,27 1,84 0,43<br />
Acidification Potential (AP) [kg SO2-Equiv.] 0,87 0,36 0,51<br />
Eutrophication Potential (EP) [kg Phosphate-Equiv.] 0,067 0,047 0,020<br />
Greenhouse gas emission (GWP 100 years) [kg CO2-Equiv.] 317 234 83<br />
Ozone Layer Depletion Potential (ODP, steady state) [kg R11-Equiv.] 1,98E-05 4,39E-07 1,93E-05<br />
Photo-oxidant Creation Potential (POCP) [kg E<strong>the</strong>ne-Equiv.] 0,069 0,040 0,029<br />
Primary energy from renewable raw materials (net cal. value) [MJ] 125 3 122<br />
Primary energy from non-renewable resources (net cal. value) [MJ] 5464 3849 1615<br />
Page 56 of 72
7.8 Recycling model<br />
7.8.1 Scrap mix<br />
Since this scrap recycling model focuses on old and special scrap (i.e. turnings,<br />
casting scrap, etc) recycling, only <strong>the</strong> relevant flows have been extracted from <strong>the</strong><br />
table 7.2 in order to define <strong>the</strong> scrap material flow entering <strong>the</strong> recycling model. The<br />
table 7.6 reports such scrap mass flows.<br />
Table 7.6 <strong>European</strong> scrap mass flow used <strong>for</strong> <strong>the</strong> recycling model (model 2) in kt<br />
Rotary Furnace Reverberatory Furnace Metal<br />
Resource Total Metal Total Metal<br />
Foundry scrap kt 228 190 0 0 190<br />
Turnings kt 410 346 410 346 691<br />
Cans & rigid packaging (old) kt 12 11 247 217 228<br />
Flexible packaging (old) kt 83 71 203 150 222<br />
Building (old) kt 0 0 100 94 94<br />
Shredded transport scrap (old) kt 760 642 0 0 642<br />
Dismantled transport scrap (old) kt 16 15 148 139 154<br />
Engineering (old) kt 307 260 34 29 289<br />
Consumer durables (old) kt 216 183 0 0 183<br />
O<strong>the</strong>r (old) kt 33 28 0 0 28<br />
Total kt 2064 1745 1141 974 2719<br />
Scrap input share 64% 36%<br />
According to this table, about 2/3 of <strong>the</strong> scrap are going to <strong>the</strong> rotary furnace (64%)<br />
and 1/3 to <strong>the</strong> reverbatory furnace (36%). The table 7.7 reports above flows in metal<br />
percentage.<br />
Table 7.7 <strong>European</strong> scrap mass flow used <strong>for</strong> <strong>the</strong> recycling model in %<br />
Rotary Furnace Reverberatory furnace<br />
Foundry scrap kt 11% 0%<br />
Turnings kt 20% 36%<br />
Cans & rigid packaging (old) kt 1% 22%<br />
Flexible packaging (old) kt 4% 18%<br />
Building (old) kt 0%<br />
9%<br />
Shredded transport scrap (old) kt 37% 0%<br />
Dismantled transport scrap (old) kt 1% 13%<br />
Engineering (old) kt 15% 3%<br />
Consumer durables (old) kt 10% 0%<br />
O<strong>the</strong>r (old) kt 2% 0%<br />
Total kt 100% 100%<br />
Scrap from transport applications (mainly automotive) constitutes with turnings,<br />
foundry scrap and engineering scrap <strong>the</strong> main input <strong>for</strong> rotary furnaces. Turnings, old<br />
packaging, building scrap and dismantled scrap from transport application (mainly<br />
mass transport) are <strong>the</strong> main input of <strong>the</strong> reverbatory furnace.<br />
Page 57 of 72
7.8.2 Scrap preparation<br />
The scrap preparation is highly dependent on <strong>the</strong> scrap type and origins. A motor<br />
block engine, a used beverage can or a facade panel are not prepared in <strong>the</strong> same way<br />
be<strong>for</strong>e melting. The table 7.8 reports <strong>the</strong> typical scrap preparation processes which are<br />
applied to <strong>the</strong> various scrap categories. While some preparation processes are applied<br />
systematically to <strong>the</strong> whole scrap flow, o<strong>the</strong>r processes are only applied to a fraction<br />
of <strong>the</strong> scrap flow. It is particularly <strong>the</strong> case <strong>for</strong> shredding, sink & float, cutting &<br />
balling. The estimated percentage of scrap flow entering <strong>the</strong>se process are mentioned<br />
in bracket.<br />
Table 7.8 Main scrap preparation processes according to scrap type<br />
Scrap mass flow<br />
Main preparation processes<br />
Foundry scrap<br />
No processing<br />
Turnings<br />
Drying and de-oiling<br />
Cans & rigid packaging (old)<br />
De-lacquering & Baling<br />
Flexible packaging (old)<br />
Baling<br />
Shredding (50%),<br />
Building (old)<br />
Sink & float (20%), balling & cutting (20%)<br />
Shredding (80%), Dismantling (20%),<br />
Transport (old)<br />
Sink & float (40%)<br />
Engineering (old) Shredding (100%), Sink & float (40%)<br />
Consumer durables (old) Shredding (100%), Sink & float (40%)<br />
O<strong>the</strong>r (old) Shredding (100%), Sink & float (40%)<br />
Based on tables 7.7 and 7.8, <strong>the</strong> model <strong>for</strong> <strong>the</strong> scrap preparation phase has been<br />
developed. The fractions of <strong>the</strong> <strong>European</strong> scrap mix entering <strong>the</strong> various preparation<br />
processes are reported in table 7.9. These processes can be applied consequently like<br />
“ shredding + sink & float” or “cutting and balling + de-lacquering”. Table 7.9 is used<br />
to evalu ate <strong>the</strong> consolidate model based on <strong>the</strong> input and output data related to <strong>the</strong><br />
listed preparation processes.<br />
Table 7.9 Main scrap preparation processes and corresponding scrap mass flow<br />
fraction entering <strong>the</strong> process.<br />
Preparation process<br />
Scrap Mass flow<br />
fraction<br />
Input & output<br />
data<br />
Shredding - wrought alloys 25,0% Year 2005<br />
Shreddding -cast alloys 30,0% Year 1998<br />
Sink & Float 15,0% Year 1998<br />
Cuting & Baling 20,0% Year 1998<br />
Drying & deoiling 25,0% Year 1998<br />
De-lacquering 10,0% Year 2005<br />
Dismantling 5,0% No data<br />
No pretraitment 10,0%<br />
Page 58 of 72
7.8.3 Data consolidation, averaging and modeling<br />
Scrap preparation<br />
Most of <strong>the</strong> aluminium refiners are not involved in <strong>the</strong> scrap preparation phase and,<br />
except <strong>for</strong> delacquering & wrought aluminium shredding, it has not been possible to<br />
collect updated input and output figures <strong>for</strong> unit processes of <strong>the</strong> scrap preparation<br />
phase (as detailed in table 7.8 and 7.9). As a result, unit processes data related to <strong>the</strong><br />
previous survey have been used to produce <strong>the</strong> new consolidated model <strong>for</strong> <strong>the</strong> scrap<br />
preparation. This is deemed as an acceptable representation of <strong>the</strong> unit processes<br />
current situation (2005), as no significant changes were recorded in scrap preparation<br />
practices since 1998. These scrap preparation unit processes data were eventually<br />
combined with <strong>the</strong> actual scrap mass flow fractions as reported in table 7.9.<br />
Table 7.10 reports <strong>the</strong> consolidat ed figures <strong>for</strong> <strong>the</strong> scrap preparation phase according<br />
to <strong>the</strong> scrap flows reported in table 7.9. Data <strong>for</strong> <strong>the</strong> year 2005 can be compared with<br />
<strong>the</strong> data modelled<br />
<strong>for</strong> <strong>the</strong> year 1998.<br />
Table 7.10 Consolidated inputs and outputs <strong>for</strong> <strong>the</strong> scrap preparation<br />
Unit<br />
Consolidated data<br />
Inputs<br />
Solid input<br />
Energy Input<br />
O<strong>the</strong>r inputs<br />
Output<br />
<strong>Aluminium</strong> output<br />
By-products<br />
Emissions to Air<br />
Emissions to Land<br />
YEAR 2005 1998<br />
Foreign elements/contaminants kg 200<br />
<strong>Aluminium</strong> scrap input kg 1050<br />
1229<br />
Electricity kWh 63 64<br />
Natural gas<br />
kg 13,5 22<br />
Fuel oil<br />
kg 2,1 4,16<br />
Total <strong>the</strong>rmal energy MJ 725 1165<br />
Ferro-Silicon kg 1,2 0,58<br />
Water kg 45<br />
Light oil kg 0,17 0,08<br />
Hydraulic oil kg 0,01<br />
Detergent kg 0,12<br />
Lime kg 0,14<br />
Additives<br />
kg 0,46 0,96<br />
<strong>Aluminium</strong> scrap output kg 1000 1000<br />
(Non-Ferrous) Metals kg 115 40<br />
Iron scrap kg 34 9,5<br />
Oil (<strong>for</strong> incineration) kg 1,25 2,6<br />
Dust kg 0,10 0,03<br />
Hydrogen Chloride kg 0,01 0,01<br />
Dirt kg 8 1,9<br />
Filter dust kg 3,52 3,3<br />
Refractory waste kg 0,04 0,09<br />
Solid waste (unspecified) kg 1,61 3,2<br />
Stones kg 8 4,2<br />
Rubber kg 47 24<br />
Waste sediment kg 6,6 3,3<br />
Scrap refining<br />
Unlike scrap preparation, scrap refining went through considerable changes from<br />
1998 to 2005. Even if <strong>the</strong> aluminium refining industry is still today a quite highly<br />
Page 59 of 72
fragmented industry, <strong>the</strong> number of aluminium refiners in Europe decreased strongly<br />
(by 42% in <strong>the</strong> last 12 years) toge<strong>the</strong>r with production capacity increases and<br />
significant technology improvements. These structural changes resulted in particular<br />
with a modified furnace technology mix (see table 7.6), where electric induction<br />
furnaces are practically no longer used.<br />
Collecting data among aluminium refiners is very challenging considering <strong>the</strong> size<br />
and <strong>the</strong> fragmentation of <strong>the</strong> aluminium recycling industry. As a result, it has not been<br />
possible to have a survey coverage level in term of tonnage comparable to <strong>the</strong> o<strong>the</strong>r<br />
aluminium processes (primary aluminium, aluminium sheet, aluminium extrusion).<br />
Table 7.11 reports <strong>for</strong> <strong>the</strong> scrap refining processes <strong>the</strong> number of replies, <strong>the</strong><br />
corresponding tonnage of metal input and <strong>the</strong> survey coverage.<br />
Table 7.11 Survey coverage <strong>for</strong> aluminium recycling processes (refiners)<br />
Process Nb replies Metal input in kt <strong>European</strong> coverage<br />
Scrap refining 10 820 23%<br />
Table 7.12 reports <strong>the</strong> consolidated figures <strong>for</strong> <strong>the</strong> scrap refining phase according to<br />
<strong>the</strong> scrap flows reported in table 7.6. Data <strong>for</strong> <strong>the</strong> year 2005 can be compared with <strong>the</strong><br />
data modelled <strong>for</strong> <strong>the</strong> year 1998.<br />
Table 7.12 Direct inputs and outputs <strong>for</strong> <strong>the</strong> scrap refining process (combination of<br />
64% rotary furnace and 36% reverbatory) - Figures <strong>for</strong> 1 tonne of ingot<br />
Year 2005 1998<br />
Inputs<br />
Raw scrap input (metal + contaminants) kg 1054 1033<br />
Alloy input (metal) kg 64 78<br />
Salt kg 11,3 13,7<br />
Water (cooling) m3 17,8 N.L.<br />
Sodium aluminum fluoride (Na3AlF6) kg 0,72<br />
Lime (used <strong>for</strong> emission treatment) kg 3,94 7,4<br />
Lubricants (maintenance material) kg 0,11<br />
Nitrogen (N2) kg 3,20 1,8<br />
Chlorine (Cl2) kg 0,25 1,6<br />
Argon kg 0,97<br />
Refractory kg 2,4<br />
Fuels & Electricity<br />
Gas kg 83,7 202,8<br />
Heavy fuel oil kg 4,00 17,1<br />
Total <strong>the</strong>rmal energy* MJ 3990 9971<br />
Electricity kWh 60,8 353,9<br />
Outputs<br />
Ingot kg 1000 1000<br />
Iron Scrap kg 1,7 2,2<br />
<strong>Aluminium</strong> oxide kg 107 119<br />
Water m3 8,8 N.L.<br />
Air emissions<br />
Dust kg 0,021 0,03<br />
Hydrogen Fluoride (HF) kg 0,002 0,004<br />
Hydrogen Chloride (HCl) kg 0,038 0,05<br />
Chlorine (Cl2) kg 0,002 0,0005<br />
Solid waste<br />
Filter Dust landfilled kt 17,39 24,1<br />
Waste <strong>for</strong> recycling kt 1,20 2,2<br />
Hazardous Waste landfilled kt 0,85 2<br />
Page 60 of 72
In this recycling model, it is assumed that 15% of additional <strong>the</strong>rmal energy is coming<br />
from <strong>the</strong> combustion of contaminants, i.e. mainly plastics. This additional <strong>the</strong>rmal<br />
energy of 600 MJ (15% of <strong>the</strong> total) has been modelled through <strong>the</strong> use of LCI data<br />
related to <strong>the</strong> combustion of polyethylene (PE). This corresponds to about 25kg of PE<br />
which is burned since <strong>the</strong> PE calorific value is around 25 MJ/kg.<br />
7.8.4 Material flow and LCI data <strong>for</strong> <strong>the</strong> recycling model<br />
Fig. 7.1 reports <strong>the</strong> flow diagram which is used <strong>for</strong> <strong>the</strong> recycling model. The main<br />
inputs are aluminium scrap and salt. As in previous models, alloying elements (mainly<br />
silicon and magnesium <strong>for</strong> recycled aluminium) are substituted by pure aluminium<br />
and do not appear on <strong>the</strong> flow diagram. The main outputs are aluminium ingot and<br />
non-metallic residues. Detailed LCI data are available on request (please email<br />
lc i@eaa.be). Main LCI data are reported in table 7.13.<br />
Salt 11,3 kg<br />
Recycling model boundaries<br />
Salt<br />
179 kg<br />
Scrap mix Salt Slag 333 kg<br />
Foundry scrap<br />
Metal input:<br />
675 kg<br />
Rotary<br />
furnace<br />
Salt slag<br />
processor<br />
Turnings<br />
Old scrap<br />
1319 kg<br />
(including 211 kg of<br />
contaminants)<br />
Scrap<br />
preparation<br />
model<br />
(shredding,<br />
sink & float,<br />
cutting<br />
balling, deoiling,<br />
etc.)<br />
Scrap mix<br />
29 kg<br />
Dross 86 kg Granulate<br />
Rotary <strong>for</strong><br />
dross<br />
Metal input:<br />
380 kg<br />
Reverbatory<br />
furnace<br />
346 kg 601 kg 53 kg<br />
1000 kg of recycled aluminium ingot 330 kg of by-products and residue<br />
Fig. 7.1 Material flow diagram of <strong>the</strong> recycling model<br />
Page 61 of 72
Table 7.13 Main LCI data <strong>for</strong> aluminium recycling per tonne of recycled ingot<br />
Year 2005<br />
1998<br />
Process,<br />
Inputs (kg)<br />
Total <strong>the</strong>rmal & Electricity Total<br />
O<strong>the</strong>rs<br />
Total scrap input (preparation phase) 1319 1108<br />
Total metal input 1108 1108<br />
1270<br />
Foreign materials<br />
Metal input (refining)<br />
211<br />
1055<br />
211<br />
1055<br />
1033<br />
Alloying elements* 0 (67) 79<br />
Salt 11,3 11,3 13,7<br />
Non renewable energy resources<br />
Crude oil (resource) 10,9 8,2 2,7 32,3<br />
Hard coal (resource) 15,3 1,9 13,4 45,8<br />
Lignite (resource) 23,2 1,7 21,5 49,6<br />
Natural gas (resource) 120,1 104,6 15,5 233<br />
Outputs (kg)<br />
<strong>Aluminium</strong> ingot 1000 1000 1000<br />
<strong>Aluminium</strong> oxide 107 107 119<br />
Iron scrap 38 38 12<br />
Residues (rubber, filter dust, etc.) 180 180 162<br />
Main air emissions<br />
CO2 481 382 99 801<br />
NOx 0,55 0,37 0,18 1,1<br />
SO2 0,7 0,25 0 2<br />
Dust 0,17 0,15 0,02 0,29<br />
Organic emissions 1,08 0,83 0,25 2,6<br />
Methane 0, 97 0,74 0,23<br />
* Alloying elements are substituted by aluminium scrap in <strong>the</strong> 2005 model - figure<br />
provided as in<strong>for</strong>mation<br />
From <strong>the</strong> model, it is estimated that 1108 kg of Al scrap enters <strong>the</strong> scrap preparation<br />
phase accompanied with about 211 kg of <strong>for</strong>eign materials. 1055kg of scrap exits <strong>the</strong><br />
scrap preparation and enters <strong>the</strong> melting model <strong>for</strong> producing 1 tonne of ingot.<br />
Air emissions and primary energy use are significantly reduced compared to 1998.<br />
This is mainly due to a significant reduction of <strong>the</strong>rmal energy use <strong>for</strong> <strong>the</strong> melting<br />
process. About 5.000 MJ of <strong>the</strong>rmal energy from fuels is used in 2005 while more<br />
than 8.000 MJ were estimated in 1998. Two main reasons explain this significant<br />
evolution:<br />
- In 1998, figures related to energy use were probably overestimated<br />
- I n 2005, furnace technologies used by <strong>European</strong> refiners are<br />
significantly improved especially in term of energy transfer and<br />
burners technology.<br />
The corresponding environmental indicators are reported in table 7.14.<br />
Page 62 of 72
Table 7.14 <strong>Environmental</strong> Indicators <strong>for</strong> aluminium recycling per tonne of recycled<br />
ingot – year 2005<br />
<strong>Environmental</strong> indicators (per tonne of recycled ingot) Total<br />
Direct, <strong>the</strong>rmal &<br />
o<strong>the</strong>rs<br />
Electricity<br />
Abiotic Depletion (ADP) [kg Sb-Equiv.] 3,13 2,48 0,66<br />
Acidification Potential (AP) [kg SO2-Equiv.] 1,12 0,52 0,59<br />
Eutrophication Potential (EP) [kg Phosphate-Equiv.] 0,080 0,055 0,026<br />
Greenhouse gas emission (GWP 100 years) [kg CO2-Equiv.] 506 391 115<br />
Ozone Layer Depletion Potential (ODP, steady state) [kg R11-Equiv.] 2,34E-05 1,80E-06 2,16E-05<br />
Photochem. Ozone Creation Potential (POCP) [kg E<strong>the</strong>ne-Equiv.] 0,085 0,050 0,035<br />
Primary energy from renewable raw materials (net cal. value) [MJ] 295 159 136<br />
Primary energy from resources (net cal. value) [MJ] 7389 5217 2172<br />
7.8.5 LCA & aluminium recycling<br />
Preserving <strong>the</strong> aluminium metal during <strong>the</strong> whole product life cycle and during<br />
recycling should be a main goal <strong>for</strong> aluminium products since recycled aluminium can<br />
be used <strong>for</strong> producing new wrought or cast aluminium alloys which are used <strong>for</strong> new<br />
products. As a result, any LCA study needs to consider and to credit properly <strong>the</strong><br />
ability of aluminium to be recycled, usually without any downgrading properties. The<br />
<strong>European</strong> aluminium industry recommends using <strong>the</strong> so-called substitution<br />
methodology which considers that recycled aluminium substitutes primary aluminium<br />
sot that only metal losses during <strong>the</strong> whole life cycle needs to be balanced by primary<br />
aluminium. Details about such methodology are given in <strong>the</strong> technical document<br />
“LCA & aluminium recycling” which can be downloaded from <strong>the</strong> EAA website.<br />
As a result, it is crucial to evaluate correctly <strong>the</strong> metal losses during <strong>the</strong> recycling<br />
phase. The “recycling model” reported in this document is only valid <strong>for</strong> <strong>the</strong> scrap<br />
mix reported in table 7.3. Table 7.15 reports specific estimates of metal losses <strong>for</strong><br />
various old scrap categories [6]. It is recommended to use such specific metal losses<br />
within LCA studies. These metal losses refer to <strong>the</strong> scrap melting and refining phase.<br />
Possible losses associated with <strong>the</strong> collection of <strong>the</strong> end-of-life aluminium products<br />
and <strong>the</strong> scrap preparation are not included.<br />
Table 7.15 Metal losses during refining <strong>for</strong> various old scrap categories [6]<br />
Old scrap types<br />
Estimated metal losses <strong>for</strong><br />
<strong>the</strong> melting process<br />
Building 1-4%<br />
Shredded Transport Scrap 4-8%<br />
Dismanted Transport Scrap 2-4%<br />
Used Beverage Cans<br />
2-3%<br />
Mixed packaging and foil 2-8%<br />
Engineering 3-7%<br />
Consumer durables 3-7%<br />
Total old scrap 4-6%<br />
Total recycling model 5%<br />
Within <strong>the</strong> <strong>European</strong> Reference Life Cycle Data System [14], two generic LCI datasets<br />
have been developed from a “cradle to recycling” perspective, respectively <strong>for</strong> 1 kg of<br />
aluminium sheet and <strong>for</strong> 1 kg of aluminium profile. These two datasets related to<br />
aluminium semi-finished products have been developed on basis of <strong>the</strong> EAA LCI<br />
Page 63 of 72
d atasets on <strong>the</strong> production and trans<strong>for</strong>mation processes described in this report.<br />
These datasets include <strong>the</strong> alu minium production, <strong>the</strong> semi-production process<br />
(rolling or extrusion) and <strong>the</strong> end of life aluminium recycling. The 2 LCI datasets and<br />
<strong>the</strong> documentation can be downloaded from <strong>the</strong> website of <strong>the</strong> <strong>European</strong> plat<strong>for</strong>m on<br />
LCA (http://lca.jrc.ec.europa.eu).<br />
Page 64 of 72
8. Glossary & definitions<br />
aluminium:<br />
Metal with a minimum content of 99,0% by mass of aluminium provided<br />
that <strong>the</strong> content by mass of any o<strong>the</strong>r element does not exceed <strong>the</strong><br />
following limits:<br />
- iron + silicon content not greater than 1,0%<br />
- o<strong>the</strong>r element content not greater than 0,10% each, with <strong>the</strong> exception<br />
of copper which is permitted to a content of up to 0,20% provided that<br />
nei<strong>the</strong>r <strong>the</strong> chromium nor <strong>the</strong> manganese content exceeds 0,05%<br />
Note: aluminium in <strong>the</strong> liquid state or in <strong>the</strong> <strong>for</strong>m of ingots <strong>for</strong> remelting<br />
is often called "unalloyed aluminium".<br />
ancillary material: Material input that is used by <strong>the</strong> unit process producing <strong>the</strong> product, but<br />
not directly used in <strong>the</strong> <strong>for</strong>mation of <strong>the</strong> product<br />
annealing: Thermal treatment to soften metal by reduction or removal of stress<br />
resulting from cold working and/or by coalescing precipitates from <strong>the</strong><br />
solid solution.<br />
blank<br />
Piece of metal of regular or irregular shape taken from a flat wrought<br />
product intended <strong>for</strong> subsequent processing such as bending, stamping or<br />
deep drawing.<br />
can stock Sheet or strip used <strong>for</strong> <strong>the</strong> fabrication of rigid cans, including lids and<br />
tabs, <strong>for</strong>med by drawing or pressing operations. Can stock covers can<br />
body stock, lid stock and tab stock.<br />
casting (process) Process in which molten metal is poured into a mould and solidified.<br />
casting alloy<br />
converter foil<br />
direct chill (DC)<br />
casting<br />
elementary flow<br />
extrusion:<br />
extrusion ingot<br />
foil:<br />
<strong>for</strong>ming<br />
heat treatment<br />
homogenisation<br />
Alloy primarily intended <strong>for</strong> <strong>the</strong> production of castings.<br />
Rolled aluminium in <strong>the</strong> gauge range 5 µm to 200 µm, produced ei<strong>the</strong>r<br />
by double rolling (5µm to 70 µm), or single rolling (35 µm to 200 µm),<br />
typically annealed soft and supplied <strong>for</strong> fur<strong>the</strong>r processing such as<br />
colouring, printing, embossing or laminating<br />
Semi-continuous casting technique in which molten metal is solidified in<br />
a water-cooled open-ended mould.<br />
Any flow of raw material entering <strong>the</strong> system being studied which has<br />
been drawn from <strong>the</strong> environment without previous human<br />
trans<strong>for</strong>mation; any flow of material leaving <strong>the</strong> system being studied<br />
which is discarded into <strong>the</strong> environment without subsequent human<br />
trans<strong>for</strong>mation.<br />
Process in which a billet in a container is <strong>for</strong>ced under pressure though a<br />
die aperture<br />
<strong>Aluminium</strong> or aluminium alloy cast in a <strong>for</strong>m suitable <strong>for</strong> extruding.<br />
Flat rolled product of rectangular cross-section with uni<strong>for</strong>m thickness<br />
equal to or less than 0,20 mm<br />
Note: Sometimes <strong>the</strong> term "foil" covers two different products:<br />
- foil : products with lesser thickness;<br />
- thin strip : products with greater thickness.<br />
The dimensional limitations between <strong>the</strong>se two products may vary from<br />
country to country<br />
Process by which a product is trans<strong>for</strong>med into a desired shape<br />
without changing its mass.<br />
Heating, holding at elevated temperature and cooling of <strong>the</strong> solid<br />
metal in such a way as to obtain desired tempers or properties.<br />
Heating <strong>for</strong> <strong>the</strong> sole purpose of hot working is excluded from <strong>the</strong><br />
meaning of this term.<br />
Process in which metal is heated at high temperature during a<br />
specified time, generally in order to facilitate working and to<br />
Page 65 of 72
hot working<br />
ingot<br />
remelting<br />
PAH<br />
primary<br />
aluminium<br />
primary ingot<br />
refined<br />
aluminium alloy<br />
remelt metal<br />
rolling ingot<br />
section<br />
semi-finished<br />
product<br />
sheet/plate<br />
strip<br />
solution<br />
treatment<br />
working<br />
wrought alloy<br />
<strong>for</strong><br />
heat<br />
wrought product<br />
confer certain desirable properties on <strong>the</strong> semi-fabricated product,<br />
in particular to eliminate or decrease micro segregation by<br />
diffusion.<br />
Working of a metal within a temperature range and at a rate such<br />
that significant strain does not occur.<br />
Metal cast in a <strong>for</strong>m suitable <strong>for</strong> remelting which has been<br />
processed, as appropriate, to adjust <strong>the</strong> chemical composition<br />
and/or to remove certain metallic or non-metallic impurities.<br />
Polycyclic aromatic hydrocarbons<br />
<strong>Aluminium</strong> produced by electrolytic reduction from alumina.<br />
Remelt metal is excluded from this term.<br />
Ingot produced from primary aluminium. It may incorporate<br />
suitably identified uncontaminated scrap from ingot production.<br />
<strong>Aluminium</strong> alloy obtained after metallurgical treatment of molten<br />
metal obtained from aluminium scrap.<br />
Note : This term is mainly used <strong>for</strong> casting alloys.<br />
Wrought aluminium or aluminium alloy obtained by remelting.<br />
<strong>Aluminium</strong> or aluminium alloy cast in a <strong>for</strong>m suitable <strong>for</strong> rolling.<br />
Wrought product, usually extruded, of uni<strong>for</strong>m cross-section along<br />
its whole length, usually supplied in straight lengths or sometimes<br />
in coiled <strong>for</strong>m. Rods, bars, wire, tubes, sheet and strip are excluded<br />
from this term.<br />
Product which is supplied <strong>for</strong> fur<strong>the</strong>r fabrication.<br />
Flat rolled product of rectangular cross-section with uni<strong>for</strong>m<br />
thickness between 0,20 mm and 6 mm (sheet) or above 6 mm<br />
(plate), supplied in flat straight lengths usually with trimmed or<br />
sawn edges. The thickness does not exceed one-tenth of <strong>the</strong> width.<br />
Flat rolled product of rectangular cross-section with uni<strong>for</strong>m<br />
thickness over 0,20 mm, supplied in coils usually with trimmed<br />
edges. The tickness does not exceed one-tenth of <strong>the</strong> width.<br />
Process in which an alloy is heated to a suitable temperature and is<br />
held at temperature long enough to allow soluble constituents to<br />
enter into solid solution and <strong>the</strong>n cooled rapidly enough to hold <strong>the</strong><br />
constituents in solution.<br />
Forming of a metal, generally with elongation but not necessarily<br />
in a preferred direction. Working may be carried out hot or cold by<br />
such processes as rolling, extruding, <strong>for</strong>ging, etc.<br />
Alloy primarily intended <strong>for</strong> <strong>the</strong> production of wrought products<br />
by hot and/or cold working<br />
General term <strong>for</strong> products obtained by hot and/or cold working<br />
processes such as extruding, <strong>for</strong>ging, hot rolling, cold rolling or<br />
drawing, ei<strong>the</strong>r exclusively or in combination. Examples of<br />
wrought products are rods/bars, wire, tubes, profiles, sheet, strip<br />
and <strong>for</strong>ging.<br />
Page 66 of 72
Definitions related to aluminium scrap <strong>for</strong> recycling taken from EN 12258-3<br />
(aluminium) ra w material, destined <strong>for</strong> trade and industry, mainly consisting of<br />
scrap<br />
aluminium and/or aluminium alloys, resulting from <strong>the</strong> collection and/or<br />
recovery of<br />
- metal that arises at various stages of fabrication or<br />
- products after use<br />
to be used <strong>for</strong> <strong>the</strong> production of wrought and cast alloys and <strong>for</strong> o<strong>the</strong>r<br />
production processes<br />
clean scrap scrap which does not contain <strong>for</strong>eign material<br />
coated scrap scrap consisting of pieces with any kind of coating, e.g. paint, varnish,<br />
printing ink, plastics, paper, metal<br />
dross<br />
Skimmings with low metal content<br />
new scrap scrap arising from <strong>the</strong> production and fabrication of aluminium products<br />
old scrap scrap arising from products after use<br />
skimmings material composed of intimately mixed aluminium and aluminium oxides<br />
which have been removed from <strong>the</strong> surface of <strong>the</strong> molten metal or from <strong>the</strong><br />
bottom and walls of liquid metal containers, e. g. a furnace, transport<br />
ladles, or transfer channels<br />
NOTE: The same material with low metal content is often called "dross".<br />
metallics material produced by <strong>the</strong> crushing or grinding of skimmings by means of<br />
ball mills, hammer mills, impactors, etc. and <strong>the</strong> selection of <strong>the</strong> coarser<br />
fraction where most of <strong>the</strong> metallic aluminium is concentrated, by<br />
screening<br />
fines fine-grained portion obtained from <strong>the</strong> milling of skimmings holding a low<br />
metal content but a high content of aluminum oxides and o<strong>the</strong>r oxides.<br />
<strong>for</strong>eign material any material o<strong>the</strong>r than aluminium or aluminium alloys which is physically<br />
identifiable as part of a scrap consignment. Foreign material can be<br />
attached to pieces of scrap or separate. Examples of <strong>for</strong>eign material are<br />
p owder, water, oil or o<strong>the</strong>r fluids, grease, wood, plastic, glass, stones,<br />
paper, sand, non-aluminium metals, dry paints, inks, lacquers, rubber, dirt.<br />
shredding reduction of <strong>the</strong> size of pieces of scrap, end-of-life products or compacted<br />
scrap into small pieces, by operations such as crushing or tearing<br />
sorting separation of different fractions of loose scrap, manually or by o<strong>the</strong>r<br />
methods<br />
sink and float processes where materials with different densities are separated through air<br />
flotation or heavy media systems<br />
casting alloys A luminium alloys used <strong>for</strong> <strong>the</strong> production of castings where <strong>the</strong> final<br />
product shape<br />
is generated by pouring molten metal into a mould. These aluminium<br />
a lloys have an alloy concentration of up to 20% , mostly silicon,<br />
magnesium and copper. Typical castings are cylinder heads, engine blocks<br />
and gearboxes in cars, components used in <strong>the</strong> mechanical and electrical<br />
engineering industries, components <strong>for</strong> household equipment and many<br />
o<strong>the</strong>r applications.<br />
deoxidation <strong>Aluminium</strong> consisting of alloys with a high concentration of metallic<br />
aluminium aluminium (usually exceeding 95%) used to remove free oxygen from<br />
liquid steel.<br />
foundry Main customers of refiners. They produce a wide variety of castings which<br />
industry<br />
are mostly<br />
used in <strong>the</strong> transport sector.<br />
Refiner Producer of casting alloys and deoxidation aluminium from scrap of<br />
varying composition. Refiners are able to add alloying elements and<br />
remove certain unwanted elements after <strong>the</strong> melting process.<br />
Remelter Producer of wrought alloys in <strong>the</strong> <strong>for</strong>m of extrusion billets and rolling<br />
Page 67 of 72
Salt slag<br />
Wrought alloys<br />
Recycled<br />
aluminium<br />
Recycling<br />
Recycling rates<br />
slabs from mainly clean and sorted wrought alloy scrap.<br />
By-product that arises when salt (mixture of sodium and potassium<br />
chloride) is used to cover <strong>the</strong> molten metal to prevent oxidation, increase<br />
yield and enhance <strong>the</strong>rmal efficiency in <strong>the</strong> furnace.<br />
<strong>Aluminium</strong> alloys used <strong>for</strong> wrought products where <strong>the</strong> final product shape<br />
is generated by mechanically <strong>for</strong>ming <strong>the</strong> solid metal. These aluminium<br />
alloys have an alloy concentration comprised between 1 and 10%, mostly<br />
manganese, magnesium, silicon, copper and zinc. Typical wrought alloy<br />
products are semi-fabricated items in <strong>the</strong> <strong>for</strong>m of rolled sheets, foil or<br />
extruded profiles, which are processed into car body parts, heavy goods<br />
vehicle and commercial vehicle components, rail vehicles, building panels,<br />
doors, windows, packaging, and so on.<br />
<strong>Aluminium</strong> ingot obtained from scrap is now refereed to as<br />
recycling aluminium.<br />
<strong>Aluminium</strong> collection and subsequent treatment and melting of scrap.<br />
Per<strong>for</strong>mance indicators of global recycling per<strong>for</strong>mance are as follows:<br />
Recycling input rate: Recycled aluminium produced from traded new scrap<br />
and old scrap as a percentage of total aluminium (primary and recycled<br />
sources) supplied to fabricators.<br />
Overall recycling efficiency rate: Recycled aluminium produced from<br />
traded new scrap and old scrap as a percentage of aluminium available<br />
from new and old scrap sources.<br />
End-of-life recycling efficiency rate: Recycled aluminium produced from<br />
old scrap as a percentage of aluminium available from old scrap sources.<br />
The end-of-life collection rate: <strong>Aluminium</strong> collected from old scrap as a<br />
percentage of aluminium available <strong>for</strong> collection from old scrap sources.<br />
The end-of-life processing rate: Recycled aluminium produced from old<br />
scrap as a percentage of aluminium collected from old scrap sources.<br />
Page 68 of 72
9. References<br />
[1] Ecological <strong>Profile</strong> <strong>Report</strong> <strong>for</strong> <strong>the</strong> <strong>European</strong> <strong>Aluminium</strong> <strong>Industry</strong> - reference years 1994 and 1992,<br />
<strong>European</strong> <strong>Aluminium</strong> Association, 1996.<br />
[2] <strong>Environmental</strong><br />
<strong>Profile</strong> <strong>Report</strong> <strong>for</strong> <strong>the</strong> <strong>European</strong> <strong>Aluminium</strong> <strong>Industry</strong>, reference year 1998,<br />
<strong>European</strong> <strong>Aluminium</strong> Association, April 2000.<br />
[3] The 2 updates of <strong>the</strong> <strong>Environmental</strong> <strong>Profile</strong> <strong>Report</strong> <strong>for</strong> <strong>the</strong> <strong>European</strong> <strong>Aluminium</strong> <strong>Industry</strong> - year<br />
2002, <strong>European</strong> <strong>Aluminium</strong> Association, Septembre 2005<br />
[4] Life Cycle Assessment of <strong>Aluminium</strong>: Inventory Data <strong>for</strong> <strong>the</strong> primary <strong>Aluminium</strong> <strong>Industry</strong> – Year<br />
2000, International <strong>Aluminium</strong> Institute, March 2003<br />
[5] Life Cycle Assessment of <strong>Aluminium</strong>: Inventory Data <strong>for</strong> <strong>the</strong> primary <strong>Aluminium</strong> <strong>Industry</strong> – Year<br />
2005 Update, International <strong>Aluminium</strong> Institute, September 2007<br />
[6] U.M.J. Boin, M. Bertram, “Melting Standardized Aluminum Scrap: A mass Balance Model <strong>for</strong><br />
Europe”, Journal of metals, August 2005, pp 26-33.<br />
[7] <strong>Aluminium</strong> Recycling, The Road to High Quality Products, <strong>European</strong> <strong>Aluminium</strong> Association,<br />
2004, www. aluminium.org<br />
[8] ISO 14040:2006 <strong>Environmental</strong> Management - Life Cycle Assessment – Principles and framework<br />
[9] ISO 14044:2006 <strong>Environmental</strong> Management – Life Cycle Assessment – Requirements and<br />
guidelines<br />
[10] EN 13920: <strong>Aluminium</strong> and aluminium alloys - Scrap - Scrap consisting of one single wrought<br />
alloy, 2003<br />
[11] BUWAL 1998: Habersatter, K.; Fecker, I.; Dall`Aqua, S.; Fawer, M.; Fallscher, F.; Förster, R.;<br />
Maillefer, C.; Ménard, M.; Reusser, L.; Som, C.; Stahel, U.; Zimmermann, P.: Ökoinventare für<br />
Verpackungen. ETH Zürich and EMPA St. Gallen <strong>for</strong> BUWAL and SVI, Bern. In: Bundesamt für<br />
Umwelt, Wald und Landschaft (Hrsg.): Schriftenreihe Umwelt Nr. 250/Vol.I and II. 2nd. enlarged and<br />
updated edition, Ber n 1998 (<strong>Environmental</strong> Series N°250/II Life Cycle Inventories <strong>for</strong> Packaging, Vol.<br />
II, Swiss Agency <strong>for</strong> <strong>the</strong> Environment, Forest and Landscape, 1998)<br />
[12] EN 12258-3:2003 <strong>Aluminium</strong> and aluminium alloys. Terms and definitions. Scrap<br />
[13] GABI 2006, GaBi 4: Software and Database <strong>for</strong> Life Cycle Assessment. LBP, University of<br />
Stuttgart and PE International GmbH, Leinfelden-Echterdingen, 2006, http://www.gabi-software.com<br />
[14] ELCD <strong>European</strong> Reference Life Cycle Data System (ELCD), v 1.0.1. 2006,<br />
h ttp://lca.jrc.ec.europa.eu/lcainfohub/datasetArea.vm<br />
[15] <strong>Aluminium</strong> Handbook, Vol.1 Fundamentals and materials, Edited by Dr-Ing. Catrin Kammer,<br />
<strong>Aluminium</strong>-Verlag, 1999<br />
[16] Handbook of <strong>Aluminium</strong> Recycling, Ch. Schmitz, Vulkan-Verlag, 2006<br />
[17] Declaration by <strong>the</strong> Metals <strong>Industry</strong> on Recycling Principles. Int. J. LCA 12 (1) 59-60. Electronic<br />
publication November 30, 2006 DOI: http://dx.doi.org/10.1065/lca2006.11.283<br />
[18] International Energy Agency, www.iea.org/Textbase/stats/prodresult.aspPRODUCT=Electricity/Heat<br />
10. List of figures<br />
Fig. 1.1 Simplified life cycle material flow chart of an aluminium product .................5<br />
Fig. 2.1 System boundaries of <strong>the</strong> various LCI datasets................................................8<br />
Fig. 2.2 Inclusion of supplementary processes ............................................................12<br />
Fig. 2.3 Use of background LCI data related to fuel supply systems and combustion<br />
(Background GaBi LCI data in blue)...................................................................13<br />
Fig. 2.4 EU25 Power grid mix <strong>for</strong> electricity production used in <strong>the</strong> LCI modelling<br />
(except <strong>for</strong> primary aluminium production) © PE International – GaBi database,<br />
reference year 2002..............................................................................................14<br />
Fig. 2.5 Sea transport modelling of bauxite and alumina ............................................15<br />
Fig.3.1 Alumina production process............................................................................19<br />
Fig. 3.2 aluminium electrolytic cell – prebake technology..........................................21<br />
Fig. 3.3 DC-cast extrusion billets (cylindrical) or rolling slabs (rectangular) .............22<br />
Fig. 3.4 Main raw material inputs <strong>for</strong> primary aluminium production in Europe. ......31<br />
Fig. 3.5 EAA model of electricity production <strong>for</strong> <strong>the</strong> <strong>European</strong> primary aluminium<br />
considering <strong>the</strong> aluminium imports .....................................................................34<br />
Fig. 4.1 Main process steps in aluminium sheet production........................................39<br />
Page 69 of 72
Fig. 4.2 Flow diagram <strong>for</strong> aluminium sheet production ..............................................40<br />
Fig. 5.1 Flow diagram <strong>for</strong> aluminium foil production.................................................43<br />
Fig. 6.1 Extrusion process principle and some aluminium extruded products ............46<br />
Fig. 6.2 Flow diagram <strong>for</strong> aluminium extrusion production........................................47<br />
Fig. 7.1 Simplified material flow diagram of <strong>the</strong> recycling model..............................61<br />
11. List of tables<br />
Table 2.1 Main energy sources <strong>for</strong> <strong>the</strong> UCPTE and EU-25 electricity models...........14<br />
Table 2.2 Transport models <strong>for</strong> bauxite and alumina ..................................................15<br />
Table 2.3 Pre-defined set of environmental impact categories................................... .16<br />
Table 2.4 Brief description of <strong>the</strong> pre-selected environmental impact categories.......16<br />
Table 2.5 Main differences between LCI modelling approaches of 1998 and 2005 ... 18<br />
Table 3.1 <strong>European</strong> representativity of <strong>the</strong> primary data.............................................22<br />
Table 3.2 Direct input and output data <strong>for</strong> <strong>the</strong> extraction and preparation of 1 tonne of<br />
bauxite..................................................................................................................23<br />
Table 3.3 Direct inputs and outputs data <strong>for</strong> <strong>the</strong> production of 1 tonne of alumina .... 24<br />
Table 3.4 Direct inputs and outputs data <strong>for</strong> <strong>the</strong> production of 1 tonne of carbon paste<br />
(10%) and anode (90%) .......................................................................................25<br />
Table 3.5 Direct inputs and outputs <strong>for</strong> <strong>the</strong> production of 1 tonne of liquid aluminium<br />
at <strong>the</strong> electrolysis step (smelter)...........................................................................27<br />
Table 3.6 Direct inputs and outputs <strong>for</strong> <strong>the</strong> production of 1 tonne of sawn aluminium<br />
ingot at <strong>the</strong> cast house................................................. .........................................29<br />
Table 3.7 Main raw materials <strong>for</strong> <strong>the</strong> production of 1 tonne of primary ingot. ...........31<br />
Table 3.8 Geographical distribution of <strong>the</strong> primary aluminium imports into Europe –<br />
average on years 2003 – 2006 (source Eurostat) .................................................33<br />
Table 3.9 Energy sources <strong>for</strong> <strong>the</strong> electricity used <strong>for</strong> <strong>the</strong> production of imported<br />
primary aluminium............................................................................................... 34<br />
Table 3.10 Distribution of <strong>the</strong> energy sources <strong>for</strong> <strong>the</strong> EAA electricity model ............34<br />
Table 3.11 Energy resources, air and GHG emissions <strong>for</strong> <strong>the</strong> electricity consumed by<br />
<strong>the</strong> electrolysis step <strong>for</strong> 1 tonne of primary aluminium according to <strong>the</strong> EAA<br />
model....................................................................................................................35<br />
Table 3.12 Main LCI data <strong>for</strong> <strong>the</strong> production of 1 tonne of primary aluminium used in<br />
Europe – data of <strong>the</strong> year 2005, 2002 and 1998. .................................................37<br />
Table 3.13 Main environmental indicators <strong>for</strong> <strong>the</strong> production of 1 tonne of sawn<br />
primary aluminium ingot used in Europe. ...........................................................38<br />
Table 4.1 EAA survey coverage <strong>for</strong> <strong>European</strong> rolling mills .......................................39<br />
Table 4.2 Direct inputs and outputs <strong>for</strong> <strong>the</strong> sheet production and <strong>the</strong> corresponding<br />
scrap remelting – Figures normalised to 1000 kg of finished sheet. ...................41<br />
Table 4.3 Main LCI data <strong>for</strong> <strong>the</strong> production of 1 tonne of aluminium sheet from <strong>the</strong><br />
rolling ingot.......................................................................................................... 42<br />
Tabl e 4.4 <strong>Environmental</strong> indicators <strong>for</strong> <strong>the</strong> sheet production......................................42<br />
Table 5.1 Survey coverage <strong>for</strong> <strong>European</strong> foil production............................................43<br />
Table 5.2 Direct inputs and outputs <strong>for</strong> <strong>the</strong> foil production and <strong>the</strong> corresponding<br />
scrap recycling – Figures normalised to 1000 kg of finished foil........................44<br />
Table 5.3 Main LCI data <strong>for</strong> <strong>the</strong> production of 1 tonne of aluminium foil from an<br />
ingot .....................................................................................................................45<br />
Table 5.4 <strong>Environmental</strong> indicators <strong>for</strong> <strong>the</strong> production of 1 tonne of aluminium foil<br />
from an ingot........................................................................................................ 45<br />
Table 6.1 Survey coverage <strong>for</strong> aluminium extrusion...................................................46<br />
Table 6.2 General data about extrusion alloys and product types ...............................47<br />
Page 70 of 72
Table 6.3 Direct inputs and outputs <strong>for</strong> extrusion and <strong>the</strong> corresponding scrap<br />
recycling – Figures normalised to 1000 kg of finished extruded product. ..........48<br />
Table 6.4 Main LCI data <strong>for</strong> <strong>the</strong> production of 1 tonne of aluminium extrusion from<br />
an ingot.................................................................................................................49<br />
Table 6.5 <strong>Environmental</strong> indicators <strong>for</strong> <strong>the</strong> production of 1 tonne of aluminium<br />
extrusion from an ingot........................................................................................49<br />
Table 7.1 Furnace types and specificities <strong>for</strong> aluminium recycling. ...........................52<br />
Table 7.2 <strong>European</strong> scrap mass balance <strong>for</strong> <strong>the</strong> year 2005 expressed in kt (flows in<br />
yellow are part of model 2 “recycling scrap”) .....................................................54<br />
Table 7.3 Direct inputs and outputs <strong>for</strong> <strong>the</strong> production of 1 tonne of ingot from clean<br />
process scrap (data <strong>for</strong> model 1) – consolidated data <strong>for</strong> <strong>the</strong> years 2005, 2002 &<br />
1998......................................................................................................................55<br />
Table 7.4 Main LCI data <strong>for</strong> <strong>the</strong> production of 1 tonne of aluminium ingot from<br />
process scrap ........................................................................................................56<br />
Table 7.5 <strong>Environmental</strong> indicators <strong>for</strong> <strong>the</strong> production of 1 tonne of aluminium ingot<br />
from process scrap ...............................................................................................56<br />
Table 7.6 <strong>European</strong> scrap mass flow used <strong>for</strong> <strong>the</strong> recycling model (model 2) in kt....57<br />
Table 7.7 <strong>European</strong> scrap mass flow used <strong>for</strong> <strong>the</strong> recycling model in % ....................57<br />
Table 7.8 Main scrap preparation processes according to scrap type..........................58<br />
Table 7.9 Main scrap preparation processes and corresponding scrap mass flow<br />
fraction entering <strong>the</strong> process. ...............................................................................58<br />
Table 7.10 Consolidated inputs and outputs <strong>for</strong> <strong>the</strong> scrap preparation........................59<br />
Table 7.11 data representativity <strong>for</strong> aluminium recycling processes (refiners)...........60<br />
Table 7.12 Direct inputs and outputs <strong>for</strong> <strong>the</strong> scrap refining process (combination of<br />
64% rotary furnace and 36% reverbatory) - Figures <strong>for</strong> 1 tonne of ingot ...........60<br />
Table 7.13 Main LCI data <strong>for</strong> aluminium recycling per tonne of recycled ingot........62<br />
Table 7.14 <strong>Environmental</strong> Indicators <strong>for</strong> aluminium recycling per tonne of recycled<br />
ingot – year 2005 .................................................................................................63<br />
Table 7.15 Metal losses during refining <strong>for</strong> various old scrap categories [6]..............63<br />
Page 71 of 72
12. <strong>Report</strong> from <strong>the</strong> independent reviewer<br />
Page 72 of 72
<strong>Environmental</strong> <strong>Profile</strong> <strong>Report</strong> <strong>for</strong> <strong>the</strong> <strong>European</strong> <strong>Aluminium</strong> <strong>Industry</strong><br />
<strong>Environmental</strong> <strong>Profile</strong> <strong>Report</strong> <strong>for</strong> <strong>the</strong> <strong>European</strong><br />
<strong>Aluminium</strong> <strong>Industry</strong><br />
Life Cycle Inventory data <strong>for</strong> aluminium production and<br />
trans<strong>for</strong>mation processes in Europe<br />
Critical Review <strong>Report</strong><br />
by<br />
Walter Klöpffer<br />
April 2008<br />
Critical Review by Prof. Dr. Walter Klöpffer Page 1 of 12
<strong>Environmental</strong> <strong>Profile</strong> <strong>Report</strong> <strong>for</strong> <strong>the</strong> <strong>European</strong> <strong>Aluminium</strong> <strong>Industry</strong><br />
1 Introduction<br />
1.1 <strong>Aluminium</strong> and <strong>the</strong> environmental pillar of sustainability<br />
<strong>Aluminium</strong> belongs to those materials which have been critically discussed <strong>for</strong> decades,<br />
mainly due to <strong>the</strong> high amount of energy needed to reduce alumina (Al 2 O 3 ) to Al. There are<br />
o<strong>the</strong>r, minor but not negligible, environmental aspects of <strong>the</strong> aluminium life cycle, as bauxite<br />
mining and <strong>the</strong> emission of perfluorinated alkanes (CF 4 , C 2 F 6 ). The duty of Life Cycle<br />
Assessment (LCA) consists in considering quantitatively all important environmental aspects<br />
in <strong>the</strong> life cycle of products (goods and services). Materials, as Al, contribute significantly to<br />
<strong>the</strong> total environmental behaviour of products, but do not necessarily determine it. Making use<br />
of <strong>the</strong> properties of Al, as low density (light weight products), longevity and recyclability can<br />
lead to excellent life cycle behaviour, but only if used properly. In order to calculate <strong>the</strong> Life<br />
Cycle Inventories (LCIs) of Al-containing products, reliable data are needed – as presented in<br />
<strong>the</strong> report reviewed here <strong>for</strong> <strong>European</strong> conditions.<br />
There is a second aspect of growing importance: <strong>the</strong> environmental behaviour of a product,<br />
process or material is only part of its sustainability which is <strong>the</strong> ultimate aim of any<br />
responsible product development. Certainly, a quantitative assessment of sustainability has to<br />
follow <strong>the</strong> life cycle concept in which <strong>the</strong> already standardized LCA will play a leading role<br />
(Life Cycle Sustainability Assessment of Products – LCSA [1]). Life Cycle Costing (LCC),<br />
<strong>the</strong> quantification of <strong>the</strong> second, economic, pillar, is available as a draft SETAC guideline [2].<br />
The third one – Societal Life Cycle Assessment (SLCA) is still under development, but<br />
progressing rapidly [3,4]. Thus, <strong>the</strong> contribution of a material to sustainability will not only<br />
depend on its environmental life cycle per<strong>for</strong>mance, as quantified by LCI/LCA, but also on<br />
economic and social aspects to be evaluated in a life cycle perspective. As a caveat it should<br />
be mentioned that <strong>the</strong>re will be no compensation between <strong>the</strong> three pillars: even an excellent<br />
economic per<strong>for</strong>mance cannot outweigh poor environmental and societal per<strong>for</strong>mance.<br />
1.2 The role of EAA<br />
The <strong>European</strong> <strong>Aluminium</strong> Association has recognised <strong>the</strong> needs of LCA practitioners and<br />
product designers early in <strong>the</strong> development of standardized LCAs. The first data collection,<br />
comprising <strong>the</strong> reference years 1991/92 (and 1994) appeared in 1996. This first report was<br />
Critical Review by Prof. Dr. Walter Klöpffer Page 2 of 12
<strong>Environmental</strong> <strong>Profile</strong> <strong>Report</strong> <strong>for</strong> <strong>the</strong> <strong>European</strong> <strong>Aluminium</strong> <strong>Industry</strong><br />
followed by a second one in 2000, reference year 1998 [5] and by an update report in 2005,<br />
reference year 2002 [6]. The present report is thus <strong>the</strong> fourth one.<br />
The data collected and updated were offered to and accepted by <strong>the</strong> LCA community,<br />
including <strong>the</strong> software producers. Generic (or background) data are perfectly suited <strong>for</strong><br />
commodities to be used in end product LCAs when <strong>the</strong> exact origin of <strong>the</strong> material(s) used in<br />
a specific product is not known, but only <strong>the</strong> region, in this case Europe. The present data set<br />
will be included into <strong>the</strong> <strong>European</strong> (EU) LCA databank and foster <strong>the</strong> (already strong)<br />
<strong>European</strong> position in generic data collection and provision.<br />
1.3 The critical review, scope and course of action<br />
The review procedure started with a kick-off meeting March 7, 2007 in Brussels, as all <strong>the</strong><br />
following meetings. It was agreed upon that <strong>the</strong> review will be per<strong>for</strong>med as a critical review<br />
according to <strong>the</strong> revised ISO standards14040 [7] and 14044 [8]. In <strong>the</strong>se standards, LCIstudies,<br />
consisting of a Goal & Scope chapter, Life Cycle Inventory and Interpretation are<br />
included and can be accepted under <strong>the</strong> provision that such studies are not called LCA. They<br />
are distinguished from a full LCA-study mainly by <strong>the</strong> absence of <strong>the</strong> phase Life Cycle<br />
Impact Assessment (LCIA). Clearly, in <strong>the</strong> present study <strong>the</strong>re are fur<strong>the</strong>r restrictions, since<br />
<strong>the</strong> manufacture of <strong>the</strong> final products and <strong>the</strong> use phases had to be left out <strong>for</strong> obvious<br />
reasons. The o<strong>the</strong>r important life cycle stages of Al (mining, alumina production, primary<br />
aluminium by electrolysis, melting and remelting, as well as recycling) are treated and<br />
toge<strong>the</strong>r can be considered as a truncated LCI.<br />
The review was conceived as a review by an independent external reviewer according to ISO<br />
14044, section 6.2. A more demanding review according to <strong>the</strong> panel method (14044, section<br />
6.3) was not deemed necessary, since no comparative assertions can be derived from <strong>the</strong> data<br />
collected.<br />
The meetings 2 to 6 dealt with <strong>the</strong> data collection results of <strong>the</strong> life cycle stages mentioned<br />
above:<br />
Critical Review by Prof. Dr. Walter Klöpffer Page 3 of 12
<strong>Environmental</strong> <strong>Profile</strong> <strong>Report</strong> <strong>for</strong> <strong>the</strong> <strong>European</strong> <strong>Aluminium</strong> <strong>Industry</strong><br />
April 17, 2007: EAA LCI Data Management Task Force meeting. Main topic: LCI data<br />
reviewing. Draft report on alumina and primary aluminium <strong>for</strong> 2005. Introduction of <strong>the</strong> GaBi<br />
Software into LCI modelling, including data <strong>for</strong> ancillary processes.<br />
September 29, 2007: Primary aluminium production, data collection and consolidation;<br />
presentation of a suitable energy model.<br />
November 13, 2007: EAA LCI Data Management Task Force meeting. Internal<br />
environmental reports on Sheet and associated cast house (10/2007) and Extrusion and<br />
associated cast house (11/2007); LCI data sets <strong>for</strong> external electricity models, sheet<br />
production, foil production and extrusion (including GaBi modules)<br />
January 23, 2008: EAA LCI Data Reviewing meeting. Presentation of LCI datasets and<br />
associated modelling; presentation of <strong>the</strong> draft goal & scope chapter.<br />
March 7, 2008: Discussion of aluminium recycling in Europe with Marlen Bertram,<br />
International <strong>Aluminium</strong> Institute (IAI), London [9,10].<br />
The final (7th) meeting took place April 17, 2008. Main topic: Discussion of <strong>the</strong> draft final<br />
report [11] and comments made by <strong>the</strong> reviewer with Christian Leroy and Bernard de Gélas.<br />
A time schedule <strong>for</strong> <strong>the</strong> last steps has been adopted.<br />
The updated final report was submitted via email April 25, 2008. The review below refers to<br />
this version.<br />
2 About this <strong>Environmental</strong> <strong>Profile</strong> <strong>Report</strong><br />
2.1 General<br />
The first impression of <strong>the</strong> report is that it is well structured and written. The report stays in<br />
<strong>the</strong> tradition of <strong>the</strong> <strong>for</strong>mer reports, but offers new aspects. The main change refers to <strong>the</strong> use<br />
of new software <strong>for</strong> data handling (GaBi 4.0 replacing LCA-2 using BUWAL data), including<br />
generic data <strong>for</strong> ancillary processes and inputs <strong>for</strong> <strong>the</strong> energy model. The LCI results can<br />
<strong>the</strong>re<strong>for</strong>e not exactly be compared with <strong>the</strong> data of <strong>the</strong> previous reports. There is no break,<br />
however, so that trends can be observed and discussed with some precaution. The main trend<br />
Critical Review by Prof. Dr. Walter Klöpffer Page 4 of 12
<strong>Environmental</strong> <strong>Profile</strong> <strong>Report</strong> <strong>for</strong> <strong>the</strong> <strong>European</strong> <strong>Aluminium</strong> <strong>Industry</strong><br />
with respect to energy and emissions is one of slow but steady improvement. A main<br />
methodological improvement with regard to <strong>the</strong> <strong>for</strong>mer projects is <strong>the</strong> new energy model,<br />
especially with regard to imported primary aluminium (36%).<br />
The LCI is presented in <strong>the</strong> <strong>for</strong>m of building blocs corresponding to <strong>the</strong> stages of <strong>the</strong> life cycle<br />
in a logical order (see section 2.2). It is worth mentioning that <strong>the</strong> LCI study is more than a<br />
“cradle-to-factory gate” study, as most generic data sets, but comprises <strong>the</strong> most important<br />
end-of-life phase, recycling. This phase is of outmost importance <strong>for</strong> <strong>the</strong> Al life cycle, since<br />
only a very efficient recycling can reduce <strong>the</strong> <strong>the</strong>rmodynamically caused high energy demand<br />
of aluminium.<br />
The coverage is excellent <strong>for</strong> <strong>the</strong> large industrial installations (e.g. primary aluminium<br />
production) and, as to be expected, less so if small companies dominate (as in recycling). Data<br />
consolidation plays a major role in raw data treatment and has been solved in a convincing<br />
manner. The geographical coverage includes EU 27 + Norway, Iceland and Switzerland. Due<br />
to <strong>the</strong> inclusion of Al-imports, <strong>the</strong> actual geographical system boundary is much larger, or<br />
even global if <strong>the</strong> mining and alumina production is considered.<br />
Life Cycle Impact Assessment indicator results are included in this report which do not<br />
belong to LCI data sets. It is stated, however, that <strong>the</strong>se results are shown <strong>for</strong> purely<br />
in<strong>for</strong>mative purposes, not to be used <strong>for</strong> comparisons. Only <strong>the</strong> Cumulative Energy Demand<br />
(CED) can be considered as belonging to LCI, as a - very useful - relict of “proto-LCA” [12]<br />
inventory aggregation. It gives additional in<strong>for</strong>mation compared to o<strong>the</strong>r energy-related<br />
impact categories as Climate change and depletion of fossil energy resources and encourages<br />
energy saving independent of its origin [13,14].<br />
2.2 Details<br />
The report is structured in a logical way, starting with a description of <strong>the</strong> aluminium life<br />
cycle (1), a project description (Goal & Scope) (2), primary Al production including <strong>the</strong><br />
bauxite mining, alumina production and electrolysis with electricity model (3), sheet<br />
production (4), foil production (5), extrusion (6) and Al recycling (7). Chapters 3 to 7<br />
constitute <strong>the</strong> truncated Life Cycle Inventory (LCI). It should be mentioned that <strong>the</strong>re is no<br />
full LCI (and, hence, no full LCA) of any commodity, since <strong>for</strong> doing so all uses would have<br />
Critical Review by Prof. Dr. Walter Klöpffer Page 5 of 12
<strong>Environmental</strong> <strong>Profile</strong> <strong>Report</strong> <strong>for</strong> <strong>the</strong> <strong>European</strong> <strong>Aluminium</strong> <strong>Industry</strong><br />
to be modelled: an evidently impossible task. What is presented in <strong>the</strong>se chapters are <strong>the</strong> data<br />
and sub-system descriptions including flow charts, tables and figures to help <strong>the</strong> reader<br />
through <strong>the</strong> masses of in<strong>for</strong>mation. A separate chapter “Interpretation”, as requested by ISO<br />
14040 [5], is missing, but relevant in<strong>for</strong>mation about data quality can be found throughout <strong>the</strong><br />
report in <strong>the</strong> relevant chapters. No undue conclusions and comparisons are drawn from <strong>the</strong><br />
results and, thus, <strong>the</strong> <strong>for</strong>mal deviation from <strong>the</strong> standard is only mentioned but not criticised<br />
here.<br />
The recommendation of <strong>the</strong> allocation procedure supported by <strong>the</strong> metal industry (against <strong>the</strong><br />
“recycled content approach”) [15] in <strong>the</strong> Preface is understandable from EAA´s point of view<br />
but in no way binding <strong>for</strong> <strong>the</strong> data users: <strong>the</strong> kind of allocation used depends on <strong>the</strong> Goal &<br />
scope in each individual LCA according to ISO 14040/44.<br />
The horizontal aggregation procedure used <strong>for</strong> calculating <strong>the</strong> <strong>European</strong> averages (2.3) is<br />
laudable, since it facilitates <strong>the</strong> modular approach of LCI/LCA <strong>for</strong> <strong>the</strong> users.<br />
There was some discussion about <strong>the</strong> term „waste“, as used in Fig. 2.2 where it is put outside<br />
<strong>the</strong> system boundary toge<strong>the</strong>r with <strong>the</strong> emissions. In <strong>the</strong> reviewer´s opinion <strong>the</strong>re are at least<br />
three types of waste:<br />
1. waste to be reused or recycled: stays within <strong>the</strong> technosphere and, thus within <strong>the</strong><br />
system boundaries of a typical LCA<br />
2. waste to be collected and removed legally by incineration, controlled landfilling or<br />
composting: stays within <strong>the</strong> technosphere, too; only <strong>the</strong> emissions of <strong>the</strong> waste<br />
removal processes (CO 2 , CH 4 , organic contaminants to ground water, leached metal<br />
ions to ground water etc.) escape into <strong>the</strong> environment if not collected<br />
3. waste thrown away, e.g. by littering, illegal dumping, burning etc.: ends up in <strong>the</strong><br />
environment if not collected.<br />
There was a time when solid waste in LCA (if landfilled) was considered as an “emission into<br />
soil”. This is only true <strong>for</strong> illegal, uncontrolled land filling. Controlled landfilling is a kind of<br />
factory and belongs to <strong>the</strong> technosphere as long as it is controlled. EAA intends to include<br />
appropriate data in future updates (incineration is already included).<br />
LCI data <strong>for</strong> bauxite mining were taken from IAI and do not contain in<strong>for</strong>mation about land<br />
occupation (area x time), a minimum inventory input requirement <strong>for</strong> land use impact<br />
Critical Review by Prof. Dr. Walter Klöpffer Page 6 of 12
<strong>Environmental</strong> <strong>Profile</strong> <strong>Report</strong> <strong>for</strong> <strong>the</strong> <strong>European</strong> <strong>Aluminium</strong> <strong>Industry</strong><br />
assessment in LCA. EAA intends to complement <strong>the</strong> data set in <strong>the</strong> next round, although it<br />
seems difficult to obtain reliable data on land occupation during mining. Since bauxite occurs<br />
in relatively thin layers which are peeled of mechanically, large areas of land are deprived of<br />
<strong>the</strong> soil cover and recultivated later. The importance of “land use” as an impact category has<br />
increased in recent years, partly as a proxy <strong>for</strong> biodiversity [16]. In connection with land use,<br />
also <strong>the</strong> “overburden” will be addressed; this not a major problem in bauxite mining, but<br />
relevant <strong>for</strong> recultivation.<br />
The use of heavy oil (high sulphur content) reported to be used <strong>for</strong> alumina production,<br />
although reduced in recent years, is certainly an area <strong>for</strong> improving <strong>the</strong> environmental<br />
per<strong>for</strong>mance of <strong>the</strong> Al-system. As in <strong>the</strong> case of sea transport, <strong>the</strong> use of heavy oil is<br />
intolerable.<br />
The change in power grid from UCPTE to <strong>the</strong> EU-25 grid mix due to <strong>the</strong> geographical<br />
extension and <strong>the</strong> software change should have been secured by a sensitivity analysis <strong>for</strong><br />
which <strong>the</strong>re was not enough time. Some changes are discussed in <strong>the</strong> text, however.<br />
<strong>Report</strong>ing of PAH and BaP data from smelters is laudable. Toxic emissions are sometimes<br />
“<strong>for</strong>gotten” by generic data providers. Polyfluorinated compounds are included as important<br />
GHG emissions of <strong>the</strong> smelters; <strong>the</strong>y have been reduced in recent years, but not yet fully.<br />
“More than half of all <strong>the</strong> aluminium currently produced in <strong>the</strong> <strong>European</strong> Union (EU-27)<br />
originates from recycled raw materials and that trend is on <strong>the</strong> increase.” This message in<br />
Chapter 7 is really good news, especially since in a growing market, considering <strong>the</strong> use of Al<br />
in many long-lived product, 100% cannot be reached. As stated correctly, <strong>the</strong>re is still enough<br />
opportunity to improve and thus decrease <strong>the</strong> overall energy demand. The Al-scrap remelting<br />
industry is fragmented, despite a consolidation leading to larger units, and data acquisition is<br />
not easy. The results obtained in co-operation with OEA (Organisation of <strong>European</strong><br />
<strong>Aluminium</strong> Refiners and Remelters) are never<strong>the</strong>less trustworthy and rely on a robust Alrecycling<br />
Material Flow Analysis (MFA) published recently [9].<br />
The co-operation with <strong>the</strong> <strong>European</strong> Reference Life Cycle Data System already resulted in<br />
two generic LCI datasets (aluminium sheet and profile) which are publicly available free of<br />
charge [17].<br />
Critical Review by Prof. Dr. Walter Klöpffer Page 7 of 12
<strong>Environmental</strong> <strong>Profile</strong> <strong>Report</strong> <strong>for</strong> <strong>the</strong> <strong>European</strong> <strong>Aluminium</strong> <strong>Industry</strong><br />
2.3 Additional in<strong>for</strong>mation<br />
Whereas this report will be available as a freely downloadable PDF document with broad<br />
distribution, <strong>the</strong> full LCI datasets are available on request at lci@eaa.be.<br />
This in<strong>for</strong>mation has been supplied in <strong>the</strong> <strong>for</strong>m of six excel data files. These files comprise:<br />
• Primary aluminium 2005<br />
• <strong>Aluminium</strong> sheet 2005<br />
• Remelting & casting of clean aluminium scrap<br />
• <strong>Aluminium</strong> recycling 2005<br />
• <strong>Aluminium</strong> foil 2005<br />
• <strong>Aluminium</strong> extrusion 2005<br />
These files were supplied in addition to <strong>the</strong> draft LCI reports. They will be indispensable <strong>for</strong><br />
software suppliers <strong>for</strong> updating <strong>the</strong> data bases.<br />
3 Confirmation by <strong>the</strong> reviewer<br />
According to ISO 14040 [7]<br />
"The critical review process shall ensure that:<br />
• <strong>the</strong> methods used to carry out <strong>the</strong> LCA are consistent with <strong>the</strong> international<br />
Standard;<br />
• <strong>the</strong> methods used to carry out <strong>the</strong> LCA are scientifically and technically<br />
valid,<br />
• <strong>the</strong> data used are appropriate and reasonable in relation to <strong>the</strong> goal of <strong>the</strong><br />
study;<br />
• <strong>the</strong> interpretations reflect <strong>the</strong> limitations identified and <strong>the</strong> goal of <strong>the</strong> study;<br />
• <strong>the</strong> study report is transparent and consistent."<br />
These five points can be confirmed with a few restrictions discussed in <strong>the</strong> previous sections.<br />
With regard to <strong>the</strong> first item, consistency with ISO 14040/44, <strong>the</strong>re is a <strong>for</strong>mal lack of a<br />
Critical Review by Prof. Dr. Walter Klöpffer Page 8 of 12
<strong>Environmental</strong> <strong>Profile</strong> <strong>Report</strong> <strong>for</strong> <strong>the</strong> <strong>European</strong> <strong>Aluminium</strong> <strong>Industry</strong><br />
section “interpretation” indicated above. It has also been discussed above that <strong>the</strong> study is not<br />
a full LCA, but <strong>the</strong> standard allows <strong>for</strong> LCI-studies. As such, <strong>the</strong> study is con<strong>for</strong>m with ISO.<br />
The methods used in data collection and modelling are described clearly and correspond to<br />
<strong>the</strong> state of <strong>the</strong> art. They should be published and become standard <strong>for</strong> generic data collection.<br />
The third item (data) is <strong>the</strong> heart of <strong>the</strong> study. The data used in addition to <strong>the</strong> original data<br />
stem from one of <strong>the</strong> leading software systems. Additional data not shown in this report are<br />
made available to interested persons.<br />
The interpretation is in accordance with <strong>the</strong> restricted scope and refers to <strong>the</strong> representativity<br />
and quality of <strong>the</strong> original data. Although not statistically analysed, <strong>the</strong> user can be sure to<br />
have <strong>the</strong> best possible dataset <strong>for</strong> Al in Europe. In <strong>the</strong> future <strong>the</strong>re may be a greater demand<br />
<strong>for</strong> statistically analysed data in order to per<strong>for</strong>m error calculations and uncertainty analysis<br />
[18]; this may lead to higher expectations with regard to <strong>the</strong> primary data deliverers.<br />
Finally, <strong>the</strong> report is transparent and consistent. It is clearly written and well printed.<br />
4 Summary and recommendations<br />
To sum up, this Project is an excellent example <strong>for</strong> generic data acquisition, consolidation and<br />
presentation. It contributes to <strong>the</strong> Life Cycle Assessment development by providing reliable<br />
data <strong>for</strong> one important material and continues a tradition of more than a decade in an<br />
exemplary way.<br />
Possible improvements <strong>for</strong> <strong>the</strong> next round have been identified, especially by<br />
• including inventory data <strong>for</strong> land use (mining)<br />
• improving <strong>the</strong> solid waste treatment in LCI<br />
• improve <strong>the</strong> consistency with ISO structure (interpretation)<br />
• continue and extend <strong>the</strong> co-operation with <strong>the</strong> EU-LCA databank<br />
• extend <strong>the</strong> analysis toward Life Cycle Sustainability Assessment<br />
• contribute to enhancing <strong>the</strong> recycling<br />
• contribute to fur<strong>the</strong>r reduction of heavy oil use in alumina production<br />
Critical Review by Prof. Dr. Walter Klöpffer Page 9 of 12
<strong>Environmental</strong> <strong>Profile</strong> <strong>Report</strong> <strong>for</strong> <strong>the</strong> <strong>European</strong> <strong>Aluminium</strong> <strong>Industry</strong><br />
Life cycle methods can nei<strong>the</strong>r replace nor en<strong>for</strong>ce management decisions. They can,<br />
however, in<strong>for</strong>m, educate and lead to new ideas. It is proposed to rethink <strong>the</strong> whole system<br />
including renewable energy (e.g. solar energy) and explore possible new production methods.<br />
Although <strong>the</strong> <strong>the</strong>rmodynamic limits cannot be overcome, <strong>the</strong>re is no reason not to invest in<br />
radically new innovation. LCA may act as guide to prevent problem shifting.<br />
Thanks<br />
My thanks are due to Christian Leroy and Jörg Schäfer (EAA), to Bernard de Gélas (expert<br />
consultant, Paris) and to Marlen Bertram (IAI, <strong>for</strong>merly OEA) <strong>for</strong> <strong>the</strong> good co-operation<br />
during this review.<br />
References<br />
[1] Klöpffer, W.: Life Cycle Sustainability Assessment of Products. Int. J. LCA 13 (2) 89-<br />
94 (2008); DOI: http://dx.doi.org/10.1065/lca2008.02.376<br />
[2] Society of <strong>Environmental</strong> Toxicology and Chemistry (SETAC): Life Cycle Costing, A<br />
Code of Practice. Hunkeler, D. (ed.), Sydney, August 2008<br />
[3] Hunkeler, D.: Societal LCA Methodology and Case Study. Int. J. LCA 11 (6) 371-382<br />
(2006); DOI: http://dx.doi.org/10.1065/lca2006.08.261<br />
[4] Jørgensen, A.; Le Bocq, A.; Nazarkina, L.; Hauschild, M.: Methodologies <strong>for</strong> Social<br />
Life Cycle Assessment. Int. J. LCA 13 (2) 96-103 (2008).<br />
DOI: http://dx.doi.org/10.1065/lca2007.11.367<br />
[5] <strong>European</strong> <strong>Aluminium</strong> Association: <strong>Environmental</strong> <strong>Profile</strong> <strong>Report</strong> <strong>for</strong> <strong>the</strong> <strong>European</strong><br />
<strong>Aluminium</strong> <strong>Industry</strong>. EAA, Brussels, April 2000<br />
[6] <strong>European</strong> <strong>Aluminium</strong> Association: <strong>Environmental</strong> <strong>Profile</strong> <strong>Report</strong> <strong>for</strong> <strong>the</strong> <strong>European</strong><br />
<strong>Aluminium</strong> <strong>Industry</strong>. Primary <strong>Aluminium</strong> update – Year 2002; Semi-finished aluminium<br />
products and process scrap recycling Update – Year 2002; <strong>Aluminium</strong> Recycling in LCA.<br />
EAA, Brussels, September 2005<br />
[7] International Standard (ISO): <strong>Environmental</strong> management - Life cycle assessment:<br />
Principles and framework. ISO 14040 (October 2006)<br />
[8] International Standard (ISO): <strong>Environmental</strong> management - Life cycle assessment:<br />
Requirements and Guidelines. ISO 14044 (October 2006)<br />
[9] Boin, U.M.J.; Bertram, M.: Melting Standardized Aluminum Scrap: A Mass Balance<br />
Model <strong>for</strong> Europe. Journal of Metals (JOM) August 2005, 26-33<br />
Critical Review by Prof. Dr. Walter Klöpffer Page 10 of 12
<strong>Environmental</strong> <strong>Profile</strong> <strong>Report</strong> <strong>for</strong> <strong>the</strong> <strong>European</strong> <strong>Aluminium</strong> <strong>Industry</strong><br />
[10] EAA/OEA Recycling Division (Ed.): <strong>Aluminium</strong> Recycling in Europe. Brussels 2006<br />
http://www.aluminium.org<br />
[11] <strong>European</strong> <strong>Aluminium</strong> Association (EAA): <strong>Environmental</strong> <strong>Profile</strong> <strong>Report</strong> <strong>for</strong> <strong>the</strong><br />
<strong>European</strong> <strong>Aluminium</strong> <strong>Industry</strong>. Life Cycle Inventory data <strong>for</strong> aluminium production and<br />
trans<strong>for</strong>mation processes in Europe. Brussels, March 2008 [Draft]<br />
[12] Klöpffer, W.: The Role of SETAC in <strong>the</strong> Development of LCA. Int. J. LCA Special<br />
Issue 1, Vol. 11, 116-122 (2006) DOI: http://dx.doi.org/10.1065/lca2006.04.019<br />
[13] Klöpffer, W.: In Defense of <strong>the</strong> Cumulative Energy Demand. Int. J. LCA 2 (2) 61<br />
(1997)<br />
[14] VDI 4600: Kumulierter Energieaufwand (Cumulative Energy Demand). German and<br />
English. VDI-Gesellschaft Energietechnik Richtlinienausschuß Kumulierter Energieaufwand,<br />
Düsseldorf 1997<br />
[15] Declaration by <strong>the</strong> Metals <strong>Industry</strong> on Recycling Principles. Int. J. LCA 12 (1) 59-60<br />
(2007). Publication online: 30.11.2006, DOI: http://dx.doi.org/10.1065/lca2006.11.283<br />
[16] Milà i Canals, L.; Bauer, C.; Depestele, J.; Dubreuil, A.; Freiermuth Knuchel, R.;<br />
Gaillard, G.; Michelsen, O.; Müller-Wenk, R.; Rydgren, B.: Key Elements in a Framework<br />
<strong>for</strong> Land Use Impact Assessment Within LCA. Int. J. LCA 12 (1) 5-15 (2007)<br />
[17] http://lca.jrc.ec.europa.eu<br />
[18] Heijungs, R.; Frischknecht, R.: Representing Statistical Distributions <strong>for</strong> Uncertain<br />
Parameters in LCA. Relationships between ma<strong>the</strong>matical <strong>for</strong>ms, <strong>the</strong>ir representation in<br />
EcoSpold, and <strong>the</strong>ir representation in CMLCA. Int. J. LCA 10 (4) 248-254 (2005)<br />
Critical Review by Prof. Dr. Walter Klöpffer Page 11 of 12
<strong>Environmental</strong> <strong>Profile</strong> <strong>Report</strong> <strong>for</strong> <strong>the</strong> <strong>European</strong> <strong>Aluminium</strong> <strong>Industry</strong><br />
Frankfurt/M, May 1, 2008<br />
...............................................................................<br />
Prof. Dr. Walter Klöpffer<br />
Address of <strong>the</strong> reviewer:<br />
Prof. Dr. Walter Klöpffer<br />
Editor-in-chief, Int. Journal of<br />
Life Cycle Assessment<br />
LCA C ONSULT & R<br />
EVIEW<br />
Am Dachsberg 56E<br />
D-60435 Frankfurt/M<br />
Tel.: (+49-(0)69) 54 80 19 35<br />
Email: walter.kloepffer@t-online.de<br />
Critical Review by Prof. Dr. Walter Klöpffer Page 12 of 12