Investigation of Textile Fabrics Behavior under Compression
Investigation of Textile Fabrics Behavior under Compression
Investigation of Textile Fabrics Behavior under Compression

Create successful ePaper yourself
Turn your PDF publications into a flip-book with our unique Google optimized e-Paper software.
F0,12<br />
max<br />
,<br />
0,12 F max<br />
,<br />
130mm Warp<br />
N 150mm Warp<br />
N<br />
130mm Wef t<br />
150mm Wef t<br />
0,10 0.10 R 2 = 0.774<br />
0,10 0.10<br />
150mm 45 Bias<br />
130mm 45 Bias<br />
R 2 = 0.977<br />
0,08 0.08<br />
0,06 0.06<br />
0,04 0.04<br />
R 2 = 0.918<br />
R 2 = 0.728<br />
0,08 0.08<br />
0,06 0.06<br />
0,04 0.04<br />
R 2 = 0.981<br />
R 2 = 0.919<br />
F0,12<br />
max<br />
,<br />
N<br />
0,10 0.10<br />
0,08 0.08<br />
0,06 0.06<br />
0,04 0.04<br />
110mm Warp<br />
110mm Wef t<br />
110mm 45 Bias<br />
R 2 = 0.987<br />
R 2 = 0.995<br />
R 2 = 0.988<br />
0,02 0.02<br />
F max<br />
=aC +b<br />
0,02 0.02<br />
F max<br />
=aC +b<br />
0,02 0.02<br />
F max<br />
=aC +b<br />
0,00 0.00<br />
0 5 10 15<br />
C , ml/l<br />
0,00 0.00<br />
0 5 10 15<br />
C , ml/l<br />
0,00 0.00<br />
0 5 10 15<br />
C , m l/l<br />
a b c<br />
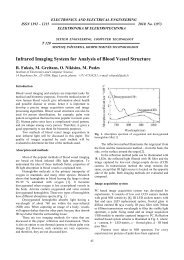
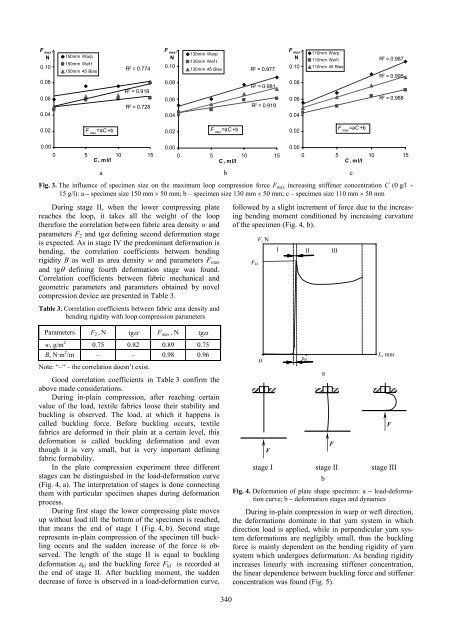
Fig. 3. The influence <strong>of</strong> specimen size on the maximum loop compression force F max increasing stiffener concentration C (0 g/l ÷<br />
15 g/l): a – specimen size 150 mm × 50 mm; b – specimen size 130 mm × 50 mm; c – specimen size 110 mm × 50 mm<br />
During stage II, when the lower compressing plate<br />
reaches the loop, it takes all the weight <strong>of</strong> the loop<br />
therefore the correlation between fabric area density w and<br />
parameters F 2 and tgα defining second deformation stage<br />
is expected. As in stage IV the predominant deformation is<br />
bending, the correlation coefficients between bending<br />
rigidity B as well as area density w and parameters F max<br />
and tgθ defining fourth deformation stage was found.<br />
Correlation coefficients between fabric mechanical and<br />
geometric parameters and parameters obtained by novel<br />
compression device are presented in Table 3.<br />
Table 3. Correlation coefficients between fabric area density and<br />
bending rigidity with loop compression parameters<br />
followed by a slight increment <strong>of</strong> force due to the increasing<br />
bending moment conditioned by increasing curvature<br />
<strong>of</strong> the specimen (Fig. 4, b).<br />
F, N<br />
I II III<br />
F kl<br />
ε kl<br />
Parameters F 2 , N tgα F max , N tgα<br />
w, g/m 2 0.75 0.82 0.89 0.75<br />
B, N·m 2 /m – – 0.98 0.96<br />
Note: “–“ – the correlation doesn’t exist.<br />
Good correlation coefficients in Table 3 confirm the<br />
above made considerations.<br />
During in-plain compression, after reaching certain<br />
value <strong>of</strong> the load, textile fabrics loose their stability and<br />
buckling is observed. The load, at which it happens is<br />
called buckling force. Before buckling occurs, textile<br />
fabrics are deformed in their plain at a certain level, this<br />
deformation is called buckling deformation and even<br />
though it is very small, but is very important defining<br />
fabric formability.<br />
In the plate compression experiment three different<br />
stages can be distinguished in the load-deformation curve<br />
(Fig. 4, a). The interpretation <strong>of</strong> stages is done connecting<br />
them with particular specimen shapes during deformation<br />
process.<br />
During first stage the lower compressing plate moves<br />
up without load till the bottom <strong>of</strong> the specimen is reached,<br />
that means the end <strong>of</strong> stage I (Fig. 4, b). Second stage<br />
represents in-plain compression <strong>of</strong> the specimen till buckling<br />
occurs and the sudden increase <strong>of</strong> the force is observed.<br />
The length <strong>of</strong> the stage II is equal to buckling<br />
deformation ε kl and the buckling force F kl is recorded at<br />
the end <strong>of</strong> stage II. After buckling moment, the sudden<br />
decrease <strong>of</strong> force is observed in a load-deformation curve,<br />
0<br />
F<br />
a<br />
stage I stage II stage III<br />
b<br />
Fig. 4. Deformation <strong>of</strong> plate shape specimen: a – load-deformation<br />
curve; b – deformation stages and dynamics<br />
During in-plain compression in warp or weft direction,<br />
the deformations dominate in that yarn system in which<br />
direction load is applied, while in perpendicular yarn system<br />
deformations are negligibly small, thus the buckling<br />
force is mainly dependent on the bending rigidity <strong>of</strong> yarn<br />
system which <strong>under</strong>goes deformation. As bending rigidity<br />
increases linearly with increasing stiffener concentration,<br />
the linear dependence between buckling force and stiffener<br />
concentration was found (Fig. 5).<br />
F<br />
L, mm<br />
F<br />
340