Investigation of Textile Fabrics Behavior under Compression
Investigation of Textile Fabrics Behavior under Compression
Investigation of Textile Fabrics Behavior under Compression

You also want an ePaper? Increase the reach of your titles
YUMPU automatically turns print PDFs into web optimized ePapers that Google loves.
ISSN 1392–1320 MATERIALS SCIENCE (MEDŽIAGOTYRA). Vol. 13, No. 4. 2007<br />
<strong>Investigation</strong> <strong>of</strong> <strong>Textile</strong> <strong>Fabrics</strong> <strong>Behavior</strong> <strong>under</strong> <strong>Compression</strong><br />
Laura NAUJOKAITYTĖ ∗ , Eugenija STRAZDIENĖ<br />
Department <strong>of</strong> Clothing and Polymer Products Technology, Kaunas University <strong>of</strong> Technology,<br />
Studentų 56, LT-51424 Kaunas, Lithuania<br />
Received 07 September 2007; accepted 15 October 2007<br />
<strong>Textile</strong> materials during manipulation or in garment formation processes tend to deform and loose their form stability<br />
even subjected to low loading. Their deformation behavior is greatly influenced by combination <strong>of</strong> fabric mechanical<br />
properties at low loads. In present paper the new attachment for the tensile tester is presented for the investigation <strong>of</strong><br />
fabric deformation behavior <strong>under</strong> compression; the construction and working principle <strong>of</strong> equipment is discussed.<br />
Fabric deformation behavior is investigated compressing two types <strong>of</strong> specimens: pear loop shaped and plate shape. The<br />
obtained load-deformation curves according to their characteristic parts are divided into different zones. Each zone is<br />
defined by appropriate parameters. The KES-FB (Kawabata Evaluation System for <strong>Fabrics</strong>) system is used for the<br />
measurements <strong>of</strong> low stress tensile, shear and bending properties. The relationships between the parameters obtained by<br />
new equipment and parameters obtained by KES-FB system as well as with formability parameter are defined. The<br />
obtained results revealed that deformation behavior <strong>under</strong> compression <strong>of</strong> plate and pear loop shaped fabric specimens is<br />
greatly influenced by fabric structure, direction and mechanical properties and it gives the information about fabric<br />
formability.<br />
Keywords: compression, bending, buckling, low loads.<br />
INTRODUCTION ∗<br />
Nowadays traditional strength oriented textile testing<br />
methods are replaced by methods that are based on determination<br />
<strong>of</strong> the mechanical responses <strong>of</strong> fabrics subjected<br />
to low stresses. These methods are created to simulate the<br />
actual fabric loading situation during garment processing<br />
and wearing. The obtained data provides useful information<br />
in guiding manufacturing and designing processes,<br />
predicting formability, tailorability and appearance <strong>of</strong><br />
fabrics [1 – 3].<br />
Two most widely accepted sets <strong>of</strong> instruments in the<br />
world for the measurement <strong>of</strong> low stress mechanical<br />
properties <strong>of</strong> fabrics are KES-FB (Kawabata Evaluation<br />
System for <strong>Fabrics</strong>) [4] and FAST (Fabric Assurance by<br />
Simple Testing) [5] systems. These two systems are used<br />
to investigate the same fabric properties using different<br />
measuring principles; they summarize the basic<br />
mechanical behavior <strong>of</strong> fabrics, but do not characterize the<br />
visual cloth deformations such as buckling and wrinkling,<br />
that are a complex combinations <strong>of</strong> these parameters [6, 7].<br />
Many new methods are being developed in order to<br />
characterize the complex fabric deformations or measure<br />
multiple properties through single test [8 – 10]. In these<br />
methods different fabric properties are correlated to<br />
characteristic peaks or slopes <strong>of</strong> the load-displacement<br />
curves.<br />
Fabric formation into spatial garments or products is<br />
also determined by the complex combination <strong>of</strong> different<br />
mechanical properties. During formation textile materials<br />
have to deform in their plain so, that they could cover spatial<br />
surfaces without forming undesired wrinkles or folds.<br />
In early sixties Lindberg [11] defined fabric formability as<br />
a product <strong>of</strong> its bending rigidity and in-plain compressibil-<br />
∗ Corresponding author. Tel.: + 370-37-300205; fax.: +370-37-353989.<br />
E-mail address: launauj@gmail.com (L. Naujokaitytė)<br />
ity, i. e. its ability to sustain in-plain compression before<br />
buckling. Fabric bending behavior since 1930’s received a<br />
big attention <strong>of</strong> scientists and is widely investigated by a<br />
number <strong>of</strong> equipment based on simple investigation <strong>of</strong><br />
fabric deformation <strong>under</strong> its own weight e. g. cantilever,<br />
loop methods [12 – 14] or more sophisticated methods<br />
measuring moment – curvature or force – angle relationships<br />
[4, 15 – 17]. Less attention is paid to direct measurements<br />
<strong>of</strong> fabric in-plain compression. One <strong>of</strong> the few<br />
attempts <strong>of</strong> direct measurements <strong>of</strong> in plain compressibility<br />
<strong>of</strong> fabric plate was done by Dahlberg et al. [18, 19] who<br />
constructed an apparatus as an attachment to Instron tensile<br />
tester, but this method didn’t gain a wide acceptance. In<br />
most <strong>of</strong> the fabric formability research works compressibility<br />
is substituted by the initial fabric extensibility that<br />
was proved by Lindberg [11] to be <strong>of</strong> the same magnitude<br />
as compressibility. This approximation is quite rough thus<br />
it can give distorted results.<br />
The objective <strong>of</strong> the present paper is to provide the<br />
method and new attachment for the tensile tester for the<br />
investigation <strong>of</strong> fabric deformation behaviour <strong>under</strong><br />
compression, the device is also used for registering the<br />
buckling force as well as the in-plain compressibility <strong>of</strong><br />
fabrics at buckling.<br />
MATERIALS AND TEST METHODS<br />
100 % cotton fabric (area density – 138 g/m 2 ; warp<br />
density – 24 cm –1 ; weft density – 23 cm –1 ) was chosen for<br />
the investigation. Four different finishing treatments were<br />
applied for the test samples in order to change the bending<br />
rigidity parameter. These four groups <strong>of</strong> fabrics were<br />
obtained treating pieces <strong>of</strong> fabric with PVAc (polyvinyl<br />
acetate) stiffener dispersions in water <strong>of</strong> concentrations<br />
differing by 5 g/l (i. e. untreated samples and treated with<br />
5 g/l, 10 g/l and 15 g/l stiffener concentrations). Specimen<br />
preparation, pre-conditioning, and testing involved<br />
337
standard atmospheric conditions <strong>of</strong> 20 °C ±2 °C<br />
temperature and 65 % ±2 % relative humidity.<br />
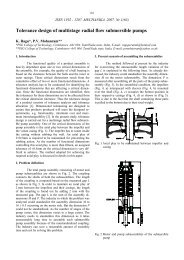
A new device designed on the basis <strong>of</strong> a standard<br />
instrument for compression <strong>of</strong> polymeric materials was<br />
created as an attachment for tensile tester. The schematic<br />
view <strong>of</strong> the compression device and the modes <strong>of</strong> specimen<br />
fixing are presented in Figure 1.<br />
170<br />
40<br />
40<br />
75<br />
75<br />
150<br />
2<br />
3<br />
100<br />
122<br />
a<br />
1<br />
1<br />
b<br />
c<br />
Fig. 1. Scheme <strong>of</strong> the compression tester: a – construction <strong>of</strong> the<br />
device (linear dimensions are given in mm):<br />
1 – lower stable block; 2 – upper movable compressing<br />
block; 3 – aperture for fixing the specimen; 4 – plate for<br />
fixing compressing block to the upper clamp <strong>of</strong> tensile<br />
tester; b – fixing scheme <strong>of</strong> loop shaped specimen in an<br />
aperture: 1 – specimen; 2 – fixing plate; c – fixing scheme<br />
<strong>of</strong> plate shape specimen in an aperture:<br />
1 – specimen; 2 – magnetic clamps<br />
The lower stable block 1 (see Fig. 1, a) is rigidly attached<br />
to a lower clamp <strong>of</strong> tensile tester. The specimen is<br />
clamped into an aperture 3 <strong>of</strong> the upper plate <strong>of</strong> the stable<br />
block 1. The movable block 2 is attached via fixing plate 4<br />
to an upper clamp <strong>of</strong> tensile tester and moves up till its<br />
lower plate reaches the specimen and starts compressing it.<br />
The load-deformation curve is obtained and the experiment<br />
terminates when the predefined deformation is reached.<br />
The experiments are performed compressing two types<br />
<strong>of</strong> specimens: loop shaped (Fig. 1, b) and plate shaped<br />
(Fig. 1, c).<br />
The deformation behavior <strong>of</strong> pear loop shaped specimens<br />
was investigated in warp, weft and 45° bias<br />
directions. Three different dimensions <strong>of</strong> the specimens<br />
were chosen for the investigation: 150 mm × 50 mm,<br />
F<br />
53<br />
R=50<br />
4<br />
2<br />
2<br />
1<br />
130 mm × 50 mm and 110 mm × 50 mm. For each fabric<br />
and different direction four to six replicate measurements<br />
were made, variation coefficient varied between 3 % –<br />
15 %. The distance between the specimen fixing plate and<br />
compressing plate was 67 mm. The experiment ends up<br />
when the linear compressive deformation L maxkl = 55 mm.<br />
Speed <strong>of</strong> the tensile tester is set to 100 mm/min.<br />
The deformation behavior <strong>of</strong> plate shape specimens<br />
was investigated in warp, weft and 45° bias directions.<br />
Size <strong>of</strong> the specimen was 30 mm × 50 mm. For each fabric<br />
and different direction six to nine replicate measurements<br />
were made, variation coefficient varied between 5 % –<br />
18 %. The distance between the specimen fixing plate and<br />
compressing plate was 45 mm. The experiment ends up<br />
when the linear compressive deformation <strong>of</strong> the specimen<br />
equals 33 %, i. e. L maxpl = 25 mm. Speed <strong>of</strong> the tensile<br />
tester is set to 100 mm/min. The process <strong>of</strong> experiment<br />
must be carefully observed, so that the specimen wouldn’t<br />
get distorted what can give shell buckling effect with much<br />
higher values <strong>of</strong> buckling force and skewed results.<br />
The KES-FB system [4] was used as a reference data<br />
for the determination <strong>of</strong> the fabric low load mechanical<br />
properties such as bending (B – bending rigidity), tensile<br />
(LT – linearity <strong>of</strong> tensile curve, EMT – extension at<br />
490 N/m load) and shear (G – shear modulus, 2HG5 –<br />
shear hysteresis at an angle 5°) properties. In addition to<br />
standard KES-FB parameters a non-standard parameter –<br />
formability F KES – was also calculated from KES-FB<br />
data [20]:<br />
EMT G<br />
F KES = ⋅ B ⋅ , (1)<br />
490⋅<br />
LT 2HG5<br />
where: EMT is the extension at 490 N/m load in %, LT is<br />
the linearity <strong>of</strong> tensile curve, B is the bending rigidity in<br />
N·m 2 /m, G is the shear modulus in N/m, 2HG5 is the shear<br />
hysteresis at an angle <strong>of</strong> 5° in N/m.<br />
Standard samples <strong>of</strong> 200 mm × 200 mm were tested in<br />
warp and weft directions. Four replicate measurements<br />
were made for each property. Mechanical properties were<br />
measured according to standard KES-FB specifications<br />
except for shear test. For the investigation <strong>of</strong> shear<br />
properties maximum shear angle was set to 6 degrees,<br />
because the investigated fabrics were prone to buckle<br />
before 8 degrees angle (typical for KES-FB) was reached.<br />
RESULTS AND DISCUSSION<br />
The parameters obtained by KES-FB system are<br />
presented in Table 1.<br />
In the compression experiment <strong>of</strong> loop shaped<br />
specimens four different stages can be distinguished in the<br />
load-deformation curve (Fig. 2, a). The interpretation <strong>of</strong><br />
stages is done connecting them with particular loop shapes<br />
that were captured by a camera during deformation<br />
process.<br />
During first stage the lower compressing plate moves<br />
up without load till the bottom <strong>of</strong> the loop is reached, what<br />
means the end <strong>of</strong> stage I (Fig. 2, b). The length <strong>of</strong> stage I<br />
L 0 represents the length <strong>of</strong> loop from its own weight:<br />
L k 0<br />
Lmax<br />
− L0<br />
= (2)<br />
where: L k0 – initial loop length, L max – maximum distance<br />
between compressing plates in mm.<br />
338
Table 1. Parameters obtained by KES-FB system<br />
Parameter<br />
B, N·m 2 /m EMT, % LT G, N/m·° 2HG5, N/m F KES ×10 -4 , mm 2<br />
Fabric direction<br />
Warp Weft Warp Weft Warp Weft Warp Weft Warp Weft Warp Weft<br />
Co_0 0.054 0.032 4.09 10.96 0.77 0.64 2.19 2.20 4.71 5.32 1.56 1.88<br />
Co_5 0.119 0.060 3.66 9.18 0.83 0.76 2.79 2.82 5.82 6.63 3.45 3.62<br />
Co_10 0.160 0.103 3.17 8.33 0.85 0.82 4.45 4.38 8.67 8.89 4.44 7.07<br />
Co_15 0.240 0.131 2.96 9.91 0.87 0.83 4.59 4.97 9.85 10.23 5.77 8.86<br />
F, N<br />
0.8<br />
F max<br />
0.6<br />
0.4<br />
F 2<br />
0.2<br />
0<br />
II III IV<br />
I<br />
L 0<br />
θ<br />
B<br />
A<br />
α<br />
0 10 20 30 40 50 60 L, mm<br />
a<br />
L k0<br />
F<br />
a<br />
a<br />
F<br />
stage I stage II stages III and IV<br />
b<br />
Fig. 2. Deformation <strong>of</strong> loop shaped specimen: a – load-deformation<br />
curve; b – deformation stages and dynamics<br />
Second stage starts with the beginning <strong>of</strong> deformation<br />
process when the lower plate reaches loop bottom<br />
and starts compressing it. The contact area between bottom<br />
part <strong>of</strong> the loop and compressing plate is increasing; in<br />
the upper part <strong>of</strong> the loop straight segment “a” is<br />
distinguished (Fig. 2, b), its buckling shows the end <strong>of</strong><br />
stage II (Fig. 2, c). The linear increase <strong>of</strong> load is observed<br />
in load- deformation curve till the point A is reached. The<br />
force F 2 is recorded at point A and the inclination <strong>of</strong> the<br />
curve in stage II is described by parameter tgα.<br />
In the stage III the inclination <strong>of</strong> load-deformation<br />
curve is observed, its end is marked with the point B,<br />
which denotes the beginning <strong>of</strong> the straight part <strong>of</strong> the<br />
curve and the beginning <strong>of</strong> stage IV where the predominant<br />
deformation is bending; the radius R <strong>of</strong> the inner contour<br />
<strong>of</strong> the loop is decreasing and the curvature K = 1/R is<br />
increasing. The stage IV is described by the maximum<br />
R<br />
F<br />
force F max reached at the maximum predefined deformation<br />
L maxkl and the inclination <strong>of</strong> the curve tgθ (Fig. 2)<br />
Changing the dimensions <strong>of</strong> the loops changes the<br />
length <strong>of</strong> the characteristic deformation stages as well as<br />
characteristic parameters defining these stages. The influence<br />
<strong>of</strong> loop shaped specimens dimensions on the maximum<br />
compression force F max , increasing stiffener concentration<br />
C is presented in Figure 3. It was found that longer<br />
loops (150 mm × 50 mm) due to their lower stability give<br />
more scattered results and the F max parameter doesn’t show<br />
strong linear relationship with increasing stiffener<br />
concentration. Decreasing length <strong>of</strong> the specimens gives<br />
lower error <strong>of</strong> the measurement and the specimens <strong>of</strong> size<br />
110 mm × 50 mm show the strongest linear relationship<br />
between F max and stiffener concentration C (R 2 = = 0.987 –<br />
0.995), thus this size <strong>of</strong> the specimens was chosen for the<br />
further investigations.<br />
The values <strong>of</strong> parameters describing loop compression<br />
process for the loop <strong>of</strong> dimensions 110 mm × 50 mm case<br />
are presented in Table 2.<br />
Table 2. Values <strong>of</strong> parameters describing loop compression<br />
Co_0<br />
Co_5<br />
Co_10<br />
Co_15<br />
Parameters<br />
F 2 , N tgα F max , N tgθ<br />
Warp 0.015 0.007 0.055 0.0009<br />
Weft 0.011 0.005 0.043 0.0007<br />
Bias 0.015 0.004 0.049 0.0008<br />
Warp 0.023 0.008 0.067 0.0011<br />
Weft 0.016 0.005 0.051 0.0009<br />
Bias 0.023 0.006 0.062 0.0010<br />
Warp 0.036 0.011 0.090 0.0015<br />
Weft 0.024 0.006 0.067 0.0013<br />
Bias 0.030 0.009 0.077 0.0014<br />
Warp 0.042 0.013 0.106 0.0016<br />
Weft 0.026 0.006 0.071 0.0012<br />
Bias 0.031 0.009 0.087 0.0015<br />
Loop deformation changes and parameters defining<br />
them are related to mechanical and geometrical parameters<br />
<strong>of</strong> the fabrics. From the stage I according to the pear<br />
hanging loop method proposed by F. T. Peirce [12] it<br />
should be possible to decide about the bending properties<br />
<strong>of</strong> fabrics, but in our case the length <strong>of</strong> the loops L k0 varied<br />
with in the limits <strong>of</strong> 1 mm, thus this parameter is not<br />
sensitive in the case <strong>of</strong> light weight fabrics.<br />
339
F0,12<br />
max<br />
,<br />
0,12 F max<br />
,<br />
130mm Warp<br />
N 150mm Warp<br />
N<br />
130mm Wef t<br />
150mm Wef t<br />
0,10 0.10 R 2 = 0.774<br />
0,10 0.10<br />
150mm 45 Bias<br />
130mm 45 Bias<br />
R 2 = 0.977<br />
0,08 0.08<br />
0,06 0.06<br />
0,04 0.04<br />
R 2 = 0.918<br />
R 2 = 0.728<br />
0,08 0.08<br />
0,06 0.06<br />
0,04 0.04<br />
R 2 = 0.981<br />
R 2 = 0.919<br />
F0,12<br />
max<br />
,<br />
N<br />
0,10 0.10<br />
0,08 0.08<br />
0,06 0.06<br />
0,04 0.04<br />
110mm Warp<br />
110mm Wef t<br />
110mm 45 Bias<br />
R 2 = 0.987<br />
R 2 = 0.995<br />
R 2 = 0.988<br />
0,02 0.02<br />
F max<br />
=aC +b<br />
0,02 0.02<br />
F max<br />
=aC +b<br />
0,02 0.02<br />
F max<br />
=aC +b<br />
0,00 0.00<br />
0 5 10 15<br />
C , ml/l<br />
0,00 0.00<br />
0 5 10 15<br />
C , ml/l<br />
0,00 0.00<br />
0 5 10 15<br />
C , m l/l<br />
a b c<br />
Fig. 3. The influence <strong>of</strong> specimen size on the maximum loop compression force F max increasing stiffener concentration C (0 g/l ÷<br />
15 g/l): a – specimen size 150 mm × 50 mm; b – specimen size 130 mm × 50 mm; c – specimen size 110 mm × 50 mm<br />
During stage II, when the lower compressing plate<br />
reaches the loop, it takes all the weight <strong>of</strong> the loop<br />
therefore the correlation between fabric area density w and<br />
parameters F 2 and tgα defining second deformation stage<br />
is expected. As in stage IV the predominant deformation is<br />
bending, the correlation coefficients between bending<br />
rigidity B as well as area density w and parameters F max<br />
and tgθ defining fourth deformation stage was found.<br />
Correlation coefficients between fabric mechanical and<br />
geometric parameters and parameters obtained by novel<br />
compression device are presented in Table 3.<br />
Table 3. Correlation coefficients between fabric area density and<br />
bending rigidity with loop compression parameters<br />
followed by a slight increment <strong>of</strong> force due to the increasing<br />
bending moment conditioned by increasing curvature<br />
<strong>of</strong> the specimen (Fig. 4, b).<br />
F, N<br />
I II III<br />
F kl<br />
ε kl<br />
Parameters F 2 , N tgα F max , N tgα<br />
w, g/m 2 0.75 0.82 0.89 0.75<br />
B, N·m 2 /m – – 0.98 0.96<br />
Note: “–“ – the correlation doesn’t exist.<br />
Good correlation coefficients in Table 3 confirm the<br />
above made considerations.<br />
During in-plain compression, after reaching certain<br />
value <strong>of</strong> the load, textile fabrics loose their stability and<br />
buckling is observed. The load, at which it happens is<br />
called buckling force. Before buckling occurs, textile<br />
fabrics are deformed in their plain at a certain level, this<br />
deformation is called buckling deformation and even<br />
though it is very small, but is very important defining<br />
fabric formability.<br />
In the plate compression experiment three different<br />
stages can be distinguished in the load-deformation curve<br />
(Fig. 4, a). The interpretation <strong>of</strong> stages is done connecting<br />
them with particular specimen shapes during deformation<br />
process.<br />
During first stage the lower compressing plate moves<br />
up without load till the bottom <strong>of</strong> the specimen is reached,<br />
that means the end <strong>of</strong> stage I (Fig. 4, b). Second stage<br />
represents in-plain compression <strong>of</strong> the specimen till buckling<br />
occurs and the sudden increase <strong>of</strong> the force is observed.<br />
The length <strong>of</strong> the stage II is equal to buckling<br />
deformation ε kl and the buckling force F kl is recorded at<br />
the end <strong>of</strong> stage II. After buckling moment, the sudden<br />
decrease <strong>of</strong> force is observed in a load-deformation curve,<br />
0<br />
F<br />
a<br />
stage I stage II stage III<br />
b<br />
Fig. 4. Deformation <strong>of</strong> plate shape specimen: a – load-deformation<br />
curve; b – deformation stages and dynamics<br />
During in-plain compression in warp or weft direction,<br />
the deformations dominate in that yarn system in which<br />
direction load is applied, while in perpendicular yarn system<br />
deformations are negligibly small, thus the buckling<br />
force is mainly dependent on the bending rigidity <strong>of</strong> yarn<br />
system which <strong>under</strong>goes deformation. As bending rigidity<br />
increases linearly with increasing stiffener concentration,<br />
the linear dependence between buckling force and stiffener<br />
concentration was found (Fig. 5).<br />
F<br />
L, mm<br />
F<br />
340
Compressing the fabric in 45° bias direction, deformations<br />
consisting <strong>of</strong> yarn compression and rotation occur in<br />
both yarn systems. The changes <strong>of</strong> the unit cell geometry<br />
due to rotation <strong>of</strong> warp and weft yarns are observed during<br />
this deformation. Theoretically critical buckling force<br />
should be reached when the shear lock angle is reached,<br />
but in reality membrane strains are exceeded much earlier<br />
and specimen buckles before shear lock angle is reached.<br />
The correlation coefficient between shear rigidity G and<br />
buckling force F kl in bias direction was calculated<br />
(r = 0.97).<br />
F0,14<br />
kl<br />
, N<br />
0.12 0,12<br />
0.10 0,10<br />
0.08 0,08<br />
Warp<br />
Weft<br />
45 Bias<br />
F kl =aC +b<br />
R 2 = 0.988<br />
R 2 = 0.997<br />
Strong correlations (r = 0.99) were obtained between<br />
the buckling force F kl and formability parameter F KES<br />
(calculated according to eq.1) in both warp and weft<br />
directions. This relation shows that the lower is the<br />
buckling force <strong>of</strong> the fabric the lower formability it<br />
possesses.<br />
The values <strong>of</strong> buckling deformation ε kl were determined<br />
directly form the obtained load deformation curves<br />
(Fig. 7).<br />
ε kl, %<br />
2,6 2.6<br />
2,0 2.0<br />
1,3 1.3<br />
Warp Weft 45 Bias<br />
0.06 0,06<br />
0.04 0,04<br />
R 2 = 0.982<br />
0,7 0.7<br />
0.02 0,02<br />
0.00 0,00<br />
0 5 10 15 C , g/l<br />
Fig. 5. Dependence <strong>of</strong> buckling force F kl on stiffener concentration<br />
C<br />
In literature [18] it was proved that the plate buckling<br />
force varies with the specimen length in approximate<br />
agreement with Euler’s equation for buckling <strong>of</strong> bars. In<br />
present case the equation <strong>of</strong> bars rigidly supported at one<br />
end is used for the calculation <strong>of</strong> buckling force:<br />
2<br />
π B<br />
F klcalc = , (3)<br />
2<br />
4l<br />
where: B is the fabric bending rigidity, l is the specimen<br />
length.<br />
From Equation 3 it is seen that keeping constant length<br />
<strong>of</strong> the specimen, the changes <strong>of</strong> buckling force must be<br />
proportional to fabric bending rigidity. A strong linear<br />
relationship (r = 0.98) between calculated F klcalc and<br />
experimental values <strong>of</strong> buckling force F kl was obtained<br />
(Fig. 6).<br />
F 1,0<br />
klcalc , N/m<br />
0.9 0,9<br />
0.8 0,8<br />
0.7 0,7<br />
0.6 0,6<br />
0.5 0,5<br />
0.4 0,4<br />
0.3 0,3<br />
0.2 0,2<br />
0.1 0,1<br />
r = 0.984<br />
0.0 0,0<br />
0. 0,0 0.5 0,5 1.0 1,0 1,5 1.5 2,0 2.0 2.5 2,5 F kl , N/m<br />
Fig. 6. Correlation between experimental and calculated buckling<br />
force<br />
0,0 0.0<br />
0 5 10 15 C , g/l<br />
Fig. 7. Dependence <strong>of</strong> buckling deformation ε kl on stiffener<br />
concentration C<br />
These values (Fig. 7) didn’t show clear tendencies<br />
with increasing stiffener concentration. In warp and weft<br />
direction buckling deformation is equal to 1.9 % – 2.1 %<br />
and varies within the limits <strong>of</strong> 0.3 mm, this is determined<br />
by the dense structure <strong>of</strong> the fabric that can’t deform<br />
within its plain. As expected the buckling deformation in<br />
bias direction is a little bit higher (2.1 % – 2.6 %) due to<br />
the shear effect.<br />
CONCLUSIONS<br />
In the present paper the new technically simple method<br />
for the investigation <strong>of</strong> deformation behavior <strong>of</strong> fabrics<br />
<strong>under</strong> compression is presented.<br />
During deformation <strong>of</strong> loop shaped specimens four<br />
main stages can be distinguised in load-deformation curve.<br />
The characteristic parameters <strong>of</strong> each stage depend on<br />
specimen dimensions, fabric direction and its mechanical<br />
properties. Optimal size <strong>of</strong> the specimens was set to<br />
110 mm × 50 mm. The parameters defining second stage<br />
F 2 and tgα show good correlation with fabric area density,<br />
while fourth stage parameters F max and tgθ show strong<br />
relationship with bending rigidity B.<br />
In the plate shape specimen deformation experiment<br />
the buckling force F kl and buckling deformation ε kl values<br />
<strong>of</strong> the fabrics can be defined. Experimentally obtained<br />
buckling force F kl changes in a good agreement with<br />
Euler’s equation for buckling <strong>of</strong> bars rigidly supported at<br />
one end. Buckling force F kl and buckling deformation ε kl<br />
mainly depend on fabric direction and its mechanical<br />
properties. Buckling force F kl obtained in principle fabric<br />
directions shows good correlation with bending rigidity B<br />
and formability F KES parameter <strong>of</strong> fabrics; in bias direction<br />
it shows correlation with the shear modulus G.<br />
341
Acknowledgments<br />
The authors would like to thank Technical University<br />
<strong>of</strong> Liberec for assistance with KES-FB testing, through<br />
project CoE-ITSAPT’2005.<br />
REFERENCES<br />
1. Pan, N., Zeronian, S. H., Ryu, H. S. An Alternative<br />
Approach to the Objective Measurement <strong>of</strong> <strong>Fabrics</strong> Tex.<br />
Res. J. 63 (1) 1993: pp. 33 – 43.<br />
2. Pavlinic, D. Z., Geršak, J. Design <strong>of</strong> The System for<br />
Prediction <strong>of</strong> Fabric <strong>Behavior</strong> in Garment Manufacturing<br />
Processes Int. J. <strong>of</strong> Cloth. Sc. and Tech. 16 (1/2) 2004:<br />
pp. 252 – 261.<br />
3. Leung, M. Y., Lo, T. Y., Dhingra, R. C., Yeung, K. W.<br />
Relationship between Fabric Formability, Bias Extension<br />
and Shear <strong>Behavior</strong> <strong>of</strong> Outerwear Materials Res. J. <strong>of</strong> Text.<br />
and App. 4 (2) 2000: pp. 10 – 23.<br />
4. Kawabata Evaluation System for <strong>Fabrics</strong> Manual, Kato<br />
Tech. Co. Ltd, Kyoto, Japan.<br />
5. Fabric Assurance by Simple Testing, CSIRO Division <strong>of</strong><br />
Wool Technology. Geelong, Australia, 1997.<br />
6. Yick, K. L., Cheng, K. P. S., Dhingra, R. C., How, Y. L.<br />
Comparison <strong>of</strong> Mechanical Properties <strong>of</strong> Shirting Materials<br />
Measured on the KES-F and FAST Instruments Text. Res.<br />
J. 66 (10) 1996: pp. 622 – 633.<br />
7. Pascal, V., Thalmann, N. M. Virtual Clothing: Theory and<br />
Practice Berlin, Springer 2000: 283 p. ISBN 3-540-67600-7.<br />
8. Yazdi, A. A., Amirbayat, J. Evaluation <strong>of</strong> the Basic Low<br />
Stress Mechanical Properties (Bending, Shearing and<br />
Tensile) Int. J. <strong>of</strong> Cloth. Sc. and Tech. 12 (5) 2000:<br />
pp. 311 – 325.<br />
9. Yazdi, A. A., Shahbazi, Z. Evaluation <strong>of</strong> the Bending<br />
Properties <strong>of</strong> Viscose/Polyester Woven <strong>Fabrics</strong> Fibr. and<br />
Text. in East. Eu. 14 (2(56)) 2006: pp. 50 – 54.<br />
10. Du, Z., Yu, W. Analysis <strong>of</strong> Bending Properties <strong>of</strong> Worsted<br />
Wool Yarns and <strong>Fabrics</strong> Based on Quasi-three-point<br />
Bending J. <strong>of</strong> the Text. Inst. 96 (6) 2005: pp. 389 – 399.<br />
11. Lindberg, J., Waesterberg, L., Svenson, R. Wool <strong>Fabrics</strong><br />
as Garment Construction Materials J. <strong>of</strong> the Text. Inst.<br />
51 (12) 1960: pp. T1475 – T1493.<br />
12. Peirce, F. T. The „Handle“ <strong>of</strong> Cloth as a Measurable<br />
Quantity J. <strong>of</strong> the Text. Inst. 21 (11) 1930:<br />
pp. T377 – T416.<br />
13. Cassidy, T., Cassidy, C., Cassie, S., Arkison, M. The<br />
Stiffness <strong>of</strong> Knitted <strong>Fabrics</strong>: A New Approach to the<br />
Measurement <strong>of</strong> Bending - Part 1: Development Int. J. <strong>of</strong><br />
Cloth. Sc. and Tech. 3 (5) 1991: pp. 14 – 19.<br />
14. Mete, F., Lloyd, D. W. Modelling the “CLOACK” Test: an<br />
Example <strong>of</strong> Two-dimensional Elastica Theory J. <strong>of</strong> Cloth.<br />
Sc. and Tech. 12 (4) 2000: pp. 255 – 264.<br />
15. Livsey, R. G., Owen, J. D. Cloth Stiffness and Hysteresis in<br />
Bending J. <strong>of</strong> the Text. Inst. 55 (10) 1964:<br />
pp. T516 – T530.<br />
16. Abbott, G. M., Grosberg, P. Measurement <strong>of</strong> Fabric<br />
Stiffness and Hysteresis in Bending Text. Res. J. 36 (10)<br />
1966: pp. 928 – 930.<br />
17. Ozcelik, G., Fridrichova, L., Bajzik, V. The Comparison<br />
<strong>of</strong> Two Different bending Rigidity Testers 4 th CEC<br />
Conference Proceedings 2005: pp. 1 – 6 (CD edition).<br />
18. Dahlberg, B. Mechanical Properties <strong>of</strong> <strong>Textile</strong> <strong>Fabrics</strong> Part<br />
II: Buckling Text. Res. J. 31 (2) 1961: pp. 94 – 99.<br />
19. Lindberg, J., Behre, B., Dahlberg, B. Part III: Shearing<br />
and Buckling <strong>of</strong> Various Commercial <strong>Fabrics</strong> Text. Res. J.<br />
31 (2) 1961: pp. 99 – 122.<br />
20. Harlock, S. C. Fabric Objective Measurement: 4,<br />
Production Control in Apparel Manufacture Text. Asia<br />
20 (7) 1989: pp. 89 – 98.<br />
Presented at the National Conference "Materials Engineering’2007"<br />
(Kaunas, Lithuania, November 16, 2007)<br />
342