SINGAPORE â¦. MONTHLY COMMERCIAL REPORT â MAY 2012 ...
SINGAPORE â¦. MONTHLY COMMERCIAL REPORT â MAY 2012 ...
SINGAPORE â¦. MONTHLY COMMERCIAL REPORT â MAY 2012 ...

You also want an ePaper? Increase the reach of your titles
YUMPU automatically turns print PDFs into web optimized ePapers that Google loves.
<strong>SINGAPORE</strong><br />
….<br />
<strong>MONTHLY</strong> <strong>COMMERCIAL</strong> <strong>REPORT</strong> – <strong>MAY</strong> <strong>2012</strong><br />
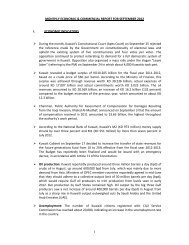
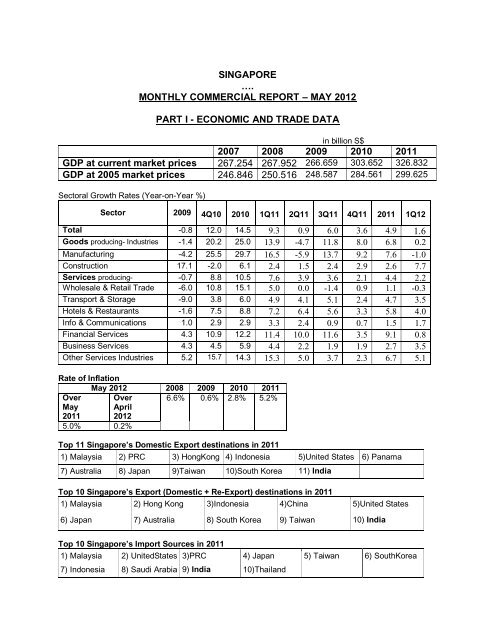
PART I - ECONOMIC AND TRADE DATA<br />
in billion S$<br />
2007 2008 2009 2010 2011<br />
GDP at current market prices 267.254 267.952 266.659 303.652 326.832<br />
GDP at 2005 market prices 246.846 250.516 248.587 284.561 299.625<br />
Sectoral Growth Rates (Year-on-Year %)<br />
Sector 2009 4Q10 2010 1Q11 2Q11 3Q11 4Q11 2011 1Q12<br />
Total -0.8 12.0 14.5 9.3 0.9 6.0 3.6 4.9 1.6<br />
Goods producing- Industries -1.4 20.2 25.0 13.9 -4.7 11.8 8.0 6.8 0.2<br />
Manufacturing -4.2 25.5 29.7 16.5 -5.9 13.7 9.2 7.6 -1.0<br />
Construction 17.1 -2.0 6.1 2.4 1.5 2.4 2.9 2.6 7.7<br />
Services producing-<br />
-0.7 8.8 10.5 7.6 3.9 3.6 2.1 4.4 2.2<br />
Industries Wholesale & Retail Trade -6.0 10.8 15.1 5.0 0.0 -1.4 0.9 1.1 -0.3<br />
Transport & Storage -9.0 3.8 6.0 4.9 4.1 5.1 2.4 4.7 3.5<br />
Hotels & Restaurants -1.6 7.5 8.8 7.2 6.4 5.6 3.3 5.8 4.0<br />
Info & Communications 1.0 2.9 2.9 3.3 2.4 0.9 0.7 1.5 1.7<br />
Financial Services 4.3 10.9 12.2 11.4 10.0 11.6 3.5 9.1 0.8<br />
Business Services 4.3 4.5 5.9 4.4 2.2 1.9 1.9 2.7 3.5<br />
Other Services Industries 5.2 15.7 14.3 15.3 5.0 3.7 2.3 6.7 5.1<br />
Rate of Inflation<br />
May <strong>2012</strong> 2008 2009 2010 2011<br />
Over Over 6.6% 0.6% 2.8% 5.2%<br />
May<br />
2011<br />
April<br />
<strong>2012</strong><br />
5.0% 0.2%<br />
Top 11 Singapore’s Domestic Export destinations in 2011<br />
1) Malaysia 2) PRC 3) HongKong 4) Indonesia 5)United States 6) Panama<br />
7) Australia 8) Japan 9)Taiwan 10)South Korea 11) India<br />
Top 10 Singapore’s Export (Domestic + Re-Export) destinations in 2011<br />
1) Malaysia 2) Hong Kong 3)Indonesia 4)China 5)United States<br />
6) Japan 7) Australia 8) South Korea 9) Taiwan 10) India<br />
Top 10 Singapore’s Import Sources in 2011<br />
1) Malaysia 2) UnitedStates 3)PRC 4) Japan 5) Taiwan 6) SouthKorea<br />
7) Indonesia 8) Saudi Arabia 9) India 10)Thailand
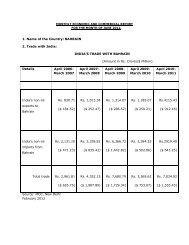
Singapore’s total Trade with India for top 10 items (in thousands S$)<br />
May 2011 May <strong>2012</strong><br />
Imports Exports to Total Imports from Exports to Total Trade<br />
from India India<br />
Trade India<br />
India<br />
1,480,806 740,052 2,220,858 1,128,657 344,095 1,472,752<br />
Principal five global import items of Singapore in May <strong>2012</strong><br />
OTHER PETROLEUM OILS & OILS FROM BITUMINOUS<br />
MINERALS NOT CRUDE & PREPARATIONS NES<br />
CONTAINING BY WEIGHT 70% OR MORE OF<br />
PETROLEUM OILS OR OF OILS OBTAINED FROM<br />
BITUMINOUS MINERALS EXCL THOSE CONTAINING<br />
BIODIESEL & WASTE OILS (HS 271019)<br />
PETROLEUM OILS & OILS FROM BITUMINOUS<br />
MINERALS CRUDE (HS 270900)<br />
OTHER ELECTRONIC INTEGRATED CIRCUITS (HS<br />
854239)<br />
LIGHT OILS & PREPARATIONS CONTAINING BY WEIGHT<br />
70 % OR MORE OF PETROLEUM OILS OR OILS FROM<br />
BITUMINOUS MINERALS (HS 271012)<br />
PROCESSORS & CONTROLLERS CONVERTERS LOGIC<br />
CIRCUITS AMPLIFIERS CLOCK TIMING CIRCUITS OR<br />
OTHER CIRCUITS (HS 854231)<br />
Principal five global domestic export Items of Singapore in May <strong>2012</strong><br />
OTHER PETROLEUM OILS & OILS FROM BITUMINOUS MINERALS<br />
NOT CRUDE & PREPARATIONS NES CONTAINING BY WEIGHT<br />
70% OR MORE OF PETROLEUM OILS OR OF OILS OBTAINED<br />
FROM BITUMINOUS MINERALS EXCL THOSE CONTAINING<br />
BIODIESEL & WASTE OILS (HS 271019)<br />
SHIPS & AIRCRAFT BUNKERS & STORES LOADED ON BOARD FOR<br />
OWN CONSUMPTION (HS 989300)<br />
LIGHT OILS & PREPARATIONS CONTAINING BY WEIGHT 70 % OR<br />
MORE OF PETROLEUM OILS OR OILS FROM BITUMINOUS<br />
MINERALS (HS 271012)<br />
OTHER ELECTRONIC INTEGRATED CIRCUITS (HS 854239)<br />
PARTS & ACCESSORIES OF MACHINES OF 8471 (HS 847330)
Principal five domestic export items of Singapore to India in May <strong>2012</strong><br />
OTHER PETROLEUM OILS & OILS FROM BITUMINOUS MINERALS<br />
NOT CRUDE & PREPARATIONS NES CONTAINING BY WEIGHT<br />
70% OR MORE OF PETROLEUM OILS OR OF OILS OBTAINED<br />
FROM BITUMINOUS MINERALS EXCL THOSE CONTAINING<br />
BIODIESEL & WASTE OILS (HS 271019)<br />
STYRENE (HS 290250)<br />
PARTS & ACCESSORIES OF MACHINES OF 8471 (HS 847330)<br />
SHIPS & AIRCRAFT BUNKERS & STORES LOADED ON BOARD FOR<br />
OWN CONSUMPTION (HS 989300)<br />
P-XYLENE (HS 290243)<br />
Principal five import Items of Singapore from India in May <strong>2012</strong><br />
LIGHT OILS & PREPARATIONS CONTAINING BY WEIGHT<br />
70 % OR MORE OF PETROLEUM OILS OR OILS FROM<br />
BITUMINOUS MINERALS (HS 271012)<br />
OTHER PETROLEUM OILS & OILS FROM BITUMINOUS<br />
MINERALS NOT CRUDE & PREPARATIONS NES<br />
CONTAINING BY WEIGHT 70% OR MORE OF<br />
PETROLEUM OILS OR OF OILS OBTAINED FROM<br />
BITUMINOUS MINERALS EXCL THOSE CONTAINING<br />
BIODIESEL & WASTE OILS (HS 271019)<br />
OTHER MOTOR VEHICLES FOR TRANSPORTING GOODS<br />
WITH COMPRESSION IGNITION INTERNAL<br />
COMBUSTION PISTON ENGINE OF GVW OVER 20T (HS<br />
870423)<br />
OTHER ARTICLES OF JEWELLERY OF OTHER PRECIOUS<br />
METAL (HS 711319)<br />
WORKED NON-INDUSTRIAL DIAMONDS NOT<br />
MOUNTED OR SET (HS 710239)<br />
Monthly trade figures between India and Singapore (in thousands S$)<br />
Trade May 2010 May 2011 May <strong>2012</strong><br />
Total Trade 2,477,086 3,220,463 2,673,227<br />
Sgpr’s Imports 957,352 1,692,081 1,416,486<br />
Sgpr’s Exports# 1,519,734 1,528,382 1,256,741<br />
Sgpr’s Domestic Exports 682,812 651,238 627,043
Sgpr’s Re-Exports 836,922 877,144 629,698<br />
#Total Trade = Imports + Exports, Exports=Domestic Exports+Re-exports<br />
Monthly figures for Singapore’s Global Trade (in thousands S$)<br />
Trade May 2010 May 2011 May <strong>2012</strong><br />
Total Trade# 71,921,817 81,521,460 85,275,715<br />
Sgpr’s Imports 33,300,995 39,265,858 41,627,019<br />
Sgpr’s Exports# 38,620,822 42,255,602 43,648,696<br />
Sgpr’s Domestic Exports 20,140,404 22,849,299 25,150,706<br />
Sgpr’s Re-Exports 18,480,418 19,406,303 18,497,990<br />
Cumulative figures for Singapore’s Global Trade (in thousands S$)<br />
2008 2009 2010 2011<br />
Jan-May<br />
2011<br />
Jan-May<br />
<strong>2012</strong><br />
Total global Trade 927,654,759 747,417,400 902,062,584 974,396,345 396,887,687 419,461,520<br />
%change y-o-y 9.57% -19.43% 20.69% 8.02% 10.62% 5.69%<br />
Singapore's Imports 450,892,588 356,299,229 423,221,839 459,655,129 187,466,132 202,016,026<br />
%change y-o-y 13.87% -20.98% 18.78% 8.61% 10.46% 7.76%<br />
Singapore's Exports 476,762,172 391,118,171 478,840,745 514,741,216 209,421,555 217,445,493<br />
%change y-o-y 5.80% -17.96% 22.43% 7.50% 10.76% 3.83%<br />
Sgpr’s Domestic 247,617,959 200,003,141 248,609,828 281,349,653 113,030,098 123,291,865<br />
Exports %change y-o-y 5.41% -19.23% 24.30% 13.17% 15.29% 9.08%<br />
Singapore’s Re- 229,144,213 191,115,030 230,230,917 22.57% 233,391,563 96,391,457 94,153,628<br />
Exports %change y-o-y 6.22% -16.60% 20.47% 1.37% 5.89% -2.32%<br />
Cumulative figures for India and Singapore Bilateral Trade (In thousands S$)<br />
2008 2009 2010 2011<br />
Jan-May<br />
2011<br />
Jan-May<br />
<strong>2012</strong><br />
Total Bilateral Trade 28,756,963 21,585,714 30,667,496 35,424,915 15,955,483 14,294,029<br />
%change y-o-y 20.52% -24.94% 42.07% 15.51% 35.40% -10.41%<br />
Singapore's Imports 11,922,381 8,156,459 12,566,133 17,770,934 7,928,488 8,228,551<br />
%change y-o-y 35.26% -31.59% 54.06 % 41.42% 60.61% 3.78% %<br />
Singapore's Exports 16,834,582 13,429,255 18,101,363 17,653,981 8,026,995 6,065,477<br />
%change y-o-y 11.89% -20.23% 34.79% -2.47% 17.22%<br />
%$%<br />
-24.44%<br />
%<br />
Sgpr’s Domestic Exports 7,515,094 5,677,674 7,693,906 8,444,911 3,650,225 2,814,085<br />
%change y-o-y 21.38% -24.45% 35.51% 9.76% 21.26% -22.91%<br />
Singapore’s Re-exports 9,319,488 7,751,581 10,407,457 9,209,070 4,376,770 3,251,393<br />
%change y-o-y<br />
5.25% -16.82% 34.26% -11.51% 14.05% -25.71%<br />
Singapore’s Total Global Trade in May <strong>2012</strong><br />
Singapore’s Total global trade in May <strong>2012</strong> increased by 4.6 % on a year-on-year basis, after<br />
the 1.5% increase in the previous month.<br />
Total exports increased by 3.3%<br />
Total imports increased by 6.0%<br />
Non-oil domestic exports (NODX) increased by 3.2%.<br />
Electronic NODX Increased by 3.9%
Non-electronic NODX expanded by 2.8%<br />
Oil domestic exports increased by 22%<br />
Non-Oil Re-Exports (NORX) increased by 3.3%.<br />
Electronic NORX contracted by -1.4%<br />
Non-electronic Re-Exports increased by 8.4%<br />
ECONOMY<br />
PART II - INTERNAL<br />
Singapore's April PMI contracts despite order growth<br />
Singapore's manufacturing activity contracted in April after two months of expansion, hurt by drops in<br />
employment and order backlogs, the latest Purchasing Manager's Index (PMI) showed.But new orders<br />
and export orders continued to strengthen, indicating the pause could be temporary and a recovery in<br />
manufacturing is still on track. Singapore's PMI stood at 49.7 points in April, down from 50.2 points in<br />
March, as per the Singapore Institute of Purchasing & Materials Management (SIPMM). A reading below<br />
50 indicates a contraction in the sector. A separate PMI for Singapore's important electronics sector<br />
stayed in positive territory for the fourth straight month with an April reading of 51.5, unchanged from<br />
March, SIPMM said. The PMI for electronics has now been in positive territory for three straight months.<br />
Asia's factories have been hit by weak demand in the West, particularly from Europe, although conditions<br />
have begun to improve. The Global Manufacturing Purchasing Managers' Index (PMI), produced by<br />
JPMorgan with research and supply management organisations, rose to 51.4 in April from March's 51.1,<br />
as per a recent report.<br />
Singapore's central bank said earlier that the city-state's economic recovery is likely to be muted with<br />
continued weakness in electronics a drag on growth, painting a less rosy picture of the economy<br />
compared with other forecasters. Singapore's PMI is produced ahead of government data on<br />
manufacturing and exports. Economists who cover Singapore say the PMI does not appear to track<br />
activity in pharmaceuticals, which has been Singapore's fastest-growing manufacturing sector in recent<br />
years.<br />
Singapore's economy grows 1.6% in Q1 <strong>2012</strong><br />
The Ministry of Trade and Industry (MTI) announced that the Singapore economy grew by 1.6 per cent on<br />
a year-on-year basis in the first quarter of <strong>2012</strong>, compared to 3.6 per cent in the preceding quarter. On a<br />
quarter-on-quarter seasonally-adjusted annualised basis, the economy expanded by 10.0 per cent,<br />
reversing the 2.5 per cent contraction in the previous quarter. The improved growth momentum was<br />
largely attributable to the upturn in the manufacturing sector. The manufacturing sector expanded by an<br />
annualised rate of 19.8 per cent, reversing the 11.1 per cent contraction in the previous quarter. This<br />
turnaround was driven by increased production across all key manufacturing clusters, notably electronics<br />
and precision engineering. Going forward, the recovery in the global economy is viewed to remain fragile<br />
and vulnerable to downside risks. Considerable downsides for the global economy and Singapore's<br />
externally oriented industries may occur if the uncertainty surrounding the Eurozone's political climate and<br />
fiscal outlook materializes. MTI is maintaining the economic growth forecast for <strong>2012</strong> at 1.0 to 3.0 per<br />
cent.<br />
Q1 services sector receipts up 6.8%<br />
BUSINESS receipts in Singapore's services sector grew in the first quarter of <strong>2012</strong>, creating a more<br />
positive outlook for the sector compared to manufacturing activity data also released yesterday.<br />
Compared to the corresponding period last year, business receipts for the services sector expanded by<br />
6.8 per cent for the first three months of this year. In comparison with the first quarter of 2011, all services<br />
sectors did well this time around, with health & social services and recreation & personal services<br />
industries chalking up double-digit growth of 13.7 per cent and 11.3 per cent respectively. The showing by
the recreational & personal services industry was in particular noteworthy as its earnings grew<br />
significantly from the 3.9 per cent increase it had recorded in the previous quarter year-on-year.<br />
Business services, excluding real estate, rental & leasing, generated an 8.9 per cent increase in receipts<br />
in the first quarter of <strong>2012</strong>, while receipts for transport & storage rose by 8.4 per cent; financial and<br />
insurance by 5.1 per cent; real estate, rental & leasing by 4.7 per cent; information & communications by<br />
4.1 per cent; and education services by 3.3 per cent. Although revenue for the education sector grew the<br />
slowest among all other services sectors during this period, it was a marked improvement from its<br />
showing in the previous quarter when its earnings had contracted by 3.4 per cent year on year.<br />
Despite this, overall growth in business receipts in the services sector in the first quarter of <strong>2012</strong> from the<br />
previous quarter was only marginal at one per cent. On a quarterly basis, services industries which<br />
recorded higher business receipts from the last three months of 2011 included education services at 20.9<br />
per cent, recreation & personal services at 6.2 per cent, health & social services at 5.9 per cent, financial<br />
& insurance at 5.1 per cent and information & communications at a modest 1.4 per cent. Sectors that<br />
declined in receipts compared to the previous quarter were business services, excluding real estate,<br />
rental & leasing, by 6 per cent, transport & storage services by 2.4 per cent and real estate, rental &<br />
leasing services by 2 per cent.<br />
Trade Ministry keeps to forecast of 1-3% growth<br />
The risks of slower growth have intensified with another flare-up of the eurozone debt crisis, the Ministry<br />
of Trade and Industry (MTI) said , as it stuck to its forecast that Singapore will grow one to 3 per cent this<br />
year. Despite a good first quarter, the authorities "remain cautious" about Singapore's growth outlook as<br />
talk of a possible Greek exit from the eurozone fans fears of a disorderly sovereign debt default. Signs of<br />
fragility in the US recovery and lacklustre export growth in Asia add to that external uncertainty too, MTI<br />
permanent secretary Ow Foong Pheng said. The Singapore economy grew 1.6 per cent in Q1 from a<br />
year ago, below the consensus market forecast of 1.8 per cent but in line with April's advance estimates.<br />
Manufacturing anchored the pick-up in growth momentum. The economy grew 10 per cent quarter-onquarter<br />
in seasonally adjusted, annualised terms, reversing Q4's 2.5 per cent contraction. The 19.8 per<br />
cent q-o-q rise in industrial production beat advance estimates and reversed an 11.1 per cent drop in Q4,<br />
with notable jumps in electronics and precision engineering output. Construction too, outdid advance<br />
estimates to grow 32.1 per cent sequentially. But services grew 4 per cent in sequential terms, less than<br />
advance estimates suggested. Wholesale and retail trade shrank, while sluggishness in fund<br />
management activities led to a sequential contraction in the finance and insurance sector for a second<br />
straight quarter. Economists, whose forecasts mostly surpass or fill the top-end of the official forecast<br />
range, believe that positive growth momentum will hold up - for several reasons. The official composite<br />
leading index, which correlates with GDP performance of the next quarter, rose a stronger 2.9 per cent in<br />
seasonally adjusted quarter-on-quarter terms in Q1, up from 1.2 per cent in Q4. IE Singapore also<br />
reported a better-than-expected rise in April's non-oil domestic exports. While pencilling in gradual<br />
improvements in growth, some economists are now more cautious too. Developments in Spain, which slid<br />
back into recession yesterday, are also being watched closely, Mrs Ow added. Maybank economist<br />
Saktiandi Supaat's 3 per cent growth forecast does not account for a Greek default and, in fact, assumes<br />
faster exports growth in the second half on the back of some recovery in the eurozone core. But recovery<br />
there and elsewhere looks shaky, MTI said. As the drama over Greece unfolds, ongoing fiscal austerity<br />
and bank deleveraging will keep eurozone demand sluggish. US employment growth appears to be losing<br />
momentum and, this being an election year, an uncertain fiscal outlook may hit business confidence and<br />
investment, Mrs Ow said. These external headwinds mean Asia's exports are likely to suffer too, despite<br />
rising domestic demand, she added.<br />
Inflation to stay around 5%, taper off in H2<br />
Inflation is tipped to stay around 5.0 per cent in the next few months before reducing in the second half of<br />
the year to bring the rate to 3.5-4.5 per cent for <strong>2012</strong>, Trade and Industry Minister Lim Hng Kiang<br />
said.The Consumer Price Index (CPI) hit a 5.2 per cent high in March and 4.9 per cent for the first three<br />
months of the year. Mr Lim said the increase in prices in the coming months will in any case not hit
consumers hard because imputed rentals on owner-occupied accommodation and car prices are likely to<br />
be the two biggest contributors to the hike in the CPI. Together, the increase in rentals and COE<br />
(Certificate of Entitlement) premiums for vehicles are expected to account for over half of this year's<br />
inflation. The Monetary Authority of Singapore has tightened further its monetary policy stance through a<br />
stronger Singapore dollar to keep imported inflation in check and to ease external demand for Singapore<br />
exports. So steps have been taken to cool the property market and to raise productivity. The government<br />
will also be looking at ways to ease the Certificate of Entitlement supply. Mr Lim said the government will<br />
also soften the impact of the rising cost of living through cash grants.<br />
EMPLOYMENT<br />
Jobless rate inches up to 2.1% in March<br />
AFTER hitting a 14-year low of 2 per cent in December, the unemployment rate unexpectedly crept up in<br />
March to 2.1 per cent, according to the latest employment figures released by the Ministry of Manpower.<br />
The number of jobs created fell to 27,400 in the first three months of the year, from a seasonal high of<br />
37,600 in the final quarter of 2011 and 28,300 in the first quarter of last year, says the Employment<br />
Situation First Quarter <strong>2012</strong> report. Economists in the private sector had expected the jobless rate to stay<br />
unchanged at 2 per cent. The higher unemployment rate and lower employment creation led many to<br />
conclude that the tight market has finally begun to ease.<br />
While ongoing tightening of foreign worker inflows may have played a part in the jobs slowdown, a<br />
slowdown in demand for labour may have been the dominant factor. The good news is that the number of<br />
workers made redundant, including those laid off, came down to 2,700 after hitting 3,250 in the December<br />
quarter. The new figure is closer to the 2,750 displaced in the first quarter of 2011.<br />
With the unemployment rate at 2.1 per cent, Singapore is still in a full-employment situation - and better<br />
off than most countries.<br />
Construction still posted a strong increase of 800 jobs in the first quarter. Manufacturing jobs dipped 500,<br />
but the losses have eased from the 1,400 recorded in the previous quarter. Manufacturing also<br />
retrenched fewer workers (800) in the first quarter, after a big cutback in the fourth quarter (1,660) of<br />
2011. This more than offset the increases in layoffs in services (from 1,360 to 1,600) and construction<br />
(from 240 to 300). The jobless rate for residents rose from 2.9 per cent in December 2011 to 3 per cent in<br />
March, while the rate for citizens went up from 3 per cent to 3.2 per cent. "Even with the increase, the<br />
rates were still substantially lower than the high of 3.3 per cent overall and 4.9 per cent for residents and<br />
citizens experiences in September 2009 during the last recession," the Ministry of Manpower says in its<br />
report.<br />
MANUFACTURING<br />
Manufacturing sentiment positive for April-Sept: poll<br />
AFTER a slow first quarter, Singapore manufacturers expect business conditions to improve but service<br />
providers are less upbeat on the outlook for April to September <strong>2012</strong>. Some 19 per cent of the 414<br />
manufacturing establishments surveyed, weighted by output and employment, foresee an improved<br />
outlook in the next six months of <strong>2012</strong>. On the other hand, 4 per cent expect a deterioration in business<br />
conditions here, resulting in a net weighted balance of 15 per cent of manufacturers upbeat on conditions<br />
improving during this period. This is a vast improvement in sentiment from the previous quarter where 11<br />
per cent of manufacturers projected a deterioration in the business outlook. The positive business<br />
sentiment, as indicated by the Economic Development Board's (EDB) latest quarterly poll, is broad-based<br />
with all manufacturing clusters expecting better business conditions. The electronics sector is most<br />
upbeat, with a net weighted balance of 30 per cent projecting an improved business climate. It is led by<br />
the semiconductor segment, which sees stronger chip demand as inventory levels are revised<br />
downwards, EDB said.<br />
The general manufacturing sector is also optimistic with a net weighted balance of 19 per cent indicating<br />
an improving environment. This was buoyed by an expected increase in demand from the construction<br />
sector, according to EDB, which provided reason for optimism for the other manufacturing industries
cluster in particular. Similarly, some 9 per cent of firms in each of the precision engineering and chemical<br />
clusters project an improvement, with semiconductor equipment, bonding wire and connector makers the<br />
most optimistic within precision engineering. Firms in the chemical cluster expressed cautious optimism,<br />
however, as they are mindful of possible margin erosions due to high raw materials prices. The overall<br />
optimism is reflected in expectations for output and employment. Compared to Q1, a net weighted<br />
balance of 22 per cent expect output to increase in Q2 while a net weighted balance of 8 per cent plan to<br />
increase employment in the next three months. While a weighted 45 per cent reported no constraints in<br />
obtaining direct export orders in Q2, a weighted 47 per cent that indicated export constraints cited price<br />
competition from overseas competitors and economic and political conditions abroad as the most<br />
important limiting factors. Within the services sector, the 1,500 firms surveyed seem less upbeat across<br />
sectors, with only a net weighted 6 per cent seeing better prospects. While a weighted 21 per cent predict<br />
a better business outlook and a weighted 15 per cent expect the opposite, the majority expect the<br />
business situation to remain unchanged, the Department of Statistics said. Firms in the recreation,<br />
community & personal services industry are the most optimistic, with a net weighted balance of 26 per<br />
cent of firms reporting a positive business outlook, with firms in the accommodation, wholesale trade and<br />
information & communications also being significantly upbeat. Firms in the real estate industry are<br />
generally cautious while the retail trade expressed significant pessimism, with retailers of motor vehicles,<br />
in particular, expect the reduced Certificate of Entitlement quota to hit business. Overall, a net weighted<br />
balance of 9 per cent of firms in the services sector predicts higher employment for the second quarter<br />
<strong>2012</strong>, indicating that the sector will still be hiring during this period.<br />
AVIATION<br />
Changi Airport passenger traffic up 12.7% in April<br />
Singapore Changi Airport (Changi) announced an increase in April passenger traffic to 4.21 million, up<br />
12.7 per cent from 3.73 million a year ago. Passenger traffic improved year-on-year across all regions<br />
with routes to and from the Middle East, South Asia, Northeast Asia and Southeast Asia achieving strong<br />
results. Commercial aircraft movements increased correspondingly by 8.8 per cent to 26,410 movements,<br />
from 24,266 movements a year ago. Due to the current downturn faced by most export markets around<br />
the world, Changi handled a 4.9 per cent decrease in cargo volume to 148,243 tonnes, compared to<br />
155,812 tonnes a year ago.<br />
In the same media release, Changi announced a new shuttle bus service to terminal 3 from the Bedok<br />
MRT bus stop every weekend and during public holidays. This is in addition to the shuttle service that<br />
connects the airport to Sengkang MRT station also on weekends and public holidays.<br />
TRADE & INVESTMENT<br />
Update: Singapore April export rise hides weak regional outlook<br />
Singapore exports rose more than expected in April due to a surge in pharmaceuticals but softness in<br />
electronics, a mainstay of manufacturing in many Asian economies, points to a likely slowdown in<br />
regional growth as China's economy cools. In Singapore, electronics account for about one-third of its<br />
exports of domestically produced goods excluding oil. The city-state said its non-oil domestic exports<br />
grew 8.3 per cent in April from a year ago, beating the consensus forecast of 6.9 per cent growth and<br />
turning around from March's 4.3 per cent year-on-year contraction. Electronics, however, grew by just 1<br />
per cent last month, while electronics re-exports - an indicator of regional trade flows - shrank 5.2 per cent<br />
year-on-year following a 5.5 per cent decline in March. Singapore is one of the world's largest<br />
transhipment centres and many of the region's products are moved to Singapore before they are shipped<br />
further afield.
URA signs urban planning MOU with Abu Dhabi<br />
PART III - EXTERNAL<br />
The Urban Redevelopment Authority (URA) has signed a memorandum of understanding with the Abu<br />
Dhabi Urban Planning Council (UPC) to formalise co-operation in the areas of land use and urban<br />
planning. Under the agreement, the two agencies will organise mutual visits, training courses and staff<br />
exchange programmes to facilitate the sharing of ideas, best practices and experiences in urban planning<br />
and development. The MOU also covers organising forums that will provide opportunities for private<br />
sector companies in Singapore to participate in sharing and networking sessions with key stakeholders of<br />
the planning and development industry in Abu Dhabi. The MOU follows an official visit by the UPC to<br />
URA in February this year and a reciprocal visit by URA to the Abu Dhabi planning authority recently.<br />
Singapore signs air service deal with Colombia<br />
Under the ASA, airlines of both Singapore and Colombia will have the flexibility to operate any number of<br />
direct passenger services between both countries. In addition, both countries' airlines can also operate,<br />
under certain restrictions, up to seven weekly passenger services and seven weekly cargo services<br />
between and beyond both countries. The ASA was signed by Singapore's Acting Minister for Foreign<br />
Affairs and Minister for Transport, Lui Tuck Yew, and Colombia's Minister of Foreign Affairs, María Ángela<br />
Holguín Cuéllar, at the sidelines of Colombian President Juan Manuel Santos Calderón's State Visit to<br />
Singapore from 6 to 8 May <strong>2012</strong>.<br />
Singapore and Bogota to share transport know-how<br />
Singapore will share its traffic management experience and know-how with Bogotá. Under a<br />
Memorandum of Understanding (MOU) signed in the Colombian capital, by the International Enterprise<br />
(IE) Singapore and the Ministry of Transport of the Republic of Colombia, a study will be conducted to<br />
improve the integration and efficiency of Bogotá's transport system amid rapid urbanisation. Colombia's<br />
Minister of Transportation Germán Cardona Gutiérrez said the MOU would tap Singapore's experience in<br />
building an efficient transport system despite limited land resources. " A team of transportation experts<br />
from Singapore will examine traffic conditions in the Colombian capital and devise a Traffic Demand<br />
Management (TDM) action plan. At the end of the study, they will recommend policies, infrastructure<br />
development and TDM strategies. Bogotá has received international recognition for the transformation of<br />
the city's transport network, which started in the mid-1990s. Since 2005, governments from at least 200<br />
cities have visited the city to learn about its transportation initiatives. One of its initiatives is the<br />
introduction of the Bus Rapid Transit Systems, the only large transportation project with approval by the<br />
United Nations to generate and sell carbon credits.<br />
S'pore, China set up services work group<br />
Underscoring close economic relations, China and Singapore will now explore the setting up of a new<br />
work group to facilitate collaboration in the services sector. This agreement emerged from the third<br />
Singapore-China Investment Promotion Committee (IPC) Meeting which was chaired by Singapore's<br />
Minister for Trade and Industry Lim Hng Kiang and China's Minister of Commerce Chen Deming.<br />
At the Beijing meeting, both ministers also discussed ways to further cooperation, specifically in the area<br />
of trade in services, and facilitating Chinese enterprises to internationalise their businesses through<br />
Singapore. Singapore, too, is keen to participate in China's growing services sectors such as health care<br />
and education. Singapore and China enjoy strong bilateral economic relations. In 2011, bilateral trade<br />
grew 6.4 per cent from the year before to reach $101.4 billion. Trade in services export has grown<br />
significantly in recent years. Currently, China is Singapore's third largest services export destination by<br />
country, and a fast growing one. Export of services to China increased by nearly five times over the last<br />
decade from $1.3 billion in 2001 to $7.4 billion in 2010. Key sectors include transportation services,<br />
financial and insurance, and business services. During the IPC meeting, Singapore and China also
discussed the upcoming review of the China-Singapore Free Trade Agreement (CSFTA) in June, to<br />
further improve its quality and smoothen its implementation.<br />
SBF inks MOU with Sri Lanka business community<br />
The Singapore Business Federation (SBF) signed a memorandum of understanding with the Sri Lanka<br />
Singapore Business Council of the Ceylon Chamber of Commerce (SLSBC), to promote the development<br />
of closer trade and economic relations. This follows the MOU signed between SBF and Sri Lanka Board<br />
of Investment in February, aimed to deepen collaboration between the private sectors and strengthen<br />
institutional relations between both countries.<br />
Asean+3 set to double swap fund size<br />
CHINA, South Korea, Japan and the 10 members of the Association of Southeast Asian Nations (Asean)<br />
are expected to announce an agreement on doubling the size of their regional currency swap deal to<br />
US$240 billion. The finance ministers and central bank governors of these 13 countries met in Manila for<br />
a meeting, at the end of which they are likely to release a joint statement approving an earlier proposal by<br />
their deputies to increase the Chiang Mai Initiative Multilateralisation (CMIM) fund. The fund - launched<br />
two years ago in an attempt to avoid a repeat of the kind of liquidity crisis that struck South-east Asia in<br />
1998 - currently stands at US$120 billion. Singapore will be represented by Deputy Prime Minister and<br />
Finance Minister Tharman Shanmugaratnam, according to a joint statement yesterday from the Ministry<br />
of Finance and the Monetary Authority of Singapore (MAS). Collectively known as the Asean+3, the 13<br />
countries are also expected to agree on making themselves less dependent on larger entities such as the<br />
International Monetary Fund (IMF), according to a Dow Jones report that quoted portions of a draft of the<br />
joint statement.<br />
The plan is to increase the amount that each country can tap for support to 30 per cent this year, up from<br />
20 per cent currently, without having to have a parallel aid package in place from the IMF. Asian<br />
Development Bank president Haruhiko Kuroda said that he believed the worst of the eurozone debt crisis<br />
was over, adding that he did not expect any serious impact on Asian economies from Europe's financial<br />
problems in the near future. Therefore, he said that assistance measures for Asia such as the CMIM and<br />
the Asian Development Fund were "sufficient" to help Asian economies cope for the time being.<br />
PART IV BILATERAL<br />
Telenor may leave India as fee spat spurs write-off<br />
Telenor says it may have to exit India, the world's second-largest mobile market, after the country's<br />
telecommunications regulator proposed an 11-fold increase in licence fees. Fornebu, Norway-based<br />
Telenor will write down its remaining fixed and intangible assets in India amounting to 3.9 billion kroner<br />
(S$840 million) as a "precautionary measure", the company, the Nordic region's biggest phone operator,<br />
said in a separate statement. At stake is Telenor's 140 billion rupee (S$3.2 billion) investment in India,<br />
and the fate of its more than 40 million customers. Investors have called on Telenor to pull out of the<br />
country. Telenor's licences in India were cancelled in February, and the regulator later recommended<br />
reauctioning the spectrum at higher prices.<br />
West Bengal rolls out schemes to woo S'pore investments<br />
Underlining the appeal of Singapore in India, the state of West Bengal is courting more businesses and<br />
investments from here.
West Bengal's Minister for Industries Partha Chatterjee invited companies from Singapore to invest in<br />
infrastructure, information communication & technology, textile, engineering, energy, biotechnology,<br />
banking & finance and agro-food processing in his state.<br />
He said that his government has come up with several schemes to make it more attractive for<br />
Singaporean businesses to consider the state as an investment destination. He added that because of its<br />
location, the state is an entry point to markets in South-east Asia. The minister also stressed that the<br />
state government has introduced several initiatives in the last one year to provide a streamlined, focused,<br />
hassle-free and modern business environment. These include the "Shilpa Bandhu" or the State<br />
Investment Facilitation Centre (SIFC) as the nodal agency for single-window clearances in West Bengal.<br />
He called on the Singapore business community to look at West Bengal as the next investment<br />
destination.<br />
Bharti close to buying Qualcomm unit: sources<br />
Qualcomm Inc is asking Bharti Airtel Ltd, India's largest mobile-phone operator, to pay about 50 billion<br />
rupees (S$1.16 billion) for its Indian unit as the two companies seek to conclude talks in the next two<br />
weeks, according to two people with knowledge of the matter. Bharti may purchase the unit in instalments<br />
over two years, the people said, declining to be identified as the details are private. Under the plan, Bharti<br />
would initially purchase a 26 per cent stake in the unit, currently held by Tulip Telecom Ltd and Global<br />
Holding Corp, and Qualcomm will own 51 per cent of the division for at least two years after that.<br />
Qualcomm, the biggest maker of mobile-phone chips, bought frequency licences in cities including New<br />
Delhi and Mumbai in June 2010, paying 49.1 billion rupees for spectrum that allows handset users to<br />
download video at greater speeds. The San Diego, California-based company was allocated spectrum<br />
this month, two years after paying for the airwaves, people with knowledge of the matter said on May 8.<br />
Mobile-phone operators in India including Bharti Airtel and Vodafone Group Plc are trying to boost<br />
revenue by selling services such as video streaming as incomes rise. The number of smartphones sold in<br />
India almost doubled last year to 11 million, according to data compiled by Bloomberg. Tulip Telecom and<br />
Global Holding paid 1.4 billion rupees each for their 13 per cent stakes in Qualcomm's Indian unit in 2010.<br />
Qualcomm owns the remaining 74 per cent.<br />
ST Kinetics files writ petition against Indian authorities to challenge ban<br />
After being blacklisted from conducting any business with the defence authorities in India, Singapore<br />
Technologies Kinetics has hit back. It filed a writ petition in the High Court of Delhi against the Indian<br />
Ministry of Defence (MoD) and the Indian Ordnance Factory Board (OFB), challenging the ban.<br />
In a statement issued on the Singapore Exchange website, ST Kinetics, the land systems and specialty<br />
vehicles arm of Singapore Technologies Engineering, said the writ petition seeks, among other things, the<br />
quashing of the debarment order issued by OFB. As announced in March, the debarment order dated<br />
March 5 this year ordered "the cancellation of all agreements" with ST Kinetics, specifically a Non-<br />
Disclosure Agreement signed on Aug 11, 2008, with the OFB, and debarred ST Kinetics from entering<br />
into any contract with the OFB for a period of 10 years. On March 12, the OFB clarified that, instead of<br />
being debarred from entering into any contract with the OFB for a period of 10 years, ST Kinetics would<br />
be debarred from further business dealings with the OFB for a period of 10 years. In response to this, ST<br />
Kinetics had filed a petition in the Supreme Court of India to refer to arbitration a show cause notice dated<br />
Feb 4, 2011, issued by the OFB to ST Kinetics, which the company said is listed for hearing on Aug 13,<br />
<strong>2012</strong>. The company explained that, according to Indian counsel, in light of the debarment order and the<br />
new writ petition, the arbitration petition has now become irrelevant. This is because ST Kinetics will now<br />
pursue its remedies with regard to the debarment order under the writ petition, and therefore the company<br />
said in its statement that it will be withdrawing the arbitration petition due to its irrelevance. In a BT report<br />
in March, ST Kinetics had expressed concern over the fairness of the legal process after it was implicated<br />
in a corruption case involving a high-ranking Indian official. This eventually saw the company receiving a<br />
disbarment order from doing business with the Ordnance Factory Board (OFB). ST Kinetics was<br />
blacklisted following initial investigations conducted by India's Criminal Bureau of Investigation (CBI),<br />
which was probing Sudipta Ghosh, the former director-general of OFB, over the award of defence
contracts. Ghosh has since been charged with corruption. No charges have been levelled against ST<br />
Kinetics, but it found itself being barred from doing business with OFB according to the official order then.<br />
The company reiterated in its statement yesterday that it has never won any defence contracts in India<br />
and that this development has no impact on ST Kinetics' defence business as India has not been a<br />
market for its defence export sales.<br />
Annexures to MCR for the Month of May, <strong>2012</strong><br />
1. Trade enquiries received from Singapore (Annexure I)<br />
2. Trade enquiries received from India (Annexure II to IIA)<br />
3. Summary of India-Singapore Trade: Monthly trends<br />
4. Singapore’s Total Global Trade (Top 10 Products)<br />
5. Singapore Global Imports (Top 10 Products)<br />
6. Singapore Global Exports (Top 10 Products)<br />
7. Singapore’s Imports from India (Top 10 Products)<br />
8. Singapore’s Exports to India (Top 10 Products)
Annexure 1<br />
Singapore<br />
….<br />
Trade enquiries from Singapore for the month of May, <strong>2012</strong><br />
……..<br />
S.No. Nature of Enquiry No. of Enquiries<br />
1 Set up Branch Office in India (Logistics<br />
Business)<br />
1<br />
Mr H K Tan<br />
Morrison Express Logistics Pte Ltd<br />
7 Airline Road #04-09 Cargo Agents<br />
Building E, Singapore 819834<br />
Tel: 65456233<br />
Mobile: 65-96990444<br />
Email: hiongkuang_tan@morrisonexpress.com<br />
2 Others (investment, PAN, customs duties, setting up<br />
company, etc.)<br />
60<br />
Total 61
Annexure II<br />
Singapore<br />
Trade Enquiries received from India May <strong>2012</strong><br />
S.No Products Sector Code<br />
No. of<br />
Enquiries<br />
1 Business Chambers/Trade<br />
Associations<br />
2 Agricultural & Allied 18<br />
3 Marine<br />
4 Metals, Ores & Minerals/Stones 4<br />
5 Leather & Manufacturers 2<br />
6 Gems & Jewellery 5<br />
7 Sports Goods<br />
8 Chemicals & Pharmaceuticals 4<br />
9 Engineering Goods 2<br />
10 Electronics & Computers ( IT ) 2<br />
11 Building Material 2<br />
12 Textiles 6<br />
13 Handicrafts/Gifts 5<br />
14 Carpets<br />
15 Stationery & Paper Products 2<br />
16 Others 26<br />
17 Telephonic Enquiries 250
Total No of Enquiries 328<br />
Annexure II A<br />
Enquiries for the Month of May <strong>2012</strong><br />
S.no Company Details Products Under Offer for Exports<br />
1 Mr. Kushal Tanwar Paper Products<br />
PUGMARK PRINTWORX PVT. LTD.<br />
New Delhi, India<br />
Email: 'kushaltanwar@pugmark.org.in'<br />
2 Mr. Kushal Tanwar Gift Items<br />
PUGMARK PRINTWORX PVT. LTD.<br />
New Delhi, India<br />
Email: 'kushaltanwar@pugmark.org.in'<br />
3 Mr. Kushal Tanwar Printing Companies<br />
PUGMARK PRINTWORX PVT. LTD.<br />
New Delhi, India<br />
Email: 'kushaltanwar@pugmark.org.in'<br />
4 Email: 'madhurakali25@yahoo.in' Organic Products<br />
5 Email: 'madhurakali25@yahoo.in' Fresh Fruis & Vegetables<br />
6 Email: 'madhurakali25@yahoo.in' Spices<br />
7 Mr. Kamlesh Khambhatta Pharmaceutical Machinery<br />
Sonus International<br />
Ahmedabad-6, India<br />
Email; info@sonus.in<br />
8 NeoTex Spinning Pvt Ltd Polyester Yarn<br />
Gandhinagar-7 (Gujarat), India<br />
Email:<br />
'aashaka@neoagrofoodsexports.com'
9 NeoTex Spinning Pvt Ltd Spices, Pulses<br />
Gandhinagar-7 (Gujarat), India<br />
Email:<br />
'aashaka@neoagrofoodsexports.com'<br />
10 NeoTex Spinning Pvt Ltd Indian Grocery Items<br />
Gandhinagar-7 (Gujarat), India<br />
Email:<br />
'aashaka@neoagrofoodsexports.com'<br />
11 Ms. Sanghvi Agro Commodities<br />
VIBGYOR AGRO COMMODITIES<br />
Email; 'peanuts@vibgyoragro.com'<br />
12 Mr. Pradeep Kumar Natural Stones<br />
Smartstone Private Limited<br />
Email;'pradeep@smartstoneindia.net'<br />
13 Mr. Abbas A Kassim Agri Commodities<br />
EmaiL; 'abbas_kassim2000@yahoo.com'<br />
14 K P Group of Companies Pesticide, Fungicide<br />
Ahmedabad-15 (Gujarat), India<br />
Email; 'kk.p.office@gmail.com'<br />
15 K P Group of Companies Dyes<br />
Ahmedabad-15 (Gujarat), India<br />
Email; 'kk.p.office@gmail.com'<br />
16 Mr. Hari Textiles, Garments<br />
GODAVARI VILLAGE CRAFTS<br />
Andhra Pradesh, India<br />
Email: 'challahari@rediffmail.com'<br />
17 Mr. Hari Fashion Accessories<br />
GODAVARI VILLAGE CRAFTS<br />
Andhra Pradesh, India<br />
Email: 'challahari@rediffmail.com'<br />
18 Email; 'hicureindia@yahoo.com' Personal & Health Care Products<br />
19 Mr. Shishir Kothari Plastic Closures<br />
Cap & Seal (Indore) Pvt. Ltd.<br />
Indore-1 (Madhya Pradesh), India
Email: 'shishir@capandseal.com'<br />
20 Mr. Joe Fresh Fruits & Vegetables<br />
Aruns International<br />
Trichy (Tamil Nadu), India<br />
Email; joeindia16@gmail.com<br />
21 Mr. Joe Flowers<br />
Aruns International<br />
Trichy (Tamil Nadu), India<br />
Email; joeindia16@gmail.com<br />
22 Mr. Selva RJ Handicrafts<br />
Shine International<br />
Email; smeshine@gmail.com<br />
23 Mr. Selva RJ Coconut Products<br />
Shine International<br />
Email; smeshine@gmail.com<br />
24 Mr. Selva RJ Knitted Garments<br />
Shine International<br />
Email; smeshine@gmail.com<br />
25 Mr. Selva RJ Spices<br />
Shine International<br />
Email; smeshine@gmail.com<br />
26 Mr. Selva RJ Candles<br />
Shine International<br />
Email; smeshine@gmail.com<br />
27 Mr. S.M.MUSHTHAQ AHMED Agri & Leather Goods<br />
Email; 'starexports786@yahoo.com'<br />
28 Email; 'sbossexports@yahoo.in' Agri Goods<br />
29 Mr. K M Jha Alcoholic Beverages<br />
Bhopal-21, India<br />
Email; 'jhakm@somindia.in'<br />
30 Mr. Dhaval Hiarapara Auto Parts<br />
Noble Impex
Rajkot-2 (Gujarat), India<br />
Email; nobleimpex88@gmail.com<br />
31 Email; 'jaggiexim@gmail.com' Agri Goods<br />
32 Email; 'jaggiexim@gmail.com' Jute Bags<br />
33 Mrs. Archana Garments<br />
Email; 'twinsexports<strong>2012</strong>@yahoo.com'<br />
34 Mr. Vinayak Rajpurohit Fabrics<br />
SONALE FABRICS PVT. LTD<br />
Email: 'sonalefabrics@yahoo.com'<br />
35 Mr. Vishal Tiwari Pharmaceuticals<br />
Elder Pharmaceuticals Ltd<br />
Email; vishaltiwari@elderindia.com<br />
36 Mr. Vishal Tiwari Personal & Health Care Products<br />
Elder Pharmaceuticals Ltd<br />
Email; vishaltiwari@elderindia.com<br />
37 Mr. John Jute Bags<br />
FLYMAX EXIM<br />
Ahmedabad-6, India<br />
Email: export@flymaxexim.com<br />
38 Mr. Nilesh Mehta Auto Parts<br />
Maruti International<br />
Email: export@marutiinternational.in<br />
39 Ms. Neha Gohar Fasteners<br />
Canco Fasteners<br />
New Delhi-29, India<br />
Email: nehagohar@hotmail.com<br />
40 Email; 'redocean008@aol.in' Fresh Fruits & Vegetables<br />
41 Mr. J P Gupta Wines<br />
Nirvana Biosys<br />
Email; 'pankaj@nirvanabiosys.com'<br />
42 Mr. Devaraju Fresh Onions & Potatoes
Dev International<br />
Coimbatore, India<br />
Email: info@dev-international.in<br />
43 Rk Exports Fresh Fruits & Vegetables<br />
Coimbatore, India<br />
Email: 'rkexports<strong>2012</strong>@gmail.com'<br />
44 Mr. Kailash Chand Soni Jewellery<br />
Best Gems<br />
Jaipur-2, India<br />
Email: bestgemsjaipur@gmail.com<br />
45 Leela Mony Bicycles<br />
Eastman Industries Ltd<br />
Ludhiana (Punjab), India<br />
Email: leela@eastmanglobal.com<br />
46 Mr. Agilam Jeyabalen Handicrafts & Textiles<br />
EmaiL; 'airnets@sify.com'<br />
47 Mr. Agilam Jeyabalen Indian Grocery Items<br />
EmaiL; 'airnets@sify.com'<br />
48 Mantra M Kansara Fresh Fruits & Vegetables, Rice, Wheat Flour<br />
Mukrash Exims<br />
Ahmedabad, India<br />
Email: exim.mukrash@gmail.com<br />
49 Mr. Mahalingam Edible Oil<br />
Email: 'aglobalconnector@gmail.com'<br />
50 Mr. Vijaya Baskaran Indian Grocery Items<br />
Siva Exports<br />
Madurai-9, India<br />
Email; sivaexportsindia@gmail.com<br />
51 Ms. Arpita Maheshwari Dried Fruits & Vegetables<br />
Shreeji Protein & Shreeji Dehydrates<br />
Exports<br />
Email: 'sales@shreejiprotein.com'<br />
52 Mr. V Ganesan Spices
Email; 'akilinternational@yahoo.com'<br />
53 Mr. Shashwat Devbrat Rapeseed Oil, Canola Oil & other Edible Oil<br />
iValue Consulting Pvt. Ltd.<br />
Gurgaon-2 (Haryana), India<br />
Email;sdevbrat@ivalueconsulting.com<br />
54 Nensi Khatri Textiles, Garments & Apparels<br />
Veer Import & Export<br />
Email: nensi.maniyar@gmail.com<br />
55 Vave globals Gift Items & Handicrafts<br />
Email; 'vaveglobals@gmail.com'<br />
56 Mr. A Srinivasan Stationery Products<br />
Chennai-8 (Tamil Nadu), India<br />
Email; 'asvimpex.<strong>2012</strong>@gmail.com'<br />
57 Mr. A Srinivasan Building Material<br />
Chennai-8 (Tamil Nadu), India<br />
Email; 'asvimpex.<strong>2012</strong>@gmail.com'<br />
58 Mr. A Srinivasan Spices<br />
Chennai-8 (Tamil Nadu), India<br />
Email; 'asvimpex.<strong>2012</strong>@gmail.com'<br />
59 Mr. G Jayaraman Auto Parts<br />
New Allenberry Works<br />
Faridabad-1211003, India<br />
Email; gj@nawgears.com<br />
60 Sunita Exports Agri Products<br />
Mumbai-92, India<br />
Email: 'sunitaexports@yahoo.in'<br />
61 Sunita Exports Veterinary Products<br />
Mumbai-92, India<br />
Email: 'sunitaexports@yahoo.in'<br />
62 Mr S K Jain Surgical & Medical Products<br />
Shree Shantinath industries<br />
Ambala Cantt-1, India<br />
Email: 'skj22678@gmail.com'
63 Mr. Sivankutty Organic Fertilizer<br />
NATIONAL ORGANIC FERTILIZER<br />
Ahmedabad-54 (Gujarat), India<br />
Email; export@noforganic.com<br />
64 Mr. Arun Kumar Yarn & Fabrics<br />
TT Limited<br />
New Delhi, India<br />
Email; 'arunsharma@tttextiles.com'<br />
65 Mr. K S Shashidhar Incense Sticks<br />
Email: indialinguistic@live.com<br />
66 Mr. Abhishek Mishra Processed Food<br />
Swapna Overseas<br />
Ahmedabad, India<br />
Email: 'abh.iiftr@gmail.com'<br />
67 Email; 'exports@anjalifoods.com' Agri Products (Rice,Pulses,Spices,Pickles)<br />
68 Mr. Sudhir Bhilar Metal Products(Steel Pipes & Rods)<br />
Email; 'sudhirbhilar@gmail.com'<br />
69 Mr. Sudhir Bhilar Agri Commodities<br />
Email; 'sudhirbhilar@gmail.com'<br />
70 Mr. B Naik Handicrafts<br />
Email; 'sanjeev@mozartexports.com'<br />
71 Mr. Vipul Fresh Fruits,Vegetables,Spices<br />
PRACHI EXPORTS<br />
Ahmedabad-81, India<br />
Email; 'prachiexports0407@gmail.com'<br />
72 Ms. Heena Deshpande Spices, Sugar, Oil seeds<br />
AgriLink - India<br />
Mumbai-63, India<br />
Email: heena@agrilinkindia.com<br />
73 Ms. Heena Deshpande Raw Cotton<br />
AgriLink - India<br />
Mumbai-63, India
Email: heena@agrilinkindia.com<br />
74 Ms. Heena Deshpande Dried Fruits & Vegetables<br />
AgriLink - India<br />
Mumbai-63, India<br />
Email: heena@agrilinkindia.com<br />
75 Mr. Manish Auto Electric Parts<br />
Email; manish@latlmkt.com<br />
76 Mrs. Bharti More Herbal care products<br />
RESHLON COSMETICS (P) LTD<br />
Thane-2, India<br />
Email; rekha@reshlon.com<br />
77 Mrs. Bharti More Beauty Products<br />
RESHLON COSMETICS (P) LTD<br />
Thane-2, India<br />
Email; rekha@reshlon.com<br />
78 Dr. Arvind Aggarwal Metal scrap<br />
Email: esb080652@gmail.com
ANNEXURE III<br />
India-Singapore Trade-Monthly Trends<br />
(Value in S$ Millions)<br />
India-Singapore Trade<br />
March<br />
<strong>2012</strong><br />
April<br />
<strong>2012</strong><br />
May<br />
<strong>2012</strong><br />
Total Trade (% Change)<br />
2,770<br />
(-16.17%)<br />
2,652<br />
(-4.26%)<br />
2,673(+1%)<br />
India’s Exports to Singapore (% Change)<br />
1,501 (-30.03%)<br />
1,421<br />
(-5.33%)<br />
1,416(-1%)<br />
India’s Imports from Singapore (%<br />
Change)<br />
1,269(+9.49%)<br />
1,230<br />
(-3.08%)<br />
1,528(+25%)<br />
Singapore’s Domestic Exports (%<br />
Change)<br />
622(+21.25%)<br />
562<br />
(-9.65%)<br />
627(+12%)<br />
Singapore’s Re-Exports (% Change)<br />
647(+0.16%) 667<br />
(+3.10%)<br />
629(-6%)
Annexure-IV<br />
Singapore’s Total Global Trade (Top 10 Products)<br />
(Value in S$ Millions)<br />
Product<br />
May<br />
2010<br />
May<br />
2011<br />
May<br />
<strong>2012</strong><br />
1<br />
OTHER PETROLEUM OILS & OILS FROM BITUMINOUS<br />
MINERALS NOT CRUDE & PREPARATIONS NES CONTAINING<br />
BY WEIGHT 70% OR MORE OF PETROLEUM OILS OR OF OILS<br />
OBTAINED FROM BITUMINOUS MINERALS EXCL THOSE<br />
CONTAINING BIODIESEL & WASTE OILS (HS 271019)<br />
8,204 12,864 12,744<br />
2<br />
OTHER ELECTRONIC INTEGRATED CIRCUITS (HS 854239) 8,772 7,407 7,293<br />
3<br />
PETROLEUM OILS & OILS FROM BITUMINOUS MINERALS<br />
CRUDE (HS 270900)<br />
2,061 3,975 4,729<br />
4<br />
LIGHT OILS & PREPARATIONS CONTAINING BY WEIGHT 70 %<br />
OR MORE OF PETROLEUM OILS OR OILS FROM BITUMINOUS<br />
MINERALS (HS 271012)<br />
3,654 4,089 4,338<br />
5<br />
PROCESSORS & CONTROLLERS CONVERTERS LOGIC CIRCUITS<br />
AMPLIFIERS CLOCK TIMING CIRCUITS OR OTHER CIRCUITS<br />
(HS 854231)<br />
3,014 3,682 3,974<br />
6<br />
SHIPS & AIRCRAFT BUNKERS & STORES LOADED ON BOARD<br />
FOR OWN CONSUMPTION (HS 989300)<br />
2,557 3,140 3,632<br />
7<br />
PARTS & ACCESSORIES OF MACHINES OF 8471 (HS 847330) 2,195 1,807 1,619<br />
8<br />
TELEPHONES FOR CELLULAR NETWORKS OR FOR OTHER<br />
WIRELESS NETWORKS (HS 851712)<br />
833 1,168 1,181<br />
9<br />
OTHER PARTS OF AEROPLANES OR HELICOPTERS (HS<br />
880330)<br />
906 968 1,136<br />
10<br />
OTHER PARTS & ACCESSORIES OF PRINTING MACHINERY &<br />
PRINTERS COPYING & FACSIMILE MACHINES (HS 844399)<br />
1,054 1,072 1,001
TOTAL FOR THE ABOVE<br />
33,250 40,172 41,647<br />
TOTAL FOR OTHER PRODUCTS<br />
15,907 17,488 17,640<br />
GRAND TOTAL<br />
49,157 57,660 59,287<br />
Annexure-V<br />
Singapore’s Global Imports (Top 10 Products)<br />
(Value in S$ Millions)<br />
Product<br />
May<br />
2010<br />
May<br />
2011<br />
May<br />
<strong>2012</strong><br />
1<br />
OTHER PETROLEUM OILS & OILS FROM BITUMINOUS<br />
MINERALS NOT CRUDE & PREPARATIONS NES<br />
CONTAINING BY WEIGHT 70% OR MORE OF<br />
PETROLEUM OILS OR OF OILS OBTAINED FROM<br />
BITUMINOUS MINERALS EXCL THOSE CONTAINING<br />
BIODIESEL & WASTE OILS (HS 271019)<br />
4,149 6,906 7,248<br />
2<br />
PETROLEUM OILS & OILS FROM BITUMINOUS<br />
MINERALS CRUDE (HS 270900)<br />
2,061 3,974 4,729<br />
3<br />
OTHER ELECTRONIC INTEGRATED CIRCUITS (HS 854239) 4,451 3,777 3,854<br />
4<br />
LIGHT OILS & PREPARATIONS CONTAINING BY WEIGHT<br />
70 % OR MORE OF PETROLEUM OILS OR OILS FROM<br />
BITUMINOUS MINERALS (HS 271012)<br />
1,569 1,836 1,821<br />
5<br />
PROCESSORS & CONTROLLERS CONVERTERS LOGIC<br />
CIRCUITS AMPLIFIERS CLOCK TIMING CIRCUITS OR<br />
OTHER CIRCUITS (HS 854231)<br />
923 854 969<br />
6<br />
TELEPHONES FOR CELLULAR NETWORKS OR FOR<br />
OTHER WIRELESS NETWORKS (HS 851712)<br />
493 763 679<br />
7<br />
PARTS & ACCESSORIES OF MACHINES OF 8471 (HS<br />
847330)<br />
825 693 655
8<br />
NATURAL GAS (HS 271121) ----- 522 617<br />
9<br />
OTHER PARTS OF AEROPLANES OR HELICOPTERS (HS<br />
880330)<br />
420 452 569<br />
10<br />
PARTS OF TURBO JETS OR TURBO-PROPELLERS (HS<br />
841191)<br />
262 319 549<br />
TOTAL FOR THE ABOVE<br />
15,153 20,096 21,690<br />
TOTAL FOR OTHER PRODUCTS 8,335 8,712 8,945<br />
GRAND TOTAL<br />
23,488 28,808 30,635<br />
Annexure-VI<br />
Singapore’s Global Exports (Top 10 Products)<br />
Product<br />
May<br />
2010<br />
May<br />
2011<br />
(Value in S$ Millions)<br />
May<br />
<strong>2012</strong><br />
1<br />
OTHER PETROLEUM OILS & OILS FROM BITUMINOUS<br />
MINERALS NOT CRUDE & PREPARATIONS NES<br />
CONTAINING BY WEIGHT 70% OR MORE OF<br />
PETROLEUM OILS OR OF OILS OBTAINED FROM<br />
BITUMINOUS MINERALS EXCL THOSE CONTAINING<br />
BIODIESEL & WASTE OILS (HS 271019)<br />
4,054 5,958 5,496<br />
2<br />
SHIPS & AIRCRAFT BUNKERS & STORES LOADED ON<br />
BOARD FOR OWN CONSUMPTION (HS 989300)<br />
2,557 3,140 3,632<br />
3<br />
OTHER ELECTRONIC INTEGRATED CIRCUITS (HS<br />
854239)<br />
4,321 3,630 3,439<br />
4<br />
PROCESSORS & CONTROLLERS CONVERTERS LOGIC<br />
CIRCUITS AMPLIFIERS CLOCK TIMING CIRCUITS OR<br />
OTHER CIRCUITS (HS 854231)<br />
2,090 2,827 3,004
5<br />
LIGHT OILS & PREPARATIONS CONTAINING BY<br />
WEIGHT 70 % OR MORE OF PETROLEUM OILS OR<br />
OILS FROM BITUMINOUS MINERALS (HS 271012)<br />
2,084 2,253 2,516<br />
6<br />
PARTS & ACCESSORIES OF MACHINES OF 8471 (HS<br />
847330)<br />
1,369 1,113 963<br />
7<br />
MEMORIES (HS 854232) 865 625 690<br />
8<br />
OTHER PARTS & ACCESSORIES OF PRINTING<br />
MACHINERY & PRINTERS COPYING & FACSIMILE<br />
MACHINES (HS 844399)<br />
798 761 677<br />
9<br />
OTHER PARTS OF AEROPLANES OR HELICOPTERS (HS<br />
880330)<br />
485 516 567<br />
10<br />
PARTS OF BORING OR SINKING MACHINERY OF<br />
SUBHEADING 8430.41 OR 8430.49 (HS 843143)<br />
357 326 520<br />
TOTAL FOR THE ABOVE<br />
18,980 21,149 21,504<br />
TOTAL FOR OTHER PRODUCTS<br />
7,364 8,253 7,363<br />
GRAND TOTAL<br />
26,344 29,402 28,867<br />
Annexure-VII<br />
Singapore’s Export to India (Top 10 Products)<br />
(Value in S$ Millions)<br />
PRODUCT<br />
Jan - May<br />
2010<br />
Jan – May<br />
2011<br />
Jan - May<br />
<strong>2012</strong><br />
1<br />
OTHER PETROLEUM OILS & OILS FROM BITUMINOUS<br />
MINERALS NOT CRUDE & PREPARATIONS NES<br />
CONTAINING BY WEIGHT 70% OR MORE OF<br />
PETROLEUM OILS OR OF OILS OBTAINED FROM<br />
BITUMINOUS MINERALS EXCL THOSE CONTAINING<br />
BIODIESEL & WASTE OILS (HS 271019)<br />
1,067 1,924 651
2<br />
PARTS & ACCESSORIES OF MACHINES OF 8471 (HS<br />
847330)<br />
374 403 339<br />
3<br />
OTHER PARTS & ACCESSORIES OF PRINTING<br />
MACHINERY & PRINTERS COPYING & FACSIMILE<br />
MACHINES (HS 844399)<br />
200 195 257<br />
4<br />
STYRENE (HS 290250) 143 178 214<br />
5<br />
MACHINES FOR RECEPTION CONVERSION &<br />
TRANSMISSION OR REGENERATION OF VOICE<br />
IMAGES OR OTHER DATA (HS 851762)<br />
95 131 164<br />
6<br />
OTHER ELECTRONIC INTEGRATED CIRCUITS (HS<br />
854239)<br />
252 194 155<br />
7<br />
P-XYLENE (HS 290243) 64 86 134<br />
8<br />
SHIPS & AIRCRAFT BUNKERS & STORES LOADED ON<br />
BOARD FOR OWN CONSUMPTION (HS 989300)<br />
97 134 126<br />
9<br />
PARTS OF BORING OR SINKING MACHINERY OF<br />
SUBHEADING 8430.41 OR 8430.49 (HS 843143)<br />
77 76 101<br />
10<br />
OTHER POLYMERS OF ETHYLENE IN PRIMARY FORMS<br />
(HS 390190)<br />
80 71 97<br />
TOTAL FOR THE ABOVE<br />
2,449 3,392 2238<br />
TOTAL FOR OTHER PRODUCTS 1,256 1,290 899<br />
GRAND TOTAL<br />
3,705 4,682 3137
Annexure VIII<br />
Singapore’s Import from India (Top 10 Products)<br />
(Value in S$ Millions)<br />
PRODUCT<br />
Jan -<br />
May<br />
2010<br />
Jan –<br />
May<br />
2011<br />
Jan -<br />
May<br />
<strong>2012</strong><br />
1<br />
LIGHT OILS & PREPARATIONS CONTAINING BY WEIGHT<br />
70 % OR MORE OF PETROLEUM OILS OR OILS FROM<br />
BITUMINOUS MINERALS (HS 271012)<br />
1,116 2,779 3,535<br />
2<br />
OTHER PETROLEUM OILS & OILS FROM BITUMINOUS<br />
MINERALS NOT CRUDE & PREPARATIONS NES<br />
CONTAINING BY WEIGHT 70% OR MORE OF PETROLEUM<br />
OILS OR OF OILS OBTAINED FROM BITUMINOUS<br />
MINERALS EXCL THOSE CONTAINING BIODIESEL &<br />
WASTE OILS (HS 271019)<br />
2,144 3,341 2,788<br />
3<br />
OTHER ARTICLES OF JEWELLERY OF OTHER PRECIOUS<br />
METAL (HS 711319)<br />
190 220 190<br />
4<br />
OTHER MOTOR VEHICLES FOR TRANSPORTING GOODS<br />
WITH COMPRESSION IGNITION INTERNAL COMBUSTION<br />
PISTON ENGINE OF GVW OVER 20T (HS 870423)<br />
43 74 160<br />
5<br />
WORKED NON-INDUSTRIAL DIAMONDS NOT MOUNTED<br />
OR SET (HS 710239)<br />
156 123 87<br />
6<br />
WORKED INDUSTRIAL DIAMONDS NOT MOUNTED OR<br />
SET (HS 710229)<br />
65 67 86<br />
7<br />
OTHER ACYCLIC ETHERS & THEIR HALOGENATED<br />
SULPHONATED NITRATED OR NITROSATED DERIVATIVES<br />
(HS 290919)<br />
.004 .005 58<br />
8<br />
TELEPHONES FOR CELLULAR NETWORKS OR FOR OTHER<br />
WIRELESS NETWORKS (HS 851712)<br />
91 37 45<br />
9<br />
OTHER ELECTRO-DIAGNOSTIC APPARATUS (HS 901819) 2 .400 42
10<br />
PARTS OF BORING OR SINKING MACHINERY OF<br />
SUBHEADING 8430.41 OR 8430.49 (HS 843143)<br />
13 11 30<br />
TOTAL FOR THE ABOVE<br />
3,820 6,652 7,021<br />
TOTAL FOR OTHER PRODUCTS<br />
500 473 371<br />
GRAND TOTAL<br />
4,320 7,125 7,392