Characteristics of Work-Related Injuries and Illnesses in ... - Maine.gov
Characteristics of Work-Related Injuries and Illnesses in ... - Maine.gov
Characteristics of Work-Related Injuries and Illnesses in ... - Maine.gov

You also want an ePaper? Increase the reach of your titles
YUMPU automatically turns print PDFs into web optimized ePapers that Google loves.
<strong>Characteristics</strong><br />
<strong>of</strong><br />
<strong>Work</strong>-<strong>Related</strong><br />
<strong>Injuries</strong> <strong>and</strong><br />
<strong>Illnesses</strong><br />
<strong>in</strong> Ma<strong>in</strong>e<br />
1999<br />
BLS 718
<strong>Characteristics</strong> <strong>of</strong> <strong>Work</strong>-related<br />
<strong>Injuries</strong> <strong>and</strong> <strong>Illnesses</strong> <strong>in</strong> Ma<strong>in</strong>e, 1999<br />
Highlights<br />
<strong>Work</strong>-related <strong>in</strong>juries <strong>and</strong> illnesses where the worker lost time from work are on<br />
the rise, go<strong>in</strong>g from 12,863 cases <strong>in</strong> 1998 to 16,561 <strong>in</strong> 1999, a 28.7% <strong>in</strong>crease.<br />
Of the 16,561 disabl<strong>in</strong>g First Reports <strong>of</strong> Occupational Injury or Disease for 1999<br />
filed with the Ma<strong>in</strong>e <strong>Work</strong>ersí Compensation Board through June 1, 2000:<br />
♦81% were for traumatic <strong>in</strong>juries <strong>and</strong> disorders (e.g., spra<strong>in</strong>s, cuts, bruises,<br />
fractures);<br />
♦54% were from bodily reaction (e.g., sitt<strong>in</strong>g, stretch<strong>in</strong>g, repetitive motion etc.)<br />
or exertion;<br />
♦50% <strong>of</strong> the <strong>in</strong>jured workers had less than two years <strong>of</strong> employment with their<br />
current employer at the time <strong>of</strong> the <strong>in</strong>jury or illness;<br />
♦42% <strong>of</strong> the <strong>in</strong>jured workers were between the ages <strong>of</strong> 30 <strong>and</strong> 44 at the time <strong>of</strong><br />
the <strong>in</strong>jury or illness;<br />
♦46% were <strong>in</strong> Services <strong>and</strong> Manufactur<strong>in</strong>g Industry divisions;<br />
♦39% <strong>of</strong> the cases affected the trunk (e.g., back, shoulder, abdomen, hip);<br />
♦31% <strong>of</strong> the cases were due to a person, plant, animal or m<strong>in</strong>eral (e.g., the<br />
person <strong>in</strong>jured was coded as the source <strong>of</strong> the <strong>in</strong>jury for repetitive <strong>in</strong>juries);<br />
♦19% <strong>of</strong> the employees were <strong>in</strong> the occupational group <strong>of</strong> Service workers,<br />
such as nurs<strong>in</strong>g aides, kitchen workers, cooks, janitors, etc.;<br />
♦The highest <strong>in</strong>cidence <strong>of</strong> <strong>in</strong>juries <strong>and</strong> illnesses occurred <strong>in</strong> January <strong>and</strong> August;<br />
♦20% <strong>of</strong> the cases were reported on Monday, more than any other day <strong>of</strong> the week.
D EPARTMENT OF LABOR<br />
B UREAU OF LABOR STANDARDS<br />
45 STATE HOUSE STATION<br />
AUGUSTA, MAINE<br />
04333-0045<br />
VALERIE R. LANDRY<br />
COMMISSIONER<br />
ANGUS S. KING, JR. MICHAEL V. FRETT<br />
GOVERNOR<br />
<strong>Characteristics</strong><br />
<strong>of</strong><br />
<strong>Work</strong>-related<br />
<strong>Injuries</strong> <strong>and</strong><br />
<strong>Illnesses</strong><br />
<strong>in</strong> Ma<strong>in</strong>e<br />
1999<br />
Janet M. Aust<strong>in</strong>, Statistician<br />
DIRECTOR<br />
December 2001 Augusta, Ma<strong>in</strong>e
Material <strong>in</strong> this publication is <strong>in</strong> the public doma<strong>in</strong> <strong>and</strong> may,<br />
with appropriate credit, be reproduced without permission.<br />
The Ma<strong>in</strong>e Department <strong>of</strong> Labor provides equal opportunity employment <strong>and</strong> programs.<br />
Auxiliary aids <strong>and</strong> services are available upon request to <strong>in</strong>dividuals with disabilities.<br />
Telephone: (207) 624-6400 TTY: 1-800-794-1110 Fax: (207) 624-6449<br />
This publication is available at: http://www.state.me/us/labor/bls/blsma<strong>in</strong>.htm (click on publications)
Contents<br />
Page<br />
Introduction .................................................................................................................................... 1<br />
Part I <strong>Characteristics</strong> <strong>of</strong> the Injured or Ill <strong>Work</strong>er ............................................................... 3<br />
Part II <strong>Characteristics</strong> <strong>of</strong> the Employer ................................................................................... 9<br />
Part III <strong>Characteristics</strong> <strong>of</strong> the Incident .................................................................................... 17<br />
Appendices .................................................................................................................................... 45<br />
Tables:<br />
1. Disabl<strong>in</strong>g Cases by Occupational Groups, Ma<strong>in</strong>e, 1997-1999 ........................................ 5<br />
2 Disabl<strong>in</strong>g Cases by Age <strong>of</strong> Injured or Ill <strong>Work</strong>er, Ma<strong>in</strong>e, 1997-1999 ............................ 6<br />
3. Disabl<strong>in</strong>g Cases by Length <strong>of</strong> Service <strong>of</strong> Injured or Ill <strong>Work</strong>er, Ma<strong>in</strong>e, 1997-1999 ...... 7<br />
4. Disabl<strong>in</strong>g Cases by Ownership <strong>of</strong> Employers, Employment, Ma<strong>in</strong>e, 1997-1999 ......... 10<br />
5. Disabl<strong>in</strong>g Cases by Major Industry Division, Ma<strong>in</strong>e, 1997-1999 ................................. 11<br />
6. Disabl<strong>in</strong>g Cases by Insurer Type, Ma<strong>in</strong>e, 1997-1999 .................................................... 13<br />
7. Disabl<strong>in</strong>g Cases by County, Ma<strong>in</strong>e, 1997-1999 ............................................................ 15<br />
8. Disabl<strong>in</strong>g Cases by Month <strong>of</strong> Occurrence, Ma<strong>in</strong>e, 1997-1999 ...................................... 18<br />
9. Disabl<strong>in</strong>g Cases by Day <strong>of</strong> the Week, Ma<strong>in</strong>e, 1997-1999 ............................................. 19<br />
10. Disabl<strong>in</strong>g Cases by Nature <strong>of</strong> Injury or Illness, Ma<strong>in</strong>e, 1997-1999 ..............................21<br />
11. Disabl<strong>in</strong>g Cases by Part <strong>of</strong> Body Affected, Ma<strong>in</strong>e, 1997-1999 ..................................... 24<br />
12. Disabl<strong>in</strong>g Cases by Source <strong>of</strong> Injury or Illness, Ma<strong>in</strong>e, 1997-1999 .............................. 27<br />
13. Disabl<strong>in</strong>g Cases by Event or Exposure, Ma<strong>in</strong>e, 1997-1999 .......................................... 33<br />
14. Disabl<strong>in</strong>g Cases by Occupation <strong>of</strong> Injured <strong>Work</strong>er, Ma<strong>in</strong>e, 1997-1999 ........................ 37<br />
15. Nature <strong>of</strong> Injury or Illness by Part <strong>of</strong> Body Injured, Disabl<strong>in</strong>g Cases, Ma<strong>in</strong>e,<br />
1997-1999 ...................................................................................................................... 41<br />
16. Nature <strong>of</strong> Injury or Illness by Event or Exposure, Disabl<strong>in</strong>g Cases, Ma<strong>in</strong>e,<br />
1997-1999 ...................................................................................................................... 42<br />
17. Nature <strong>of</strong> Injury or Illness by Source <strong>of</strong> Injury or Illness, Disabl<strong>in</strong>g Cases,<br />
Ma<strong>in</strong>e, 1997-1999 .......................................................................................................... 43<br />
18. Source <strong>of</strong> Injury or Illness by Event or Exposure, Disabl<strong>in</strong>g Cases, Ma<strong>in</strong>e,<br />
1997-1999 ...................................................................................................................... 44
Figures: .....................................................................................................................................Page<br />
1. Twenty-year Comparison, Number <strong>of</strong> Disabl<strong>in</strong>g Cases, Ma<strong>in</strong>e, 1980-1999 ................... 1<br />
2. Occupational Groups, Percent <strong>of</strong> Disabl<strong>in</strong>g Cases, Ma<strong>in</strong>e, 1990-1998, 1999 ................. 4<br />
3. Age <strong>of</strong> Injured <strong>Work</strong>er, Percent <strong>of</strong> Disabl<strong>in</strong>g Cases, Ma<strong>in</strong>e, 1997-1999 ........................ 6<br />
4. Length <strong>of</strong> Service, Percent <strong>of</strong> Disabl<strong>in</strong>g Cases, Ma<strong>in</strong>e, 1990-1998 ................................ 7<br />
5. Length <strong>of</strong> Service, Percent <strong>of</strong> Disabl<strong>in</strong>g Cases, Ma<strong>in</strong>e, 1999 ......................................... 7<br />
6. Ownership <strong>of</strong> Employers, Percent <strong>of</strong> Disabl<strong>in</strong>g Cases, Ma<strong>in</strong>e, 1999 ............................ 10<br />
7. Selected Manufactur<strong>in</strong>g Groups, Percent <strong>of</strong> Total Manufactur<strong>in</strong>g, Disabl<strong>in</strong>g Cases<br />
<strong>and</strong> Employment, Ma<strong>in</strong>e, 1990-1998, 1999 ................................................................... 12<br />
8. Insurer Type, Number <strong>of</strong> Disabl<strong>in</strong>g Cases, Ma<strong>in</strong>e, 1999 .............................................. 13<br />
9. Disabl<strong>in</strong>g Cases by Ma<strong>in</strong>e County, 1999 ....................................................................... 14<br />
10. Month <strong>of</strong> Injury or Illness, Percent <strong>of</strong> Disabl<strong>in</strong>g Cases, Ma<strong>in</strong>e, 1990-1998, 1999 ....... 18<br />
11. Day <strong>of</strong> the Week <strong>of</strong> Injury or Illness, Percent <strong>of</strong> Disabl<strong>in</strong>g Cases, Ma<strong>in</strong>e,<br />
1990-1998, 1999 ............................................................................................................ 19<br />
12. Nature <strong>of</strong> Injury or Illness, Percent <strong>of</strong> Disabl<strong>in</strong>g Cases, Ma<strong>in</strong>e, 1999 .......................... 20<br />
13. Traumatic <strong>Injuries</strong>, Percent <strong>of</strong> Disabl<strong>in</strong>g Cases, Ma<strong>in</strong>e, 1999 ...................................... 20<br />
14. Top Five Natures <strong>of</strong> <strong>Injuries</strong>, Percent <strong>of</strong> Total Disabl<strong>in</strong>g Cases, Ma<strong>in</strong>e, 1993-1999 .... 20<br />
15. Part <strong>of</strong> Body Injured, Percent <strong>of</strong> Disabl<strong>in</strong>g Cases, Ma<strong>in</strong>e, 1999 ................................... 23<br />
16. Part <strong>of</strong> Trunk Injured, Percent <strong>of</strong> Disabl<strong>in</strong>g Cases, Ma<strong>in</strong>e, 1999 .................................. 23<br />
17. Top Five Parts <strong>of</strong> Body Injured, Percent <strong>of</strong> Disabl<strong>in</strong>g Cases, Ma<strong>in</strong>e, 1993-1999 ......... 23<br />
18. Source <strong>of</strong> Injury or Illness, Percent <strong>of</strong> Disabl<strong>in</strong>g Cases, Ma<strong>in</strong>e, 1999 .......................... 26<br />
19. Persons, Plants, Animals, M<strong>in</strong>erals, Percent <strong>of</strong> Disabl<strong>in</strong>g Cases, Ma<strong>in</strong>e, 1999 ............ 26<br />
20. Top Five Sources <strong>of</strong> Injury or Illness, Percent <strong>of</strong> Disabl<strong>in</strong>g Cases, Ma<strong>in</strong>e, 1993-1999 .. 26<br />
21. Event or Exposure, Percent <strong>of</strong> Disabl<strong>in</strong>g Cases, Ma<strong>in</strong>e, 1999 ...................................... 32<br />
22. Bodily Reaction <strong>and</strong> Exertion, Percent <strong>of</strong> Disabl<strong>in</strong>g Cases, Ma<strong>in</strong>e, 1999 .................... 32<br />
23. Top Five Events, Percent <strong>of</strong> Disabl<strong>in</strong>g Cases, Ma<strong>in</strong>e, 1993-1999 ................................ 32<br />
24. Top Four Occupations, Percent <strong>of</strong> Disabl<strong>in</strong>g Cases, Ma<strong>in</strong>e, 1993-1999 ....................... 36<br />
Appendices<br />
A. Technical Notes ............................................................................................................. 46<br />
Cod<strong>in</strong>g Summary ........................................................................................................... 48<br />
Sample <strong>of</strong> Nature Codes ................................................................................................ 49<br />
B. Fatality Reports for 1999 ............................................................................................... 50
Introduction<br />
The data <strong>in</strong> this publication is based on <strong>in</strong>juries <strong>and</strong><br />
illnesses reported to the Ma<strong>in</strong>e <strong>Work</strong>ersí Compensation<br />
Board on First Reports <strong>of</strong> Occupational Injury<br />
or Disease. This publication is limited to claims result<strong>in</strong>g<br />
<strong>in</strong> a day or more <strong>of</strong> lost time beyond the day<br />
<strong>of</strong> the <strong>in</strong>jury. These claims are referred to as disabl<strong>in</strong>g<br />
or lost-time cases.<br />
For questions regard<strong>in</strong>g the data <strong>in</strong> this publication<br />
please contact:<br />
Janet Aust<strong>in</strong><br />
Ma<strong>in</strong>e Department <strong>of</strong> Labor<br />
Bureau <strong>of</strong> Labor St<strong>and</strong>ards<br />
45 State House Station<br />
Augusta, ME 04333-0045<br />
Tel: (207)-624-6447<br />
E-mail: Janet.M.Aust<strong>in</strong>@state.me.us<br />
or<br />
E-mail: webmaster_bls@state.me.us<br />
Internet Addresses:<br />
For the State <strong>of</strong> Ma<strong>in</strong>e:<br />
http://www.state.me.us/<br />
For the Bureau <strong>of</strong> Labor St<strong>and</strong>ards:<br />
http://www.state.me.us/labor/bls/blsma<strong>in</strong>.htm<br />
For the Federal Bureau <strong>of</strong> Labor Statistics:<br />
http://stats.bls.<strong>gov</strong>/iif<br />
For the <strong>Work</strong>ersí Compensation Board:<br />
http://www.state.me.us/wcb<br />
The Ma<strong>in</strong>e Department <strong>of</strong> Labor also publishes Occupational<br />
<strong>Injuries</strong> <strong>and</strong> <strong>Illnesses</strong> <strong>in</strong> Ma<strong>in</strong>e which<br />
conta<strong>in</strong>s data from the OSHA 200 log based on an<br />
annual survey to targeted employers <strong>in</strong> Ma<strong>in</strong>e. For a<br />
copy <strong>of</strong> this publication, go to:<br />
http://www.state.me/us/labor/bls/blsma<strong>in</strong>.htm <strong>and</strong><br />
click on publications.<br />
For work-related fatality data, please refer to the<br />
Ma<strong>in</strong>e Department <strong>of</strong> Labor Census <strong>of</strong> Fatal Occupational<br />
<strong>Injuries</strong> (CFOI) program. This is a Federal/<br />
State cooperative program, created <strong>in</strong> 1990 by the U.<br />
S. Department <strong>of</strong> Labor, Bureau <strong>of</strong> Labor Statistics.<br />
The CFOI program provides a comprehensive, accurate,<br />
descriptive, timely count <strong>of</strong> national <strong>and</strong> state<br />
work-related fatalities. The CFOI <strong>and</strong> the Ma<strong>in</strong>e<br />
<strong>Work</strong>ersí Compensation Board use different case<br />
def<strong>in</strong>ition systems. The CFOI program has a statistical<br />
<strong>and</strong> prevention focus while the Ma<strong>in</strong>e <strong>Work</strong>ersí<br />
Compensation Board focuses on the workrelatedness<br />
<strong>and</strong> compensible aspects <strong>of</strong> claims.<br />
The difference <strong>in</strong> the focus <strong>of</strong> these two programs<br />
warrants two different approaches <strong>in</strong> the surveillance<br />
<strong>of</strong> work-related fatalities <strong>in</strong> Ma<strong>in</strong>e.<br />
For a copy <strong>of</strong> the CFOI publication go to:<br />
http://www.state.me/us/labor/bls/blsma<strong>in</strong>.htm <strong>and</strong><br />
click on publications.
<strong>Characteristics</strong> <strong>of</strong> <strong>Work</strong>-related <strong>Injuries</strong> <strong>and</strong> <strong>Illnesses</strong> <strong>in</strong> Ma<strong>in</strong>e 1999_________________<br />
There were 16,561 disabl<strong>in</strong>g cases <strong>in</strong> 1999, a 28.7%<br />
<strong>in</strong>crease from the 12,863 disabl<strong>in</strong>g cases <strong>in</strong> 1998, as<br />
shown <strong>in</strong> Figure 1. This is the highest number <strong>of</strong><br />
lost-time work-related <strong>in</strong>juries <strong>and</strong> illnesses <strong>in</strong> Ma<strong>in</strong>e<br />
s<strong>in</strong>ce 1992, when there were 19,380 cases. In 1998,<br />
the <strong>Work</strong>ersí Compensation Board <strong>in</strong>itiated a new<br />
Monitor<strong>in</strong>g, Audit <strong>and</strong> Enforcement Program. This<br />
Figure 1.<br />
Number <strong>of</strong> Disabl<strong>in</strong>g Cases (thous<strong>and</strong>s)<br />
30<br />
25<br />
20<br />
15<br />
10<br />
5<br />
0<br />
19.4<br />
1980<br />
19.8<br />
1981<br />
18.2<br />
1982<br />
19.1<br />
1983<br />
23.3<br />
1984<br />
23.3<br />
1985<br />
Twenty-year Comparison<br />
Number <strong>of</strong> Disabl<strong>in</strong>g Cases<br />
Ma<strong>in</strong>e, 1980-1999<br />
24.3<br />
1986<br />
25.5<br />
1987<br />
26.3<br />
1988<br />
_________________________________________________________________________________________<br />
Ma<strong>in</strong>e Department <strong>of</strong> Labor 2<br />
Bureau <strong>of</strong> Labor St<strong>and</strong>ards<br />
26.0<br />
program monitors the compliance <strong>of</strong> <strong>in</strong>surers, audits<br />
the performance <strong>of</strong> <strong>in</strong>surers <strong>and</strong> enforces compliance,<br />
which may account, <strong>in</strong> part, for the <strong>in</strong>crease <strong>in</strong><br />
disabl<strong>in</strong>g cases <strong>in</strong> 1999. Figure 1 below shows the<br />
number <strong>of</strong> disabl<strong>in</strong>g work-related <strong>in</strong>juries <strong>and</strong> illness<br />
for the last 20 years as reported on First Reports<br />
<strong>of</strong> Occupational Injury or Disease.<br />
1989<br />
27.3<br />
1990<br />
22.0<br />
1991<br />
Year <strong>of</strong> Injury or Illness<br />
19.4<br />
1992<br />
15.9<br />
1993<br />
15.2<br />
1994<br />
13.1<br />
1995<br />
12.1<br />
1996<br />
12.7<br />
1997<br />
12.9<br />
1998<br />
16.6<br />
1999
<strong>Characteristics</strong> <strong>of</strong> <strong>Work</strong>-related <strong>Injuries</strong> <strong>and</strong> <strong>Illnesses</strong> <strong>in</strong> Ma<strong>in</strong>e 1999_________________<br />
Part I<br />
<strong>Characteristics</strong><br />
<strong>of</strong> the Injured<br />
or Ill <strong>Work</strong>er<br />
Occupational Groups 4<br />
Age <strong>of</strong> Injured or Ill <strong>Work</strong>er 6<br />
Length <strong>of</strong> Service <strong>of</strong> Injured or Ill <strong>Work</strong>er 7<br />
_________________________________________________________________________________________<br />
Ma<strong>in</strong>e Department <strong>of</strong> Labor 3<br />
Bureau <strong>of</strong> Labor St<strong>and</strong>ards
Occupational Groups<br />
<strong>Characteristics</strong> <strong>of</strong> <strong>Work</strong>-related <strong>Injuries</strong> <strong>and</strong> <strong>Illnesses</strong> <strong>in</strong> Ma<strong>in</strong>e 1999_________________<br />
In 1999, over 63% <strong>of</strong> all disabl<strong>in</strong>g cases <strong>in</strong>volved<br />
employees <strong>in</strong> four occupational groups: (1) Service<br />
occupations; (2) Precision Production, Craft, <strong>and</strong> Repair<br />
occupations (<strong>in</strong>clud<strong>in</strong>g all mechanics, construction<br />
trades workers, precision metal workers, <strong>and</strong><br />
plant <strong>and</strong> system operators); (3) H<strong>and</strong>lers, Equipment<br />
Cleaners, <strong>and</strong> Laborers (<strong>in</strong>clud<strong>in</strong>g trades helpers,<br />
mach<strong>in</strong>e feeders, <strong>of</strong>fbearers, stock clerks, <strong>and</strong><br />
packers); <strong>and</strong> (4) Mach<strong>in</strong>e Operators, Assemblers,<br />
<strong>and</strong> Inspectors.<br />
Figure 2 shows the percentages <strong>of</strong> 1999 disabl<strong>in</strong>g<br />
Percent <strong>of</strong> Disabl<strong>in</strong>g Cases<br />
Figure 2.<br />
22<br />
20<br />
18<br />
16<br />
14<br />
12<br />
10<br />
8<br />
6<br />
4<br />
2<br />
0<br />
18.4<br />
18.7<br />
Service<br />
occupations<br />
18.1<br />
17.9<br />
Prod. craft &<br />
repair<br />
15.3<br />
16.6<br />
H<strong>and</strong>ler, eq.<br />
cleaner, laborer<br />
Occupational Groups<br />
Percent <strong>of</strong> Disabl<strong>in</strong>g Cases, Ma<strong>in</strong>e, 1990-1998, 1999<br />
13.8<br />
Mach<strong>in</strong>e operator<br />
10.2<br />
1990-1998 1999<br />
8.6<br />
9.3<br />
Transport. & mat.<br />
h<strong>and</strong>ler<br />
6.1<br />
6.7<br />
Adm supportclerical<br />
cases for occupational groups as compared to the<br />
1990-1998 average. This figure shows if 1999 disabl<strong>in</strong>g<br />
cases are <strong>in</strong> l<strong>in</strong>e with the 9-year average or if<br />
new trends may be develop<strong>in</strong>g. The largest group<br />
decrease was <strong>in</strong> the Mach<strong>in</strong>e Operator, Assembler<br />
<strong>and</strong> Inspector group, which accounted for an average<br />
<strong>of</strong> 13.8% <strong>of</strong> lost-time <strong>in</strong>juries <strong>and</strong> illnesses for 1990-<br />
1998 <strong>and</strong> 10.2% <strong>in</strong> 1999.<br />
See Table 1 on page 5 for data on occupational<br />
groups <strong>and</strong> Table 14 on page 37 for a more detailed<br />
list <strong>of</strong> specific occupations.<br />
_________________________________________________________________________________________<br />
Ma<strong>in</strong>e Department <strong>of</strong> Labor 4<br />
Bureau <strong>of</strong> Labor St<strong>and</strong>ards<br />
4.2<br />
5.1<br />
Pr<strong>of</strong>essional<br />
specialty<br />
Occupational Groups<br />
4.7<br />
4.8<br />
Sales<br />
occupations<br />
3.1<br />
2.7<br />
Farm<strong>in</strong>g, fish<strong>in</strong>g,<br />
forestry<br />
2.8<br />
2.5<br />
Protective<br />
service occ.<br />
2.5<br />
2.5<br />
Executive adm<strong>in</strong>.<br />
& mangerial<br />
1.6<br />
1.7<br />
Technical<br />
support<br />
0.9<br />
1.3<br />
All others
<strong>Characteristics</strong> <strong>of</strong> <strong>Work</strong>-related <strong>Injuries</strong> <strong>and</strong> <strong>Illnesses</strong> <strong>in</strong> Ma<strong>in</strong>e 1999_________________<br />
Table 1. Disabl<strong>in</strong>g Cases by Occupational Groups, Ma<strong>in</strong>e, 1997-1999<br />
Occupational Groups<br />
Disabl<strong>in</strong>g Cases<br />
1997 1998 1999<br />
Number Percent Number Percent Number Percent<br />
Total 12,718 100.0 12,863 100.0 16,561 100.0<br />
Service <strong>Work</strong>er 2,200 17.3 2,350 18.3 3,099 18.7<br />
Precision Production, Craft or Repair 2,210 17.4 2,331 18.1 2,965 17.9<br />
H<strong>and</strong>ler, Equipment Cleaner, or Laborer 2,075 16.3 2,132 16.6 2,745 16.6<br />
Mach<strong>in</strong>e Operator, Assembler or Inspector 1,294 10.2 1,250 9.7 1,689 10.2<br />
Transportation or Material H<strong>and</strong>ler 1,199 9.4 1,192 9.3 1,543 9.3<br />
Adm<strong>in</strong>istration Support-Clerical 882 6.9 936 7.3 1,103 6.7<br />
Pr<strong>of</strong>essional Specialty 707 5.6 628 4.9 852 5.1<br />
Sales Occupation 698 5.5 639 5.0 783 4.7<br />
Farm<strong>in</strong>g, Fish<strong>in</strong>g, or Forestry Occupation 364 2.9 391 3.0 441 2.7<br />
Executive Adm<strong>in</strong>istrative or Managerial 314 2.5 268 2.1 421 2.5<br />
Protective Service 392 3.1 376 2.9 418 2.5<br />
Technician/Support Occupation 180 1.4 212 1.6 282 1.7<br />
Unknown 192 1.5 139 1.1 209 1.3<br />
Private Household 11 0.1 15 0.1 10 0.1<br />
Military Occupation 0 0.0 4 0.0 1 0.0<br />
_________________________________________________________________________________________<br />
Ma<strong>in</strong>e Department <strong>of</strong> Labor 5<br />
Bureau <strong>of</strong> Labor St<strong>and</strong>ards
Age <strong>of</strong> Injured or Ill <strong>Work</strong>er<br />
<strong>Characteristics</strong> <strong>of</strong> <strong>Work</strong>-related <strong>Injuries</strong> <strong>and</strong> <strong>Illnesses</strong> <strong>in</strong> Ma<strong>in</strong>e 1999_________________<br />
The percentage <strong>of</strong> cases <strong>in</strong> each age category is fairly<br />
consistent for 1997 through 1999. The greatest percentage<br />
<strong>of</strong> disabl<strong>in</strong>g work-related cases (15%) oc-<br />
Table 2. Disabl<strong>in</strong>g Cases by Age <strong>of</strong> Injured or Ill <strong>Work</strong>er, Ma<strong>in</strong>e 1997-1999<br />
Figure 3 below shows that disabl<strong>in</strong>g <strong>in</strong>juries <strong>and</strong> illnesses occur most <strong>of</strong>ten to employees between the ages <strong>of</strong><br />
30 <strong>and</strong> 44, who reported nearly 42% <strong>of</strong> all disabl<strong>in</strong>g cases <strong>in</strong> 1999.<br />
Percent <strong>of</strong> Disabl<strong>in</strong>g Cases<br />
Age <strong>of</strong> Injured<br />
or Ill <strong>Work</strong>er<br />
Figure 3.<br />
20<br />
18<br />
16<br />
14<br />
12<br />
10<br />
8<br />
6<br />
4<br />
2<br />
0<br />
2.2<br />
2.1<br />
2.7<br />
Under<br />
19<br />
11.4<br />
11.9<br />
13.3<br />
Age <strong>of</strong> Injured <strong>Work</strong>er<br />
Percent <strong>of</strong> Disabl<strong>in</strong>g Cases, Ma<strong>in</strong>e, 1997-1999<br />
12.9<br />
12.3<br />
12.1<br />
1997 1998 1999<br />
14.2<br />
13.2<br />
13.0<br />
15.0<br />
15.7<br />
15.2<br />
13.9<br />
13.7<br />
13.3<br />
10.6<br />
10.6<br />
10.9<br />
8.1<br />
8.5<br />
8.5<br />
5.3<br />
5.6<br />
5.5<br />
5.0<br />
5.7<br />
5.5<br />
1.3<br />
0.7<br />
0.1<br />
19-24 25-29 30-34 35-39 40-44 45-49 50-54 55-59 60+ UNK<br />
Age Group<br />
Disabl<strong>in</strong>g Cases<br />
1997 1998<br />
curred <strong>in</strong> the 35-39 age group. See Table 2 <strong>and</strong> Figure<br />
3 for details.<br />
Number Percent Number Percent Number Percent<br />
Total 12,718 100.0 12,863 100.0 16,561 100.0<br />
Under 19 years old 286 2.2 265 2.1 443 2.7<br />
19-24 years old 1,454 11.4 1,527 11.9 2,196 13.3<br />
25-29 years old 1,636 12.9 1,587 12.3 1,997 12.1<br />
30-34 years old 1,807 14.2 1,700 13.2 2,160 13.0<br />
35-39 years old 1,914 15.0 2,018 15.7 2,523 15.2<br />
40-44 years old 1,767 13.9 1,762 13.7 2,201 13.3<br />
45-49 years old 1,350 10.6 1,361 10.6 1,802 10.9<br />
50-54 years old 1,033 8.1 1,099 8.5 1,401 8.5<br />
55-59 years old 677 5.3 718 5.6 913 5.5<br />
60+ years old 635 5.0 731 5.7 911 5.5<br />
Unknown age 159 1.3 95 0.7 14 0.1<br />
_________________________________________________________________________________________<br />
Ma<strong>in</strong>e Department <strong>of</strong> Labor 6<br />
Bureau <strong>of</strong> Labor St<strong>and</strong>ards<br />
1999
<strong>Characteristics</strong> <strong>of</strong> <strong>Work</strong>-related <strong>Injuries</strong> <strong>and</strong> <strong>Illnesses</strong> <strong>in</strong> Ma<strong>in</strong>e 1999_________________<br />
Length <strong>of</strong> Service <strong>of</strong> Injured or Ill <strong>Work</strong>er<br />
Table 3 depicts the length <strong>of</strong> service at the time the<br />
work-related <strong>in</strong>jury or illness occurred. In 1999, 6,226<br />
workers (37.6%) were <strong>in</strong>jured with<strong>in</strong> the first year with<br />
their current employer, an <strong>in</strong>crease <strong>of</strong> 1,739 cases<br />
(38.8%) from 1997. Figures 4 <strong>and</strong> 5 show that the number<br />
<strong>of</strong> workers <strong>in</strong>jured with<strong>in</strong> the first year with their<br />
current employer rose from the 9-year average <strong>of</strong> 32.5%<br />
to 37.6% for 1999.<br />
Table 3. Disabl<strong>in</strong>g Cases by Length <strong>of</strong> Service <strong>of</strong> Injured or Ill <strong>Work</strong>er, Ma<strong>in</strong>e, 1997-1999<br />
Length <strong>of</strong> Service <strong>of</strong><br />
Injured or Ill <strong>Work</strong>er<br />
Disabl<strong>in</strong>g Cases<br />
1997 1998 1999<br />
Number Percent Number Percent Number Percent<br />
Total 12,718 100.0 12,863 100.0 16,561 100.0<br />
Under 1 Year 4,487 35.3 4,783 37.2 6,226 37.6<br />
> 1 but < 2 Years 1,384 10.9 1,600 12.4 2,027 12.2<br />
> 2 but < 3 Years 957 7.5 878 6.8 1,163 7.0<br />
3-4 Years 1,165 9.2 1,135 8.8 1,407 8.5<br />
5-9 Years 2,119 16.7 1,808 14.1 2,077 12.5<br />
10-14 Years 974 7.7 1,190 9.3 1,700 10.3<br />
15-19 Years 660 5.2 540 4.2 616 3.7<br />
20 Years <strong>and</strong> Above 668 5.3 649 5.0 810 4.9<br />
Unknown 304 2.4 280 2.2 535 3.2<br />
Figure 4. Length <strong>of</strong> Service<br />
Figure 5. Length <strong>of</strong> Service<br />
Percent <strong>of</strong> Disabl<strong>in</strong>g Cases<br />
Percent <strong>of</strong> Disabl<strong>in</strong>g Cases<br />
Ma<strong>in</strong>e, 1990-1998<br />
Ma<strong>in</strong>e, 1999<br />
3 years<br />
<strong>and</strong> more<br />
45.9%<br />
2 years<br />
8.7%<br />
1 year<br />
12.9%<br />
Less<br />
than 1<br />
year<br />
32.5%<br />
3 years<br />
<strong>and</strong> more<br />
43.2%<br />
2 years<br />
7.0%<br />
1 year<br />
12.2%<br />
Key po<strong>in</strong>t: The number <strong>of</strong> new hires <strong>in</strong>jured on the job is on the rise. In 1997, 4,487<br />
workers who had been with their current employer less than one year lost time due to a<br />
work-related <strong>in</strong>jury or illness. This number rose to 6,226 <strong>in</strong> 1999, a nearly 39% <strong>in</strong>crease<br />
over this 2-year period. Nearly 57% <strong>of</strong> all <strong>in</strong>jured workers who lost time <strong>in</strong><br />
1999 had been with their employer less than three years.<br />
Less than<br />
1 year<br />
37.6%<br />
_________________________________________________________________________________________<br />
Ma<strong>in</strong>e Department <strong>of</strong> Labor 7<br />
Bureau <strong>of</strong> Labor St<strong>and</strong>ards
<strong>Characteristics</strong> <strong>of</strong> <strong>Work</strong>-related <strong>Injuries</strong> <strong>and</strong> <strong>Illnesses</strong> <strong>in</strong> Ma<strong>in</strong>e 1999_________________<br />
Part II<br />
<strong>Characteristics</strong><br />
<strong>of</strong> the Employer<br />
Ownership 10<br />
Industry 11<br />
Insurer Type 13<br />
County <strong>of</strong> Injury or Illness 14<br />
_________________________________________________________________________________________<br />
Ma<strong>in</strong>e Department <strong>of</strong> Labor 9<br />
Bureau <strong>of</strong> Labor St<strong>and</strong>ards
Ownership<br />
<strong>Characteristics</strong> <strong>of</strong> <strong>Work</strong>-related <strong>Injuries</strong> <strong>and</strong> <strong>Illnesses</strong> <strong>in</strong> Ma<strong>in</strong>e 1999_________________<br />
In 1999, employees who worked for private sector employers<br />
accounted for 14,400 cases (87%) <strong>of</strong> all disabl<strong>in</strong>g<br />
First Reports, an <strong>in</strong>crease <strong>of</strong> over 3,400 cases<br />
from 1997. The distribution <strong>of</strong> First Reports between<br />
the private <strong>and</strong> public sectors rema<strong>in</strong>ed fairly consistent<br />
from 1997-1999.<br />
Private sector employers comprise 85.5% <strong>of</strong> Ma<strong>in</strong>eís<br />
1999 total employment. The distribution <strong>of</strong> employment<br />
between the private <strong>and</strong> public sector has also<br />
rema<strong>in</strong>ed fairly consistent from 1997-1999, with private<br />
sector account<strong>in</strong>g for 85.2% <strong>of</strong> all employment<br />
<strong>in</strong> 1997 <strong>and</strong> 85.5% <strong>in</strong> 1999.<br />
Table 4. Disabl<strong>in</strong>g Cases by Ownership <strong>of</strong> Employers, Ma<strong>in</strong>e, 1997-1999<br />
Ownership <strong>of</strong><br />
Employers<br />
Total<br />
Number<br />
Reports<br />
Disabl<strong>in</strong>g Cases<br />
1997 1998 1999<br />
Percent<br />
Reports<br />
Percent<br />
Emplmt<br />
Number<br />
Reports<br />
Percent<br />
Reports<br />
Percent<br />
Emplmt<br />
*L<strong>in</strong>es add up to total. Local <strong>and</strong> State Government add up to the Public Sector.<br />
Source: Employment from Department <strong>of</strong> Labor, Labor Market Information Services.<br />
Number<br />
Reports<br />
Percent<br />
Reports<br />
Key po<strong>in</strong>t: Private sector employees<br />
<strong>in</strong>jured on the job <strong>in</strong> 1999 accounted<br />
for 87% (14,400) <strong>of</strong> all disabl<strong>in</strong>g<br />
work-related <strong>in</strong>juries <strong>and</strong> illnesses <strong>in</strong><br />
Ma<strong>in</strong>e that year.<br />
Percent<br />
Emplmt<br />
12,718 100.0 100.0 12,863 100.0 100.0 16,561 100.0 100.0<br />
*Private Sector 10,973 86.3 85.2 11,209 87.2 85.4 14,400 87.0 85.5<br />
*Public Sector 1,737 13.6 14.8 1,638 12.7 14.6 2,159 13.0 14.5<br />
Local Government 1,204 9.4 10.2 1,160 9.0 10.1 1,432 8.6 9.9<br />
State Government 533 4.2 4.6 478 3.7 4.5 727 4.4 4.6<br />
*Unknown 8 0.1 óñ 16 0.1 óñ 2 0.0 óñ<br />
Figure 6.<br />
Ownership <strong>of</strong> Employers<br />
Percent <strong>of</strong> Disabl<strong>in</strong>g Cases<br />
Ma<strong>in</strong>e, 1999<br />
Local<br />
8.6%<br />
State<br />
4.4%<br />
UNK<br />
0.0%<br />
Private<br />
87.0%<br />
_________________________________________________________________________________________<br />
Ma<strong>in</strong>e Department <strong>of</strong> Labor 10<br />
Bureau <strong>of</strong> Labor St<strong>and</strong>ards
Industry<br />
<strong>Characteristics</strong> <strong>of</strong> <strong>Work</strong>-related <strong>Injuries</strong> <strong>and</strong> <strong>Illnesses</strong> <strong>in</strong> Ma<strong>in</strong>e 1999_________________<br />
Table 5 shows the number <strong>and</strong> percent <strong>of</strong> disabl<strong>in</strong>g cases<br />
for the major <strong>in</strong>dustry divisions. In 1999, the services <strong>in</strong>dustry<br />
accounted for 30.4% <strong>of</strong> Ma<strong>in</strong>eís employment <strong>and</strong><br />
Table 5. Disabl<strong>in</strong>g Cases by Major Industry Division, Ma<strong>in</strong>e, 1997-1999<br />
Major Industry Division<br />
Number<br />
Reports<br />
21.4% <strong>of</strong> the disabl<strong>in</strong>g cases. The manufactur<strong>in</strong>g <strong>in</strong>dustry<br />
accounted for 15.4% <strong>of</strong> Ma<strong>in</strong>eís employment <strong>and</strong> 21.4%<br />
<strong>of</strong> disabl<strong>in</strong>g cases.<br />
Disabl<strong>in</strong>g Cases<br />
1997 1998 1999<br />
Percent<br />
Reports<br />
Percent<br />
Emplmt<br />
Number<br />
Reports<br />
Percent<br />
Reports<br />
Percent<br />
Emplmt<br />
Number<br />
Reports<br />
Percent<br />
Reports<br />
Percent<br />
Emplmt<br />
Total 12,718 100.0 100.0 12,863 100.0 100.0 16,561 100.0 100.0<br />
*Total Public Sector 1,737 13.6 15.0 1,638 12.7 14.6 2,159 13.0 14.5<br />
Educational Services 528 4.2 óñ 572 4.4 óñ 717 4.3 óñ<br />
Public Adm<strong>in</strong>istration 354 2.8 óñ 387 3.0 óñ 449 2.7 óñ<br />
Highway Department 202 1.6 óñ 218 1.7 óñ 266 1.6 óñ<br />
*Total Private Sector 10,973 86.3 85.0 11,209 87.1 85.4 14,400 87.0 85.5<br />
70-89 Services 2,819 22.2 29.0 2,936 22.8 30.0 3,551 21.4 30.4<br />
Health Services 1,103 8.7 10.0 1,149 8.9 10.0 1,672 10.1 9.8<br />
Bus<strong>in</strong>ess Services 516 4.1 3.8 519 4.0 4.0 317 1.9 4.0<br />
Social Services 367 2.9 3.7 410 3.2 3.8 561 3.4 4.0<br />
Hotels, Room<strong>in</strong>g Houses 224 1.8 1.8 201 1.6 1.8 264 1.6 1.9<br />
20-39 Manufactur<strong>in</strong>g 2,727 21.5 16.0 2,571 20.0 16.0 3,600 21.7 15.4<br />
Transportation Service 631 5.0 2.0 577 4.5 2.0 858 5.2 2.0<br />
Lumber & Wood Prod 456 3.6 1.9 449 3.5 1.9 543 3.3 1.8<br />
Food Product 343 2.7 1.2 309 2.4 1.1 567 3.4 1.2<br />
Paper & Allied Product 282 2.2 2.7 233 1.8 2.6 281 1.7 2.4<br />
Leather & Leather Prod 174 1.4 1.4 180 1.4 1.3 234 1.4 1.1<br />
52-59 Retail Trade 2,214 17.4 21.0 2,379 18.5 21.0 2,767 16.7 20.8<br />
Eat<strong>in</strong>g & Dr<strong>in</strong>k<strong>in</strong>g Places 537 4.2 6.5 538 4.2 6.4 705 4.3 6.2<br />
Food Stores 530 4.2 3.7 567 4.4 3.9 501 3.0 3.9<br />
Automotive Dealers 238 1.9 2.4 312 2.4 2.4 439 2.7 2.4<br />
15-17 Construction 1,016 8.0 4.0 1,078 8.4 5.0 1,616 9.8 4.9<br />
Special Trades 610 4.8 2.6 602 4.7 2.7 918 5.5 2.9<br />
Build<strong>in</strong>g Construction 315 2.5 1.0 335 2.6 1.1 512 3.1 1.2<br />
50-51 Wholesale Trade 833 6.6 4.8 873 6.8 5.0 1,199 7.2 4.7<br />
Nondurable Goods 524 4.1 óñ 585 4.6 óñ 839 5.1 óñ<br />
Durable Goods 309 2.4 óñ 288 2.2 óñ 360 2.2 óñ<br />
40-49 Trans. & Public Util 833 6.6 4.3 811 6.3 4.2 995 6.0 4.2<br />
Motor Freight Transport 433 3.4 óñ 414 3.2 óñ 518 3.1 óñ<br />
01-09 Agric./Fish./Forest 266 2.1 1.2 267 2.1 1.2 306 1.9 1.2<br />
60-67 F<strong>in</strong>ance/Ins/R.Est. 254 2.0 4.0 275 2.1 4.2 274 1.7 4.3<br />
Other & Unknown SIC 11 0.0 0.1 19 0.1 0.1 92 0.5 0.6<br />
*Unknown Ownership 8 0.1 óñ 16 0.1 óñ 2 0.0 óñ<br />
* L<strong>in</strong>es add up to total. The 2-digit SIC groups <strong>in</strong> bold add up to Total Private Sector. Subgroups listed are those<br />
with highest disabl<strong>in</strong>g <strong>in</strong>juries; they are not all-<strong>in</strong>clusive <strong>and</strong> do not add up to the group total.<br />
Source: Employment from Department <strong>of</strong> Labor, Labor Market Information Services.<br />
_________________________________________________________________________________________<br />
Ma<strong>in</strong>e Department <strong>of</strong> Labor 11<br />
Bureau <strong>of</strong> Labor St<strong>and</strong>ards
<strong>Characteristics</strong> <strong>of</strong> <strong>Work</strong>-related <strong>Injuries</strong> <strong>and</strong> <strong>Illnesses</strong> <strong>in</strong> Ma<strong>in</strong>e 1999_________________<br />
The manufactur<strong>in</strong>g <strong>in</strong>dustry is divided <strong>in</strong>to 20 major<br />
groups. Figure 7 shows the 10 major groups <strong>in</strong><br />
manufactur<strong>in</strong>g with the highest percentages <strong>of</strong> disabl<strong>in</strong>g<br />
work-related <strong>in</strong>juries <strong>and</strong> illnesses <strong>in</strong> 1999.<br />
Also shown is the percentage <strong>of</strong> total manufactur<strong>in</strong>g<br />
employment for these same groups.<br />
Employees <strong>in</strong> the manufactur<strong>in</strong>g <strong>of</strong> transportation<br />
Figure 7.<br />
Percent <strong>of</strong> Total Manufactur<strong>in</strong>g<br />
25<br />
20<br />
15<br />
10<br />
5<br />
0<br />
23.8<br />
Transp Equip(37)<br />
13.2<br />
15.8<br />
Food(20)<br />
7.8<br />
Selected Manufactur<strong>in</strong>g Groups<br />
Disabl<strong>in</strong>g Cases <strong>and</strong> Employment, Percent<br />
Ma<strong>in</strong>e, 1999<br />
15.1<br />
12.2<br />
Lumber &<br />
Wood(24)<br />
7.8<br />
15.9<br />
7.2<br />
6.5<br />
equipment reported 23.8% <strong>of</strong> all disabl<strong>in</strong>g manufactur<strong>in</strong>g<br />
<strong>in</strong>juries <strong>and</strong> illnesses <strong>in</strong> 1999, but accounted for<br />
only 13.2% <strong>of</strong> all Ma<strong>in</strong>e manufactur<strong>in</strong>g employment.<br />
Employees <strong>in</strong> the paper <strong>in</strong>dustry reported 7.8% <strong>of</strong><br />
the disabl<strong>in</strong>g cases <strong>in</strong> the manufactur<strong>in</strong>g section for<br />
1999, but accounted for 15.9% <strong>of</strong> Ma<strong>in</strong>eís manufactur<strong>in</strong>g<br />
employment.<br />
1999 Cases 1999 Employment<br />
Paper(26)<br />
Leather(31)<br />
5.2<br />
3.9<br />
_________________________________________________________________________________________<br />
Ma<strong>in</strong>e Department <strong>of</strong> Labor 12<br />
Bureau <strong>of</strong> Labor St<strong>and</strong>ards<br />
Mach<strong>in</strong>e &<br />
Comp(35)<br />
3.9<br />
8.2<br />
Electronic<br />
Equip(36)<br />
Major Manufactur<strong>in</strong>g Groups (St<strong>and</strong>ard Industrial Classification)<br />
3.6<br />
Pr<strong>in</strong>t<strong>in</strong>g & Pub(27)<br />
7.0<br />
4.4<br />
3.5 3.4 3.8<br />
Fabric Metal(34)<br />
Textile(22)
Insurer Type<br />
<strong>Characteristics</strong> <strong>of</strong> <strong>Work</strong>-related <strong>Injuries</strong> <strong>and</strong> <strong>Illnesses</strong> <strong>in</strong> Ma<strong>in</strong>e 1999_________________<br />
In 1999, 39.8% <strong>of</strong> the employees who reported a disabl<strong>in</strong>g<br />
work-related <strong>in</strong>jury or illness <strong>in</strong> Ma<strong>in</strong>e worked<br />
for employers who were self-<strong>in</strong>sured. Third Party Adm<strong>in</strong>istrator<br />
(TPA) <strong>in</strong>surance companies are on the rise<br />
<strong>in</strong> Ma<strong>in</strong>e. Carriers, self-<strong>in</strong>sured employers, or self-<br />
Table 6. Disabl<strong>in</strong>g Cases by Insurer Type, Ma<strong>in</strong>e, 1997-1999<br />
Insurer Type<br />
<strong>in</strong>sured groups can subcontract the claims adjustment<br />
to a Third Party Adm<strong>in</strong>istrator, which specializes <strong>in</strong><br />
adjust<strong>in</strong>g workersí compensation claims. Claims h<strong>and</strong>led<br />
through a TPA <strong>in</strong>creased from 70 <strong>in</strong> 1997 to 229<br />
<strong>in</strong> 1999.<br />
Disabl<strong>in</strong>g Cases<br />
1997 1998 1999<br />
Number Percent Number Percent Number Percent<br />
Total 12,718 100.0 12,863 100.0 16,561 100.0<br />
Private 7,371 58.0 7,593 59.0 9,354 56.5<br />
Self-Insured 5,103 40.1 5,055 39.3 6,595 39.8<br />
TPA 70 0.6 108 0.8 229 1.4<br />
Not Insured 174 1.4 107 0.8 383 2.3<br />
Figure 8.<br />
Number <strong>of</strong> Disabl<strong>in</strong>g Cases<br />
18,000<br />
16,000<br />
14,000<br />
12,000<br />
10,000<br />
8,000<br />
6,000<br />
4,000<br />
2,000<br />
0<br />
Insurer Type<br />
Number <strong>of</strong> Disabl<strong>in</strong>g Cases<br />
Ma<strong>in</strong>e, 1999<br />
Private Self-Insured TPA Not Insured<br />
1997 1998 1999<br />
Year <strong>of</strong> Injury or Illness<br />
Key po<strong>in</strong>t: 9,354 cases<br />
(56.5%) <strong>in</strong>volved workers<br />
employed by companies<br />
with private workersí<br />
compensation <strong>in</strong>surance<br />
company.<br />
_________________________________________________________________________________________<br />
Ma<strong>in</strong>e Department <strong>of</strong> Labor 13<br />
Bureau <strong>of</strong> Labor St<strong>and</strong>ards
County <strong>of</strong> Injury or Illness<br />
<strong>Characteristics</strong> <strong>of</strong> <strong>Work</strong>-related <strong>Injuries</strong> <strong>and</strong> <strong>Illnesses</strong> <strong>in</strong> Ma<strong>in</strong>e 1999_________________<br />
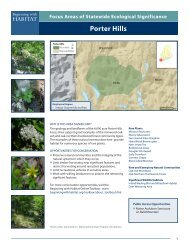
Figure 9 shows the distribution <strong>of</strong> disabl<strong>in</strong>g workrelated<br />
<strong>in</strong>juries <strong>and</strong> illnesses by county <strong>in</strong> 1999. Androscogg<strong>in</strong>,<br />
Cumberl<strong>and</strong>, Kennebec, Penobscot <strong>and</strong><br />
Figure 9. Disabl<strong>in</strong>g Cases by Ma<strong>in</strong>e County<br />
1999<br />
Cumberl<strong>and</strong><br />
York<br />
Frankl<strong>in</strong><br />
Oxford<br />
Somerset<br />
Andro.<br />
Kennebec<br />
Piscataquis<br />
Waldo<br />
Knox<br />
L<strong>in</strong>coln<br />
Sagadahoc<br />
York counties had the highest number <strong>of</strong> cases. The<br />
same counties also had the highest average employment<br />
for that year.<br />
Aroostook<br />
Penobscot<br />
Hancock<br />
Wash<strong>in</strong>gton<br />
Number <strong>of</strong> Cases<br />
123-300<br />
301-1,000<br />
1,001-4,281<br />
_________________________________________________________________________________________<br />
Ma<strong>in</strong>e Department <strong>of</strong> Labor 14<br />
Bureau <strong>of</strong> Labor St<strong>and</strong>ards
<strong>Characteristics</strong> <strong>of</strong> <strong>Work</strong>-related <strong>Injuries</strong> <strong>and</strong> <strong>Illnesses</strong> <strong>in</strong> Ma<strong>in</strong>e 1999_________________<br />
Table 7 shows the number <strong>of</strong> disabl<strong>in</strong>g <strong>in</strong>juries <strong>and</strong><br />
illnesses by county, the employment by county <strong>and</strong><br />
the rate <strong>of</strong> <strong>in</strong>jury for each county. The rate is calculated<br />
by divid<strong>in</strong>g the employment by the number <strong>of</strong><br />
<strong>in</strong>juries <strong>and</strong> multiply<strong>in</strong>g this number by 1,000. This<br />
give the rate per 1,000 workers.<br />
The statewide <strong>in</strong>jury rate for 1999 was 29.6 per<br />
Table 7. Disabl<strong>in</strong>g Cases by County , Ma<strong>in</strong>e, 1997-1999<br />
County<br />
Disabl<strong>in</strong>g<br />
Cases<br />
1997 1998 1999<br />
Employment<br />
Rate/<br />
1,000<br />
Disabl<strong>in</strong>g<br />
cases<br />
Employment<br />
_________________________________________________________________________________________<br />
Ma<strong>in</strong>e Department <strong>of</strong> Labor 15<br />
Bureau <strong>of</strong> Labor St<strong>and</strong>ards<br />
Rate/<br />
1,000<br />
Disabl<strong>in</strong>g<br />
Cases<br />
Employment<br />
Total 12,718 531,054 23.9 12,863 544,996 23.6 16,561 560,368 29.6<br />
Androscogg<strong>in</strong> 1,077 42,529 25.3 1,103 43,882 25.1 1,485 45,674 32.5<br />
Aroostook 653 27,843 23.5 663 28,586 23.2 775 29,044 26.7<br />
Cumberl<strong>and</strong> 3,482 151,663 23.0 3,376 154,789 21.8 4,281 157,481 27.2<br />
Frankl<strong>in</strong> 220 11,202 19.6 250 11,293 22.1 282 11,781 23.9<br />
Hancock 523 20,338 25.7 515 20,819 24.7 589 21,533 27.4<br />
Kennebec 1,189 53,945 22.0 1,210 53,862 22.5 1,564 54,318 28.8<br />
Knox 366 16,109 22.7 392 16,274 24.1 464 16,551 28.0<br />
L<strong>in</strong>coln 198 9,953 19.9 215 10,297 20.9 279 10,453 26.7<br />
Oxford 430 16,871 25.5 412 17,414 23.7 553 17,680 31.3<br />
Penobscot 1,286 62,508 20.6 1,342 64,099 20.9 1,614 65,461 24.7<br />
Piscataquis 106 5,732 18.5 107 5,767 18.6 123 5,747 21.4<br />
Sagadahoc 734 14,075 52.1 694 14,921 46.5 1,014 15,781 64.3<br />
Somerset 393 17,818 22.1 451 18,183 24.8 554 18,939 29.3<br />
Waldo 232 8,672 26.8 320 9,007 35.5 332 9,843 33.7<br />
Wash<strong>in</strong>gton 321 11,150 28.8 310 11,426 27.1 435 11,528 37.7<br />
York 1,307 53,296 24.5 1,326 54,584 24.3 1,743 57,780 30.2<br />
*Other 201 7350 -- 177 9,793 -- 474 10,774 --<br />
*Other-<br />
for disabl<strong>in</strong>g cases <strong>in</strong>cludes other state, or unknown county <strong>of</strong> <strong>in</strong>jury;<br />
for employment, <strong>in</strong>cludes <strong>in</strong>ter-county.<br />
1,000 workers. This means, for every 1,000 workers<br />
<strong>in</strong> Ma<strong>in</strong>e, approximately 29 were <strong>in</strong>jured at work.<br />
This <strong>in</strong>jury rate is an <strong>in</strong>crease from the 1997 rate <strong>of</strong><br />
23.9. Sagadahoc County shows the highest rate for<br />
1999, with 64.3 per 1,000 workers. Piscataquis had<br />
the lowest <strong>in</strong>jury rate <strong>of</strong> 21.4 per 1,000 workers.<br />
Rate/<br />
1,000
<strong>Characteristics</strong> <strong>of</strong> <strong>Work</strong>-related <strong>Injuries</strong> <strong>and</strong> <strong>Illnesses</strong> <strong>in</strong> Ma<strong>in</strong>e 1999_________________<br />
Part III<br />
<strong>Characteristics</strong><br />
<strong>of</strong> the Incident<br />
Month 18<br />
Day <strong>of</strong> the Week 19<br />
Nature <strong>of</strong> Injury or Illness 20<br />
Part <strong>of</strong> Body Affected 23<br />
Source <strong>of</strong> Injury or Illness 26<br />
Event or Exposure 32<br />
Occupation <strong>of</strong> Injured or Ill <strong>Work</strong>er 36<br />
Nature & Part Comb<strong>in</strong>ation 41<br />
Nature & Event or Exposure Comb<strong>in</strong>ation 42<br />
Nature & Source Comb<strong>in</strong>ation 43<br />
Source & Event or Exposure Comb<strong>in</strong>ation 44<br />
_________________________________________________________________________________________<br />
Ma<strong>in</strong>e Department <strong>of</strong> Labor 17<br />
Bureau <strong>of</strong> Labor St<strong>and</strong>ards
Month<br />
<strong>Characteristics</strong> <strong>of</strong> <strong>Work</strong>-related <strong>Injuries</strong> <strong>and</strong> <strong>Illnesses</strong> <strong>in</strong> Ma<strong>in</strong>e 1999_________________<br />
The percent <strong>of</strong> 1999 disabl<strong>in</strong>g work-related <strong>in</strong>juries<br />
<strong>and</strong> illnesses per month ranged from 7.3% <strong>in</strong> December<br />
to 9.5% <strong>in</strong> January.<br />
The percentages <strong>of</strong> disabl<strong>in</strong>g work-related <strong>in</strong>juries<br />
<strong>and</strong> illnesses per month have rema<strong>in</strong>ed fairly consistent<br />
over the past decade. See Table 8 for details.<br />
Table 8. Disabl<strong>in</strong>g Cases by Month <strong>of</strong> Occurrence, Ma<strong>in</strong>e, 1997-1999<br />
Month <strong>of</strong> Occurrence<br />
Disabl<strong>in</strong>g Cases<br />
1997 1998 1999<br />
Number Percent Number Percent Number Percent<br />
Total 12,718 100.0 12,863 100.0 16,561 100.0<br />
January 1,176 9.2 1,224 9.5 1,579 9.5<br />
February 986 7.8 970 7.5 1,248 7.5<br />
March 1,045 8.2 1,086 8.4 1,354 8.2<br />
April 949 7.5 1,003 7.8 1,257 7.6<br />
May 1,056 8.3 1,029 8.0 1,248 7.5<br />
June 1,075 8.5 1,074 8.3 1,467 8.9<br />
July 1,085 8.5 1,144 8.9 1,507 9.1<br />
August 1,080 8.5 1,215 9.4 1,539 9.3<br />
September 1,142 9.0 1,106 8.6 1,473 8.9<br />
October 1,150 9.0 1,079 8.4 1,404 8.5<br />
November 1,012 8.0 923 7.2 1,278 7.7<br />
December 962 7.6 1,010 7.9 1,207 7.3<br />
Figure 10.<br />
Percent <strong>of</strong> Disabl<strong>in</strong>g Cases<br />
12<br />
10<br />
8<br />
6<br />
4<br />
2<br />
0<br />
9.4 9.5<br />
January<br />
8.2<br />
February<br />
7.5<br />
Month <strong>of</strong> Occurence<br />
Percent <strong>of</strong> Disabl<strong>in</strong>g Cases, Ma<strong>in</strong>e, 1990-1998, 1999<br />
8.7<br />
March<br />
8.2<br />
8.0<br />
April<br />
1990-1998 1999<br />
7.6<br />
8.3<br />
7.5<br />
May<br />
8.8 9.3<br />
8.5 8.9 9.1 9.3<br />
June<br />
_________________________________________________________________________________________<br />
Ma<strong>in</strong>e Department <strong>of</strong> Labor 18<br />
Bureau <strong>of</strong> Labor St<strong>and</strong>ards<br />
July<br />
Month <strong>of</strong> Injury or Illness<br />
August<br />
8.2<br />
September<br />
8.9<br />
8.5<br />
October<br />
8.5<br />
7.2<br />
November<br />
7.7<br />
6.9<br />
7.3<br />
December
Day <strong>of</strong> the Week<br />
<strong>Characteristics</strong> <strong>of</strong> <strong>Work</strong>-related <strong>Injuries</strong> <strong>and</strong> <strong>Illnesses</strong> <strong>in</strong> Ma<strong>in</strong>e 1999_________________<br />
In 1999, 87.8% <strong>of</strong> all disabl<strong>in</strong>g <strong>in</strong>juries <strong>and</strong> illnesses<br />
occurred on weekdays, a slight decrease from the<br />
1990-1998 average <strong>of</strong> 88.1%. See Figure 12 for details.<br />
In 1999, the highest number <strong>of</strong> disabl<strong>in</strong>g work-<br />
Table 9. Disabl<strong>in</strong>g Cases by Day <strong>of</strong> the Week, Ma<strong>in</strong>e, 1997-1999<br />
Day <strong>of</strong> the Week<br />
related <strong>in</strong>juries <strong>and</strong> illnesses occurred on Mondays,<br />
with 3,237 cases (19.5%), a slight decrease from the<br />
1990-1998 average <strong>of</strong> 19.9%. See Table 9 for details.<br />
Disabl<strong>in</strong>g Cases<br />
1997 1998 1999<br />
Number Percent Number Percent Number Percent<br />
Total 12,718 100.0 12,863 100.0 16,561 100.0<br />
Sunday 687 5.4 678 5.3 893 5.4<br />
Monday 2,525 19.9 2,660 20.7 3,237 19.6<br />
Tuesday 2,312 18.2 2,287 17.8 3,032 18.3<br />
Wednesday 2,154 16.9 2,296 17.8 2,896 17.5<br />
Thursday 2,140 16.8 2,188 17.0 2,817 17.0<br />
Friday 1,962 15.4 1,881 14.6 2,556 15.4<br />
Saturday 938 7.4 873 6.8 1,130 6.8<br />
Figure 11.<br />
Percent <strong>of</strong> Disabl<strong>in</strong>g Cases<br />
25<br />
20<br />
15<br />
10<br />
5<br />
0<br />
5.1 5.4<br />
Day <strong>of</strong> the Week <strong>of</strong> Injury or Illness<br />
Percent <strong>of</strong> Disabl<strong>in</strong>g Cases , Ma<strong>in</strong>e, 1990-1998, 1999<br />
19.9<br />
19.6<br />
1990-1998 1999<br />
18.2 18.3<br />
17.7<br />
17.1 17.0<br />
Sunday Monday Tuesday Wednesday Thursday Friday Saturday<br />
_________________________________________________________________________________________<br />
Ma<strong>in</strong>e Department <strong>of</strong> Labor 19<br />
Bureau <strong>of</strong> Labor St<strong>and</strong>ards<br />
17.5<br />
Day <strong>of</strong> the Week <strong>of</strong> Injury or Illness<br />
15.2<br />
15.4<br />
6.8<br />
6.8
Nature <strong>of</strong> Injury or Illness<br />
Systemic<br />
7.0%<br />
<strong>Characteristics</strong> <strong>of</strong> <strong>Work</strong>-related <strong>Injuries</strong> <strong>and</strong> <strong>Illnesses</strong> <strong>in</strong> Ma<strong>in</strong>e 1999_________________<br />
Nearly 81% (13,402) <strong>of</strong> all disabl<strong>in</strong>g work-related <strong>in</strong>juries<br />
<strong>and</strong> illnesses <strong>in</strong> 1999 resulted from traumatic<br />
<strong>in</strong>juries <strong>and</strong> disorders, a 28.7% <strong>in</strong>crease from 1998.<br />
Over 31% (5,166) <strong>of</strong> all cases were due to spra<strong>in</strong>s,<br />
stra<strong>in</strong>s, <strong>and</strong> tears. Another 19.8% (3,279) were due to<br />
nonspecified pa<strong>in</strong>, sore, hurt (used when First Reports<br />
are filed with vague descriptions <strong>of</strong> the <strong>in</strong>jury). Generally,<br />
a traumatic <strong>in</strong>jury or illness is the result <strong>of</strong> a<br />
Figure 12. Nature <strong>of</strong> Injury or Illness<br />
Percent <strong>of</strong> Disabl<strong>in</strong>g Cases, Ma<strong>in</strong>e, 1999<br />
Percent <strong>of</strong> Disabl<strong>in</strong>g Cases<br />
Vague Symptoms<br />
3.4%<br />
All other<br />
6.4%<br />
N=16,561<br />
Figure 14.<br />
35<br />
30<br />
25<br />
20<br />
15<br />
10<br />
5<br />
0<br />
Anxiety<br />
2.3%<br />
Traumatic<br />
Injury 80.9%<br />
Top Five Natures <strong>of</strong> <strong>Injuries</strong> <strong>and</strong> <strong>Illnesses</strong><br />
Percent <strong>of</strong> Total Disabl<strong>in</strong>g Cases, Ma<strong>in</strong>e, 1993-1999<br />
1993 1994 1995 1996 1997 1998 1999<br />
Year <strong>of</strong> Injury or Illness<br />
s<strong>in</strong>gle <strong>in</strong>cident, event, or exposure. Figure 12 shows<br />
the breakdown <strong>of</strong> all the disabl<strong>in</strong>g <strong>in</strong>juries <strong>and</strong> illnesses<br />
by the nature <strong>of</strong> the <strong>in</strong>jury for 1999. Figure 13<br />
shows the different k<strong>in</strong>ds <strong>of</strong> traumatic <strong>in</strong>juries for<br />
1999. Spra<strong>in</strong>s, stra<strong>in</strong>s, tears <strong>and</strong> pa<strong>in</strong>, sore hurt accounted<br />
for 38.5% <strong>of</strong> all disabl<strong>in</strong>g traumatic <strong>in</strong>juries<br />
See Table 10 on page 21 for details.<br />
Figure 13. Traumatic <strong>Injuries</strong><br />
Percent <strong>of</strong> Disabl<strong>in</strong>g Cases, Ma<strong>in</strong>e, 1999<br />
Multiple traum<br />
<strong>in</strong>juries 1.6%<br />
Burns 2.2%<br />
Dislocations<br />
fractures 6.6%<br />
Open wounds<br />
7.8%<br />
Traumatic <strong>in</strong>juries<br />
UNS 8.5%<br />
All other<br />
0.7%<br />
Surface wounds<br />
& bruises 9.6%<br />
Spra<strong>in</strong>s, stra<strong>in</strong>s<br />
38.5%<br />
Pa<strong>in</strong>, sore, hurt<br />
24.5%<br />
Spra<strong>in</strong>s, stra<strong>in</strong>s,<br />
tears<br />
Pa<strong>in</strong>, sore, hurt<br />
ex. back<br />
Back pa<strong>in</strong><br />
Traumatic <strong>in</strong>jury<br />
UNS<br />
Bruises<br />
N=13,402<br />
Figure 15 shows the top five codes used to code the nature <strong>of</strong> the <strong>in</strong>jury or illness for 1993-1999 These five codes<br />
accounted for nearly 63% <strong>of</strong> all disabl<strong>in</strong>g work-related <strong>in</strong>juries <strong>and</strong> illnesses <strong>in</strong> Ma<strong>in</strong>e for 1999.<br />
_________________________________________________________________________________________<br />
Ma<strong>in</strong>e Department <strong>of</strong> Labor 20<br />
Bureau <strong>of</strong> Labor St<strong>and</strong>ards
<strong>Characteristics</strong> <strong>of</strong> <strong>Work</strong>-related <strong>Injuries</strong> <strong>and</strong> <strong>Illnesses</strong> <strong>in</strong> Ma<strong>in</strong>e 1999_________________<br />
Table 10. Disabl<strong>in</strong>g Cases by Nature <strong>of</strong> Injury or Illness, Ma<strong>in</strong>e, 1997-1999<br />
Nature <strong>of</strong> Injury or Illness<br />
Disabl<strong>in</strong>g Cases<br />
1997 1998 1999<br />
Number Percent Number Percent Number Percent<br />
Total 12,718 100.0 12,863 100.0 16,561 100.0<br />
*Traumatic <strong>Injuries</strong> & Disorders 9,951 78.2 10,410 80.9 13,402 80.9<br />
Traumatic <strong>in</strong>juries to muscles/tendons 3,156 24.8 3,320 25.8 5,166 31.2<br />
Spra<strong>in</strong>s, stra<strong>in</strong>s, tears 3,156 24.8 3,320 25.8 5,164 31.2<br />
Nonspecified pa<strong>in</strong>, sore, hurt 3,081 24.2 2,980 23.2 3,279 19.8<br />
Soreness, pa<strong>in</strong>, hurt, except back 1,770 13.9 1,753 13.6 1,894 11.4<br />
Back pa<strong>in</strong>, hurt back 1,212 9.5 1,113 8.7 1,190 7.2<br />
Crush<strong>in</strong>g <strong>in</strong>juries 67 0.5 83 0.6 117 0.7<br />
Surface wounds & bruises 770 6.1 895 7.0 1,288 7.8<br />
Bruises, contusions 605 4.8 708 5.5 1,027 6.2<br />
Foreign bodies-superficial spl<strong>in</strong>ter 95 0.7 97 0.8 163 1.0<br />
Abrasions, scratches 68 0.5 87 0.7 91 0.5<br />
Traumatic <strong>in</strong>juries & disorders, UNS 1,019 8.0 1,188 9.2 1,137 6.9<br />
Traumatic <strong>in</strong>j-bones nerves sp<strong>in</strong>al cd 772 6.1 730 5.7 888 5.4<br />
Fractures 675 5.3 646 5.0 743 4.5<br />
Dislocations 97 0.8 84 0.7 143 0.9<br />
Open wounds 778 6.1 823 6.4 1,048 6.3<br />
Amputations 61 0.5 50 0.4 38 0.2<br />
Amputations, f<strong>in</strong>gertip 34 0.3 32 0.2 17 0.1<br />
Amputations, except f<strong>in</strong>gertip 27 0.2 18 0.1 21 0.1<br />
Animal or <strong>in</strong>sect bites 25 0.2 22 0.2 38 0.2<br />
Cuts, lacerations 576 4.5 633 4.9 774 4.7<br />
Punctures, except bites 114 0.9 117 0.9 191 1.2<br />
Burns 162 1.3 229 1.8 290 1.8<br />
Heat burns, scalds 104 0.8 164 1.3 216 1.3<br />
Chemical burns 44 0.3 61 0.5 66 0.4<br />
Multiple traumatic <strong>in</strong>juries & disorders 150 1.2 189 1.5 215 1.3<br />
Spra<strong>in</strong>s & bruises 52 0.4 48 0.4 85 0.5<br />
Cuts, abrasions, bruises 55 0.4 71 0.6 68 0.4<br />
Fractures & other <strong>in</strong>juries 31 0.2 61 0.5 48 0.3<br />
Intracranial <strong>in</strong>juries (concussion) 54 0.4 48 0.4 74 0.4<br />
Effects <strong>of</strong> environmental conditions 9 0.1 8 0.1 17 0.1<br />
Cont<strong>in</strong>ued on next page<br />
_________________________________________________________________________________________<br />
Ma<strong>in</strong>e Department <strong>of</strong> Labor 21<br />
Bureau <strong>of</strong> Labor St<strong>and</strong>ards
<strong>Characteristics</strong> <strong>of</strong> <strong>Work</strong>-related <strong>Injuries</strong> <strong>and</strong> <strong>Illnesses</strong> <strong>in</strong> Ma<strong>in</strong>e 1999_________________<br />
Table 10. Disabl<strong>in</strong>g Cases by Nature <strong>of</strong> Injury or Illness (cont.)<br />
Nature <strong>of</strong> Injury or Illness<br />
Disabl<strong>in</strong>g Cases<br />
1997 1998 1999<br />
Number Percent Number Percent Number Percent<br />
*Systemic Diseases & Disorders 829 6.5 830 6.5 1,156 7.0<br />
Nervous system & sense organs dis 144 1.1 157 1.2 244 1.5<br />
Disorders <strong>of</strong> peripheral nervous sys 117 0.9 123 1.0 177 1.1<br />
Carpal tunnel syndrome 111 0.9 121 0.9 175 1.1<br />
Disorders <strong>of</strong> the eye, adnexa, vision 18 0.1 26 0.2 55 0.3<br />
Welders flash 16 0.1 23 0.2 41 0.2<br />
Circulatory system disease (heart attack) 65 0.5 67 0.5 53 0.3<br />
Respiratory system diseases 53 0.4 59 0.5 92 0.6<br />
Digestive system diseases & disorders 137 1.1 160 1.2 198 1.2<br />
Hernia 136 1.1 159 1.2 198 1.2<br />
Musculoskeletal sys/connective tis dis 347 2.7 310 2.4 468 2.8<br />
Dorsopathies 36 0.3 34 0.3 64 0.4<br />
Rheumatism, except the back 308 2.4 274 2.1 397 2.4<br />
Tendonitis 213 1.7 198 1.5 274 1.7<br />
Bursitis 25 0.2 22 0.2 23 0.1<br />
Ganglion cyst 17 0.1 11 0.1 16 0.1<br />
Disorders sk<strong>in</strong> & subcutaneous tissue 82 0.6 75 0.6 97 0.6<br />
Dermatitis 69 0.5 69 0.5 77 0.5<br />
*Symptoms, Signs, & Ill-Def<strong>in</strong>ed Cond 487 3.8 477 3.7 557 3.4<br />
Chest pa<strong>in</strong> 36 0.3 43 0.3 49 0.3<br />
*Other Diseases, Conditions, & Disorders 273 2.1 314 2.4 374 2.3<br />
Neurotic reaction to stress 244 1.9 282 2.2 339 2.0<br />
*Infectious & Parasitic Diseases 27 0.2 22 0.2 30 0.2<br />
*No Injury - Lost Time Only 6 0.0 10 0.1 14 0.1<br />
*Neoplasms, Tumors, & Cancer 3 0.0 1 0.0 7 0.0<br />
*Multiple disorders & Nonclassifiable 1,142 9.0 799 6.2 1,021 6.1<br />
*L<strong>in</strong>es add up to total. Subgroups listed are those with highest lost-time <strong>in</strong>juries; they are not all-<strong>in</strong>clusive<br />
<strong>and</strong> do not add up to the group total.<br />
UNS - Unspecified nature <strong>of</strong> <strong>in</strong>jury<br />
NEC - Not Elsewhere Classified-no specific code available for <strong>in</strong>jury described<br />
_________________________________________________________________________________________<br />
Ma<strong>in</strong>e Department <strong>of</strong> Labor 22<br />
Bureau <strong>of</strong> Labor St<strong>and</strong>ards
Part <strong>of</strong> Body Affected<br />
<strong>Characteristics</strong> <strong>of</strong> <strong>Work</strong>-related <strong>Injuries</strong> <strong>and</strong> <strong>Illnesses</strong> <strong>in</strong> Ma<strong>in</strong>e 1999_________________<br />
Table 11 on page 24 shows the parts <strong>of</strong> the body affected<br />
by disabl<strong>in</strong>g work-related <strong>in</strong>juries <strong>and</strong> illnesses<br />
<strong>in</strong> Ma<strong>in</strong>e from 1997 to 1999. There were 6,502<br />
(39.3%) <strong>in</strong>juries to the trunk <strong>in</strong> 1999, <strong>of</strong> which 4,102<br />
(24.8%) affected the back. Figure 15 shows the break-<br />
Figure 15. Part <strong>of</strong> Body Affected<br />
Percent <strong>of</strong> Disabl<strong>in</strong>g Cases, Ma<strong>in</strong>e, 1999<br />
Head<br />
5.1%<br />
N=16,561<br />
Percent <strong>of</strong> Disabl<strong>in</strong>g Cases<br />
16<br />
14<br />
12<br />
10<br />
8<br />
6<br />
4<br />
2<br />
0<br />
Body<br />
Systems<br />
3.4%<br />
Mtpl body<br />
parts<br />
10.0%<br />
Lower<br />
extrem.<br />
18.2%<br />
Unknown<br />
0.4%<br />
Neck<br />
2.3%<br />
Upper<br />
extrem.<br />
21.4%<br />
Trunk<br />
39.3%<br />
out <strong>of</strong> all major parts <strong>of</strong> the body <strong>in</strong>jured <strong>in</strong> 1999. Figure<br />
16 shows the parts <strong>of</strong> the trunk affected. The back<br />
was <strong>in</strong>jured the most frequently, account<strong>in</strong>g for 63.1%<br />
<strong>of</strong> all <strong>in</strong>juries to the trunk.<br />
Multiple<br />
trunk loc.<br />
3.3%<br />
Pelvic<br />
region<br />
5.3%<br />
Abdomen<br />
5.3%<br />
Shoulder<br />
15.3%<br />
Trunk part<br />
UNS<br />
0.2%<br />
Back<br />
63.1%<br />
_________________________________________________________________________________________<br />
Ma<strong>in</strong>e Department <strong>of</strong> Labor 23<br />
Bureau <strong>of</strong> Labor St<strong>and</strong>ards<br />
Chest<br />
7.6%<br />
Top Five Parts <strong>of</strong> the Body Affected<br />
Percent <strong>of</strong> Total Disabl<strong>in</strong>g Cases, Ma<strong>in</strong>e, 1993-1999<br />
1993 1994 1995 1996 1997 1998 1999<br />
Year <strong>of</strong> Injury or Illness<br />
Figure 16. Part <strong>of</strong> Trunk Injured<br />
Percent <strong>of</strong> Disabl<strong>in</strong>g Cases, Ma<strong>in</strong>e, 1999<br />
N=6,502<br />
Trunk part<br />
NEC<br />
0.0%<br />
Shown below <strong>in</strong> Figure 17 are the top five codes used for the parts <strong>of</strong> body <strong>in</strong>jured at work where the worker<br />
lost time. These five codes accounted for nearly 45% <strong>of</strong> all <strong>of</strong> the disabl<strong>in</strong>g cases <strong>in</strong> 1999.<br />
Figure 17.<br />
Lumbar region<br />
Multiple body<br />
parts<br />
Back UNS<br />
Knees<br />
F<strong>in</strong>gers
<strong>Characteristics</strong> <strong>of</strong> <strong>Work</strong>-related <strong>Injuries</strong> <strong>and</strong> <strong>Illnesses</strong> <strong>in</strong> Ma<strong>in</strong>e 1999_________________<br />
Table 11. Disabl<strong>in</strong>g Cases by Part <strong>of</strong> Body Affected, Ma<strong>in</strong>e, 1997-1999<br />
Part <strong>of</strong> Body Affected<br />
Disabl<strong>in</strong>g Cases<br />
1997 1998 1999<br />
Number Percent Number Percent Number Percent<br />
Total 12,718 100.0 12,863 100.0 16,561 100.0<br />
*Trunk 4,885 38.4 4,888 38.0 6,502 39.3<br />
Back, <strong>in</strong>clud<strong>in</strong>g sp<strong>in</strong>e, sp<strong>in</strong>al cord 3,126 24.6 3,089 24.0 4,102 24.8<br />
Lumbar region 1,565 12.3 1,655 12.9 2,432 14.7<br />
Back, <strong>in</strong>clud<strong>in</strong>g sp<strong>in</strong>e, sp<strong>in</strong>al cord, UNS 1,231 9.7 1,087 8.5 1,171 7.1<br />
Thoracic region 167 1.3 148 1.2 242 1.5<br />
Multiple back regions 90 0.7 119 0.9 171 1.0<br />
Coccygeal region 22 0.2 33 0.3 38 0.2<br />
Back, <strong>in</strong>clud<strong>in</strong>g sp<strong>in</strong>e, sp<strong>in</strong>al cord, NEC 33 0.3 37 0.3 32 0.2<br />
Shoulder, <strong>in</strong>clud<strong>in</strong>g clavicle, scapula 677 5.3 672 5.2 992 6.0<br />
Chest, <strong>in</strong>clud<strong>in</strong>g ribs, <strong>in</strong>ternal organs 337 2.6 373 2.9 492 3.0<br />
Chest, except <strong>in</strong>ternal loc <strong>of</strong> disease 232 1.8 261 2.0 336 2.0<br />
Lungs , pleura 47 0.4 49 0.4 106 0.6<br />
Heart 54 0.4 56 0.4 41 0.2<br />
Abdomen 239 1.9 265 2.1 343 2.1<br />
Pelvic region 302 2.4 332 2.6 343 2.1<br />
Hips 94 0.7 108 0.8 124 0.7<br />
Gro<strong>in</strong> 173 1.4 189 1.5 183 1.1<br />
Table Buttocks 11. Part <strong>of</strong> Body Injured, Disabl<strong>in</strong>g Cases, 19 Number 0.1 <strong>and</strong> Percent, 21 0.2 Ma<strong>in</strong>e, 1996-1998 25 0.2<br />
Multiple trunk locations 195 1.5 138 1.1 215 1.3<br />
*Upper extremities 2,623 20.6 2,607 20.3 3,542 21.4<br />
F<strong>in</strong>gers, f<strong>in</strong>gernails 771 6.1 740 5.8 996 6.0<br />
Wrists 542 4.3 555 4.3 804 4.9<br />
Arms 579 4.6 550 4.3 784 4.7<br />
Elbows 229 1.8 204 1.6 303 1.8<br />
Arms, UNS 174 1.4 150 1.2 184 1.1<br />
Forearms 96 0.8 100 0.8 173 1.0<br />
Upper arms 34 0.3 50 0.4 82 0.5<br />
Multiple arms locations 46 0.4 44 0.3 42 0.3<br />
H<strong>and</strong>s, except f<strong>in</strong>gers 423 3.3 431 3.4 549 3.3<br />
Multiple upper extremities locations 304 2.4 321 2.5 386 2.3<br />
Multiple upper extremities NEC 184 1.4 193 1.5 199 1.2<br />
H<strong>and</strong>s <strong>and</strong> wrists 46 0.4 61 0.5 75 0.5<br />
H<strong>and</strong>s <strong>and</strong> f<strong>in</strong>gers 40 0.3 41 0.3 58 0.4<br />
H<strong>and</strong>s <strong>and</strong> arms<br />
Cont<strong>in</strong>ued on next page<br />
34 0.3 25 0.2 47 0.3<br />
_________________________________________________________________________________________<br />
Ma<strong>in</strong>e Department <strong>of</strong> Labor 24<br />
Bureau <strong>of</strong> Labor St<strong>and</strong>ards
<strong>Characteristics</strong> <strong>of</strong> <strong>Work</strong>-related <strong>Injuries</strong> <strong>and</strong> <strong>Illnesses</strong> <strong>in</strong> Ma<strong>in</strong>e 1999_________________<br />
Table 11. Disabl<strong>in</strong>g Cases by Part <strong>of</strong> Body Affected (cont.)<br />
Part <strong>of</strong> Body Affected<br />
Disabl<strong>in</strong>g Cases<br />
1997 1998 1999<br />
Number Percent Number Percent Number Percent<br />
*Lower extremities 2,415 19.0 2,430 18.9 3,020 18.2<br />
Legs 1,277 10.0 1,323 10.3 1,581 9.5<br />
Knees 924 7.3 950 7.4 1,134 6.8<br />
Lower legs 103 0.8 142 1.1 169 1.0<br />
Legs, UNS 133 1.0 148 1.2 167 1.0<br />
Thighs 80 0.6 57 0.4 88 0.5<br />
Multiple legs locations 36 0.3 26 0.2 21 0.1<br />
Ankles 505 4.0 557 4.3 702 4.2<br />
Feet, except toes 370 2.9 352 2.7 502 3.0<br />
Feet, except toes, UNS 248 1.9 165 1.3 285 1.7<br />
Soles 62 0.5 53 0.4 94 0.6<br />
Multiple feet locations 40 0.3 100 0.8 76 0.5<br />
Feet, NEC 19 0.1 32 0.2 46 0.3<br />
Toes, toenails 125 1.0 106 0.8 120 0.7<br />
Multiple lower extremities locations 136 1.1 92 0.7 108 0.7<br />
Multiple lower extremities NEC 83 0.7 61 0.5 64 0.4<br />
Foot feet <strong>and</strong> ankles 30 0.2 21 0.2 29 0.2<br />
Lower extremities, UNS 2 0.0 0 0.0 7 0.0<br />
*Multiple Body Parts 1,441 11.3 1,521 11.8 1,657 10.0<br />
*Head 566 4.5 614 4.8 845 5.1<br />
Face 359 2.8 387 3.0 513 3.1<br />
Eyes 250 2.0 273 2.1 377 2.3<br />
Multiple face locations 42 0.3 48 0.4 43 0.3<br />
Nose, nasal cavity 18 0.1 21 0.2 21 0.1<br />
Mouth 15 0.1 12 0.1 19 0.1<br />
Forehead 19 0.1 14 0.1 15 0.1<br />
Head, UNS 92 0.7 92 0.7 165 1.0<br />
Cranial region, <strong>in</strong>clud<strong>in</strong>g skull 95 0.7 110 0.9 137 0.8<br />
Bra<strong>in</strong> 60 0.5 58 0.5 92 0.6<br />
Scalp 30 0.2 47 0.4 35 0.2<br />
Ears 16 0.1 13 0.1 22 0.1<br />
*Body Systems 422 3.3 463 3.6 558 3.4<br />
*Neck, Includ<strong>in</strong>g Throat 244 1.9 207 1.6 373 2.3<br />
*Other Body Parts & Nonclassifiable 122 1.0 133 1.0 64 0.4<br />
*L<strong>in</strong>es add up to total. Subgroups listed are those with highest lost-time <strong>in</strong>juries; they are not all-<strong>in</strong>clusive<br />
<strong>and</strong> do not add up to the group total.<br />
UNS - Unspecified nature <strong>of</strong> <strong>in</strong>jury<br />
NEC - Not Elsewhere Classified-no specific code available for <strong>in</strong>jury described<br />
_________________________________________________________________________________________<br />
Ma<strong>in</strong>e Department <strong>of</strong> Labor 25<br />
Bureau <strong>of</strong> Labor St<strong>and</strong>ards
Source <strong>of</strong> Injury or Illness<br />
<strong>Characteristics</strong> <strong>of</strong> <strong>Work</strong>-related <strong>Injuries</strong> <strong>and</strong> <strong>Illnesses</strong> <strong>in</strong> Ma<strong>in</strong>e 1999_________________<br />
The source <strong>of</strong> the <strong>in</strong>jury or illness identifies the object,<br />
substance, bodily motion or exposure that directly<br />
produced or affected the <strong>in</strong>jury or illness. In<br />
1999, the category <strong>of</strong> Persons, Plants, Animals <strong>and</strong><br />
M<strong>in</strong>erals was the source <strong>of</strong> <strong>in</strong>jury <strong>in</strong> 5,110 cases<br />
(30.9%) as shown <strong>in</strong> Figure 18. Figure 19 takes a<br />
closer look at the Persons, Plants, Animals <strong>and</strong> M<strong>in</strong>erals<br />
category, show<strong>in</strong>g that 70.2% <strong>of</strong> the <strong>in</strong>juries <strong>in</strong> this<br />
Figure 18. Source <strong>of</strong> Injury or Illness<br />
Percent <strong>of</strong> Disabl<strong>in</strong>g Cases, Ma<strong>in</strong>e, 1999<br />
Furniture &<br />
fixtures 2.9%<br />
Mach<strong>in</strong>ery<br />
4.8%<br />
Tools, Instr.<br />
Eq. 5.9%<br />
Vehicles<br />
6.1%<br />
Percent <strong>of</strong> Disabl<strong>in</strong>g Cases<br />
Parts &<br />
Materials<br />
7.9%<br />
25<br />
20<br />
15<br />
10<br />
5<br />
0<br />
Chemicals<br />
1.5%<br />
Conta<strong>in</strong>er<br />
10.9%<br />
Other & UNK<br />
13.1%<br />
Person,<br />
plant, animal,<br />
m<strong>in</strong>eral<br />
30.9%<br />
Structures &<br />
surfaces<br />
16.0%<br />
N=16,561<br />
category were due to the person <strong>in</strong>jured. Person <strong>in</strong>jured<br />
is used when the <strong>in</strong>jury occurred because <strong>of</strong> the<br />
workerís bodily motion (such as sitt<strong>in</strong>g, st<strong>and</strong><strong>in</strong>g,<br />
reach<strong>in</strong>g, from repetitive motion, or from a physical<br />
condition such as heart attack or stress). This code can<br />
only be used when no overexertion is <strong>in</strong>volved. See<br />
Table 12 on page 27 for details.<br />
Figure 19. Persons, Plants, Animals, M<strong>in</strong>erals<br />
Percent <strong>of</strong> Disabl<strong>in</strong>g Cases, Ma<strong>in</strong>e, 1999<br />
Nonmetallic<br />
m<strong>in</strong>erals<br />
1.2%<br />
Food<br />
Products<br />
1.7%<br />
Animals<br />
1.8%<br />
Infectious &<br />
parasitic<br />
0.9%<br />
Plants, trees,<br />
veg.<br />
2.8%<br />
Top Five Sources <strong>of</strong> Injury or Illness<br />
Percent <strong>of</strong> Total Disabl<strong>in</strong>g Cases, Ma<strong>in</strong>e, 1993-1999<br />
1993 1994 1995 1996 1997 1998 1999<br />
Year <strong>of</strong> Injury or Illness<br />
Other person<br />
21.4%<br />
Person<br />
<strong>in</strong>jured<br />
70.2%<br />
N=5,110<br />
Shown below <strong>in</strong> Figure 20 are the top five codes used for the source <strong>of</strong> disabl<strong>in</strong>g work-related <strong>in</strong>juries <strong>and</strong> illnesses.<br />
Bodily motion is coded for cases where the worker was <strong>in</strong>jured by free movement <strong>of</strong> the body or its<br />
parts with no impact <strong>and</strong> no overexertion is <strong>in</strong>volved. Cases <strong>in</strong> this category <strong>in</strong>clude repetitive motion, reach<strong>in</strong>g,<br />
turn<strong>in</strong>g, climb<strong>in</strong>g, <strong>and</strong> slips <strong>and</strong> trips where the worker did not fall.<br />
Figure 20.<br />
Bodily motion<br />
Ground<br />
Health care<br />
patient<br />
Floor <strong>of</strong><br />
build<strong>in</strong>g<br />
Boxes, crates,<br />
cartons<br />
_________________________________________________________________________________________<br />
Ma<strong>in</strong>e Department <strong>of</strong> Labor 26<br />
Bureau <strong>of</strong> Labor St<strong>and</strong>ards
<strong>Characteristics</strong> <strong>of</strong> <strong>Work</strong>-related <strong>Injuries</strong> <strong>and</strong> <strong>Illnesses</strong> <strong>in</strong> Ma<strong>in</strong>e 1999_________________<br />
Table 12. Disabl<strong>in</strong>g Cases by Source <strong>of</strong> Injury or Illness, Ma<strong>in</strong>e, 1997-1999<br />
Source <strong>of</strong> Injury or Illness<br />
Disabl<strong>in</strong>g Cases<br />
1997 1998 1999<br />
Number Percent Number Percent Number Percent<br />
Total 12,718 100.0 12,863 100.0 16,561 100.0<br />
*Persons, Plants, Animals, M<strong>in</strong>erals 3,852 30.3 3,916 30.4 5,110 30.9<br />
Person--<strong>in</strong>jured or ill worker 2,830 22.3 2,805 21.8 3,585 21.6<br />
Bodily motion/position <strong>of</strong> <strong>in</strong>j worker 2,422 19.0 2,361 18.4 3,086 18.6<br />
Bodily conditions <strong>of</strong> <strong>in</strong>jured, ill worker 408 3.2 444 3.5 498 3.0<br />
Person--Other than <strong>in</strong>jured/ill worker 694 5.5 753 5.9 1,096 6.6<br />
Health care patient/resdt hlth care fac 530 4.2 591 4.6 872 5.3<br />
Person--Other than <strong>in</strong>jured worker NEC 140 1.1 134 1.0 157 0.9<br />
Co-worker, former co-worker <strong>of</strong> <strong>in</strong>j wkr 20 0.2 27 0.2 59 0.4<br />
Plants, trees, vegetation--not processed 118 0.9 167 1.3 142 0.9<br />
Trees, logs 87 0.7 118 0.9 109 0.7<br />
Animals <strong>and</strong> animal products 65 0.5 54 0.4 93 0.6<br />
Mammals, except humans 31 0.2 29 0.2 42 0.3<br />
Dogs 13 0.1 19 0.1 24 0.1<br />
Cats 10 0.1 5 0.0 12 0.1<br />
Insects/arachnids-spider/tick/scorpion 9 0.1 12 0.1 25 0.2<br />
Animal products--nonfood 16 0.1 8 0.1 15 0.1<br />
Hides--leather 16 0.1 8 0.1 13 0.1<br />
Food products--fresh or processed 58 0.5 70 0.5 89 0.5<br />
Other food products--fresh/processed 31 0.2 57 0.4 58 0.4<br />
Fats, oils 15 0.1 29 0.2 28 0.2<br />
Nonmetallic m<strong>in</strong>erals, except fuel 53 0.4 36 0.3 60 0.4<br />
Rocks, crushed stone 50 0.4 33 0.3 45 0.3<br />
Infectious <strong>and</strong> parasitic agents 34 0.3 31 0.2 45 0.3<br />
*Structures <strong>and</strong> Surfaces 2,179 17.1 2,185 17.0 2,655 16.0<br />
Floors, walkways, ground surfaces 1,873 14.7 1,897 14.7 2,247 13.6<br />
Floors 683 5.4 659 5.1 843 5.1<br />
Floor <strong>of</strong> build<strong>in</strong>g 625 4.9 635 4.9 782 4.7<br />
Floor <strong>of</strong> vehicle 11 0.1 4 0.0 19 0.1<br />
Ground 577 4.5 658 5.1 751 4.5<br />
Sidewalks, paths, outdoor walkways 69 0.5 46 0.4 63 0.4<br />
Stairs, steps 171 1.3 175 1.4 219 1.3<br />
Stairs, steps--<strong>in</strong>doors 70 0.6 72 0.6 70 0.4<br />
Stairs, steps--outdoors 37 0.3 44 0.3 64 0.4<br />
Floors, walkways, ground surfaces UNS 138 1.1 136 1.1 144 0.9<br />
Park<strong>in</strong>g lots 154 1.2 129 1.0 119 0.7<br />
Other floors, walkways, ground surface 74 0.6 86 0.7 84 0.5<br />
Ramps, runways, load<strong>in</strong>g docks 66 0.5 80 0.6 75 0.5<br />
Other structural elements 249 2.0 248 1.9 332 2.0<br />
Doors 133 1.0 115 0.9 174 1.1<br />
Structural elements, NEC 47 0.4 54 0.4 52 0.3<br />
Walls 25 0.2 21 0.2 41 0.2<br />
W<strong>in</strong>dows 16 0.1 15 0.1 15 0.1<br />
Structures 56 0.4 36 0.3 71 0.4<br />
Scaffolds, stag<strong>in</strong>g 17 0.1 10 0.1 18 0.1<br />
Towers, poles<br />
Cont<strong>in</strong>ued on next page<br />
22 0.2 11 0.1 16 0.1<br />
_________________________________________________________________________________________<br />
Ma<strong>in</strong>e Department <strong>of</strong> Labor 27<br />
Bureau <strong>of</strong> Labor St<strong>and</strong>ards
<strong>Characteristics</strong> <strong>of</strong> <strong>Work</strong>-related <strong>Injuries</strong> <strong>and</strong> <strong>Illnesses</strong> <strong>in</strong> Ma<strong>in</strong>e 1999_________________<br />
Table 12. Disabl<strong>in</strong>g Cases by Source <strong>of</strong> Injury or Illness (cont.)<br />
Source <strong>of</strong> Injury or Illness<br />
Disabl<strong>in</strong>g Cases<br />
1997 1998 1999<br />
Number Percent Number Percent Number Percent<br />
*Other Sources <strong>and</strong> Nonclassifiable 1,802 14.2 1,653 12.9 2,164 13.1<br />
Nonclassifiable 1,131 8.9 997 7.8 1,329 8.0<br />
Other sources, NEC 341 2.7 255 2.0 308 1.9<br />
Scrap, waste, debris 165 1.3 206 1.6 260 1.6<br />
Chips, particles, spl<strong>in</strong>ters 147 1.2 178 1.4 234 1.4<br />
Chips, particles, spl<strong>in</strong>ters, UNS 72 0.6 62 0.5 85 0.5<br />
Metal chips, particles 35 0.3 51 0.4 69 0.4<br />
Chips, particles, spl<strong>in</strong>ters, NEC 16 0.1 44 0.3 42 0.3<br />
Wood chips, sawdust 8 0.1 7 0.1 19 0.1<br />
Glass chips or fibers 7 0.1 12 0.1 14 0.1<br />
Atmospheric & environmental conditions 46 0.4 58 0.5 83 0.5<br />
Fire, flame, smoke 21 0.2 30 0.2 37 0.2<br />
Temperature extremes--environmental 8 0.1 17 0.1 17 0.1<br />
Heat--environmental 7 0.1 10 0.1 12 0.1<br />
Steam, vapors, liquids, NEC 46 0.4 59 0.5 66 0.4<br />
Liquids 39 0.3 43 0.3 51 0.3<br />
Water 37 0.3 34 0.3 39 0.2<br />
Steam, vapors--nonchemical 7 0.1 16 0.1 15 0.1<br />
Apparel <strong>and</strong> textiles 39 0.3 41 0.3 64 0.4<br />
Cloth<strong>in</strong>g <strong>and</strong> shoes 27 0.2 27 0.2 35 0.2<br />
Belts, gloves, neckties, scarves 6 0.0 11 0.1 12 0.1<br />
Shoes, boots, slippers, s<strong>and</strong>als 7 0.1 6 0.0 12 0.1<br />
Paper, books, magaz<strong>in</strong>es 33 0.3 36 0.3 49 0.3<br />
*Conta<strong>in</strong>ers 1,417 11.1 1,486 11.6 1,810 10.9<br />
Conta<strong>in</strong>ers--nonpressurized 1,000 7.9 1,049 8.2 1,283 7.7<br />
Boxes, crates, cartons 545 4.3 580 4.5 645 3.9<br />
Bags, sacks, totes 122 1.0 126 1.0 199 1.2<br />
Pots, pans, trays 80 0.6 70 0.5 105 0.6<br />
Buckets, baskets, pails 75 0.6 89 0.7 102 0.6<br />
Conta<strong>in</strong>ers--nonpressurized, NEC 47 0.4 50 0.4 71 0.4<br />
Barrels, kegs, drums 56 0.4 50 0.4 48 0.3<br />
Tanks, b<strong>in</strong>s, vats 38 0.3 28 0.2 45 0.3<br />
Cans 17 0.1 30 0.2 37 0.2<br />
Bottles, jugs, flasks 16 0.1 22 0.2 21 0.1<br />
Conta<strong>in</strong>ers--variable restra<strong>in</strong>t 180 1.4 191 1.5 230 1.4<br />
Reels, rolls 89 0.7 91 0.7 94 0.6<br />
Packages, parcels 57 0.4 67 0.5 73 0.4<br />
Bundles, bales 32 0.3 32 0.2 62 0.4<br />
Conta<strong>in</strong>ers--pressurized 75 0.6 90 0.7 100 0.6<br />
Hoses 42 0.3 41 0.3 55 0.3<br />
Skids, pallets 92 0.7 90 0.7 97 0.6<br />
Conta<strong>in</strong>ers, UNS 39 0.3 49 0.4 51 0.3<br />
Dishes, dr<strong>in</strong>k<strong>in</strong>g cups, beverage glasses 27 0.2 12 0.1 36 0.2<br />
Cont<strong>in</strong>ued on next page<br />
_________________________________________________________________________________________<br />
Ma<strong>in</strong>e Department <strong>of</strong> Labor 28<br />
Bureau <strong>of</strong> Labor St<strong>and</strong>ards
<strong>Characteristics</strong> <strong>of</strong> <strong>Work</strong>-related <strong>Injuries</strong> <strong>and</strong> <strong>Illnesses</strong> <strong>in</strong> Ma<strong>in</strong>e 1999_________________<br />
Table 12. Disabl<strong>in</strong>g Cases by Source <strong>of</strong> Injury or Illness (cont.)<br />
Source <strong>of</strong> Injury or Illness<br />
1997<br />
Disabl<strong>in</strong>g Cases<br />
1998 1999<br />
Number Percent Number Percent Number Percent<br />
*Parts <strong>and</strong> Materials 942 7.4 983 7.6 1,304 7.9<br />
Build<strong>in</strong>g materials--solid elements 524 4.1 513 4.0 752 4.5<br />
Wood, lumber 185 1.5 197 1.5 267 1.6<br />
Dimensional lumber: 2x4 , 2x3 , etc. 85 0.7 105 0.8 191 1.2<br />
Plywood, wood panel-particle or chip 31 0.2 35 0.3 37 0.2<br />
Structural metal materials 186 1.5 153 1.2 235 1.4<br />
Structural metal materials, NEC 56 0.4 47 0.4 81 0.5<br />
Structural metal materials, UNS 49 0.4 49 0.4 58 0.4<br />
Bars, rods, re<strong>in</strong>forc<strong>in</strong>g bar (rebar) 30 0.2 24 0.2 30 0.2<br />
Beams 21 0.2 15 0.1 23 0.1<br />
Pipes, ducts, tub<strong>in</strong>g 89 0.7 78 0.6 113 0.7<br />
Metal pipe, tub<strong>in</strong>g 66 0.5 68 0.5 72 0.4<br />
Bricks, blocks, structural stone 29 0.2 35 0.3 72 0.4<br />
Other bldg materials-solid elements 27 0.2 38 0.3 54 0.3<br />
Wallboard, drywall 14 0.1 27 0.2 31 0.2<br />
Fasteners, connectors, ropes, ties 129 1.0 136 1.1 176 1.1<br />
Fasteners 70 0.6 81 0.6 107 0.6<br />
Nails, brads, tacks 51 0.4 56 0.4 81 0.5<br />
Ropes, ties 47 0.4 44 0.3 60 0.4<br />
Cha<strong>in</strong>s, NEC 11 0.1 16 0.1 11 0.1<br />
Wire--nonelectrical 9 0.1 13 0.1 11 0.1<br />
Vehicle <strong>and</strong> mobile equipment parts 108 0.8 119 0.9 147 0.9<br />
Tires, <strong>in</strong>ner tubes, wheels 52 0.4 63 0.5 77 0.5<br />
Eng<strong>in</strong>e parts <strong>and</strong> accessories 24 0.2 29 0.2 46 0.3<br />
Trailers 19 0.1 18 0.1 17 0.1<br />
Mach<strong>in</strong>e, tool, <strong>and</strong> electric parts 132 1.0 174 1.4 143 0.9<br />
Mach<strong>in</strong>e <strong>and</strong> appliance parts 64 0.5 123 1.0 66 0.4<br />
Dies, molds, patterns 11 0.1 16 0.1 13 0.1<br />
Electric parts & wir<strong>in</strong>g 40 0.3 38 0.3 46 0.3<br />
Tool parts, accessories 20 0.2 9 0.1 14 0.1<br />
*Vehicles 771 6.1 845 6.6 1,012 6.1<br />
Highway vehicle, motorized 491 3.9 510 4.0 634 3.8<br />
Truck 165 1.3 191 1.5 261 1.6<br />
Truck, NEC 42 0.3 85 0.7 107 0.6<br />
Truck, UNS 61 0.5 41 0.3 68 0.4<br />
Semi-trailer, tractor trailer truck 38 0.3 47 0.4 48 0.3<br />
Dump truck 10 0.1 10 0.1 18 0.1<br />
Automobile 167 1.3 172 1.3 178 1.1<br />
Highway vehicle, UNS 111 0.9 87 0.7 125 0.8<br />
Van--passenger or light delivery 10 0.1 33 0.3 32 0.2<br />
Bus 29 0.2 20 0.2 31 0.2<br />
Plant/<strong>in</strong>dustrial vehicle-nonpowered 179 1.4 219 1.7 246 1.5<br />
Cart, dolly, h<strong>and</strong>truck 100 0.8 129 1.0 163 1.0<br />
Plant/<strong>in</strong>dustrial powered vehicle, tractors 57 0.4 78 0.6 90 0.5<br />
Forklift 49 0.4 69 0.5 86 0.5<br />
Water vehicle 15 0.1 16 0.1 17 0.1<br />
Offroad vehicle, non<strong>in</strong>dustrial 21 0.2 12 0.1 11 0.1<br />
Cont<strong>in</strong>ued on next page<br />
_________________________________________________________________________________________<br />
Ma<strong>in</strong>e Department <strong>of</strong> Labor 29<br />
Bureau <strong>of</strong> Labor St<strong>and</strong>ards
<strong>Characteristics</strong> <strong>of</strong> <strong>Work</strong>-related <strong>Injuries</strong> <strong>and</strong> <strong>Illnesses</strong> <strong>in</strong> Ma<strong>in</strong>e 1999_________________<br />
Table 12. Disabl<strong>in</strong>g Cases by Source <strong>of</strong> Injury or Illness (cont.)<br />
Source <strong>of</strong> Injury or Illness<br />
Disabl<strong>in</strong>g Cases<br />
1997 1998 1999<br />
Number Percent Number Percent Number Percent<br />
*Tools, Instruments, <strong>and</strong> Equipment 673 5.3 700 5.4 985 5.9<br />
H<strong>and</strong>tools--nonpowered 374 2.9 338 2.6 479 2.9<br />
Cutt<strong>in</strong>g h<strong>and</strong>tools--nonpowered 148 1.2 146 1.1 185 1.1<br />
Knives 80 0.6 116 0.9 142 0.9<br />
Digg<strong>in</strong>g h<strong>and</strong>tools--nonpowered 66 0.5 63 0.5 88 0.5<br />
Shovels 59 0.5 57 0.4 75 0.5<br />
Other h<strong>and</strong>tools--nonpowered 82 0.6 74 0.6 83 0.5<br />
Brooms, mops & other clean<strong>in</strong>g tools 19 0.1 18 0.1 26 0.2<br />
Crowbars 11 0.1 12 0.1 13 0.1<br />
Rakes 13 0.1 10 0.1 11 0.1<br />
Strik<strong>in</strong>g/nail<strong>in</strong>g h<strong>and</strong>tools-nonpowered 34 0.3 31 0.2 54 0.3<br />
Hammers 25 0.2 25 0.2 33 0.2<br />
Turn<strong>in</strong>g h<strong>and</strong>tools--nonpowered 26 0.2 10 0.1 45 0.3<br />
Wrenches 19 0.1 8 0.1 40 0.2<br />
H<strong>and</strong>tools--powered 126 1.0 165 1.3 262 1.6<br />
Cutt<strong>in</strong>g h<strong>and</strong>tools--powered 29 0.2 45 0.3 59 0.4<br />
Cha<strong>in</strong>saws--powered 15 0.1 24 0.2 35 0.2<br />
Saws--powered, except cha<strong>in</strong>saws 9 0.1 16 0.1 18 0.1<br />
Weld<strong>in</strong>g & heat<strong>in</strong>g h<strong>and</strong>tools--powered 25 0.2 34 0.3 53 0.3<br />
Weld<strong>in</strong>g torches--powered 24 0.2 31 0.2 47 0.3<br />
Surfac<strong>in</strong>g h<strong>and</strong>tools--powered 26 0.2 37 0.3 49 0.3<br />
Buffers, polishers, waxers--powered 10 0.1 9 0.1 17 0.1<br />
H<strong>and</strong> gr<strong>in</strong>ders--powered 8 0.1 17 0.1 15 0.1<br />
Bor<strong>in</strong>g h<strong>and</strong>tools--powered 21 0.2 23 0.2 38 0.2<br />
Drills--powered 13 0.1 19 0.1 32 0.2<br />
Other h<strong>and</strong>tools--powered 7 0.1 9 0.1 29 0.2<br />
Strik<strong>in</strong>g & nail<strong>in</strong>g h<strong>and</strong>tools--powered 14 0.1 13 0.1 24 0.1<br />
Jackhammers--powered 12 0.1 11 0.1 20 0.1<br />
H<strong>and</strong>tools--power not determ<strong>in</strong>ed 27 0.2 25 0.2 38 0.2<br />
Turn<strong>in</strong>g h<strong>and</strong>tools--power not determ<strong>in</strong>ed 12 0.1 12 0.1 18 0.1<br />
Wrenches--power not determ<strong>in</strong>ed 11 0.1 11 0.1 16 0.1<br />
Other tools, <strong>in</strong>struments, <strong>and</strong> equipment 58 0.5 62 0.5 69 0.4<br />
Health care & orthopedic equip, NEC 34 0.3 30 0.2 34 0.2<br />
Wheelchairs 12 0.1 19 0.1 22 0.1<br />
Tools, <strong>in</strong>struments, & equipment, UNS 27 0.2 26 0.2 55 0.3<br />
Ladders 34 0.3 48 0.4 42 0.3<br />
Recreation <strong>and</strong> athletic equipment 16 0.1 17 0.1 19 0.1<br />
Cont<strong>in</strong>ued on next page<br />
_________________________________________________________________________________________<br />
Ma<strong>in</strong>e Department <strong>of</strong> Labor 30<br />
Bureau <strong>of</strong> Labor St<strong>and</strong>ards
<strong>Characteristics</strong> <strong>of</strong> <strong>Work</strong>-related <strong>Injuries</strong> <strong>and</strong> <strong>Illnesses</strong> <strong>in</strong> Ma<strong>in</strong>e 1999_________________<br />
Table 12. Disabl<strong>in</strong>g Cases by Source <strong>of</strong> Injury or Illness (cont.)<br />
Source <strong>of</strong> Injury or Illness<br />
Disabl<strong>in</strong>g Cases<br />
1997 1998 1999<br />
Number Percent Number Percent Number Percent<br />
*Mach<strong>in</strong>ery 569 4.5 571 4.4 794 4.8<br />
Special process mach<strong>in</strong>ery 117 0.9 96 0.7 156 0.9<br />
Food/bev. process mach-specialized 65 0.5 55 0.4 81 0.5<br />
Food slicers 41 0.3 40 0.3 44 0.3<br />
Mixer, blender, whipper-food/beverage 8 0.1 4 0.0 13 0.1<br />
Textile, apparel, leather prodn mach 14 0.1 16 0.1 26 0.2<br />
Other special process mach<strong>in</strong>ery 10 0.1 9 0.1 15 0.1<br />
Pumps 10 0.1 8 0.1 13 0.1<br />
Heat<strong>in</strong>g, cool<strong>in</strong>g, clean<strong>in</strong>g mach/applnc 95 0.7 101 0.8 147 0.9<br />
Cool<strong>in</strong>g & humidify<strong>in</strong>g mach/appliance 27 0.2 32 0.2 40 0.2<br />
Heat<strong>in</strong>g <strong>and</strong> cook<strong>in</strong>g mach/appliances 34 0.3 31 0.2 56 0.3<br />
Washers, dryers, clean mach/appliance 33 0.3 35 0.3 50 0.3<br />
Metal, woodwork<strong>in</strong>g, special matíl mach 72 0.6 69 0.5 112 0.7<br />
Presses, except pr<strong>in</strong>t<strong>in</strong>g 7 0.1 10 0.1 19 0.1<br />
Saw<strong>in</strong>g mach<strong>in</strong>ery--stationary 37 0.3 35 0.3 53 0.3<br />
Saw<strong>in</strong>g mach<strong>in</strong>ery--stationary, UNS 9 0.1 11 0.1 19 0.1<br />
Table saws 19 0.1 16 0.1 20 0.1<br />
Material h<strong>and</strong>l<strong>in</strong>g mach<strong>in</strong>ery 72 0.6 85 0.7 90 0.5<br />
Overhead hoists 10 0.1 23 0.2 23 0.1<br />
Jacks 18 0.1 17 0.1 21 0.1<br />
Conveyors--powered 22 0.2 22 0.2 19 0.1<br />
Construction, logg<strong>in</strong>g, <strong>and</strong> m<strong>in</strong><strong>in</strong>g mach 50 0.4 56 0.4 83 0.5<br />
Excavat<strong>in</strong>g mach<strong>in</strong>ery 10 0.1 12 0.1 17 0.1<br />
Logg<strong>in</strong>g/wood process<strong>in</strong>g mach-spclzd 24 0.2 25 0.2 29 0.2<br />
Miscellaneous mach<strong>in</strong>ery 57 0.4 68 0.5 78 0.5<br />
Other mach<strong>in</strong>ery 45 0.4 60 0.5 70 0.4<br />
Snow plows 7 0.1 9 0.1 9 0.1<br />
Office <strong>and</strong> bus<strong>in</strong>ess mach<strong>in</strong>ery 21 0.2 11 0.1 27 0.2<br />
Electronic computers/peripheral equip 16 0.1 6 0.0 20 0.1<br />
Computers--electronic 9 0.1 5 0.0 13 0.1<br />
Agricultural <strong>and</strong> garden mach<strong>in</strong>ery 22 0.2 25 0.2 25 0.2<br />
Mow<strong>in</strong>g mach<strong>in</strong>ery 13 0.1 23 0.2 17 0.1<br />
*Furniture <strong>and</strong> Fixtures 374 2.9 367 2.9 479 2.9<br />
Furniture 213 1.7 239 1.9 285 1.7<br />
Tables, worktables 56 0.4 68 0.5 74 0.4<br />
Beds, bedd<strong>in</strong>g, mattresses 32 0.3 38 0.3 49 0.3<br />
Chairs 32 0.3 23 0.2 44 0.3<br />
Cases, cab<strong>in</strong>ets, racks, shelves 110 0.9 90 0.7 127 0.8<br />
Other fixtures 25 0.2 19 0.1 39 0.2<br />
Light<strong>in</strong>g equipment 10 0.1 10 0.1 18 0.1<br />
Plumb<strong>in</strong>g fixtures 8 0.1 8 0.1 18 0.1<br />
Floor, wall, w<strong>in</strong>dow cover<strong>in</strong>gs 19 0.1 15 0.1 20 0.1<br />
*Chemicals <strong>and</strong> Chemical Products 139 1.1 157 1.2 248 1.5<br />
*L<strong>in</strong>es add up to total. Subgroups listed are those with highest lost-time <strong>in</strong>juries; they are not all-<strong>in</strong>clusive<br />
<strong>and</strong> do not add up to the group total.<br />
UNS - Unspecified source <strong>of</strong> <strong>in</strong>jury<br />
NEC - Not Elsewhere Classified-no specific code available for source <strong>of</strong> <strong>in</strong>jury described<br />
_________________________________________________________________________________________<br />
Ma<strong>in</strong>e Department <strong>of</strong> Labor 31<br />
Bureau <strong>of</strong> Labor St<strong>and</strong>ards
Event or Exposure<br />
<strong>Characteristics</strong> <strong>of</strong> <strong>Work</strong>-related <strong>Injuries</strong> <strong>and</strong> <strong>Illnesses</strong> <strong>in</strong> Ma<strong>in</strong>e 1999_________________<br />
The event or exposure describes how the source<br />
caused the <strong>in</strong>jury or illness. Bodily reaction <strong>and</strong> exertion<br />
were coded as the event <strong>in</strong> 8,955 <strong>of</strong> all disabl<strong>in</strong>g<br />
work-related <strong>in</strong>juries <strong>and</strong> illnesses (54.1%) <strong>in</strong> 1999;<br />
5,199 (31.4%) <strong>of</strong> these were due to overexertion.<br />
Bodily reaction is used as the event for bend<strong>in</strong>g,<br />
climb<strong>in</strong>g, crawl<strong>in</strong>g, reach<strong>in</strong>g, runn<strong>in</strong>g, sitt<strong>in</strong>g, st<strong>and</strong><strong>in</strong>g,<br />
walk<strong>in</strong>g, <strong>and</strong> slipp<strong>in</strong>g without fall<strong>in</strong>g where<br />
Figure 21. Event or Exposure<br />
Percent <strong>of</strong> Disabl<strong>in</strong>g Cases, Ma<strong>in</strong>e, 1999<br />
Assaults &<br />
Violent Acts<br />
1.3%<br />
Transp acc.<br />
3.1%<br />
Unknown<br />
4.3%<br />
there is no overexertion <strong>in</strong>volved. Overexertion is<br />
used as the event when an excessive physical effort<br />
is placed upon the body due to an outside source<br />
such as lift<strong>in</strong>g, push<strong>in</strong>g, pull<strong>in</strong>g, hold<strong>in</strong>g, carry<strong>in</strong>g,<br />
throw<strong>in</strong>g objects. Figure 21 shows the major categories<br />
<strong>of</strong> the events lead<strong>in</strong>g up to the <strong>in</strong>jury. Figure 22<br />
shows the breakout <strong>of</strong> bodily reaction <strong>and</strong> exertion.<br />
See Table 13 on page 33 for details.<br />
Figure 23 shown below shows the top five event codes used to code disabl<strong>in</strong>g work-related <strong>in</strong>juries <strong>and</strong> illnesses.<br />
These five codes account for over 36% <strong>of</strong> all disabl<strong>in</strong>g cases submitted <strong>in</strong> 1999.<br />
Figure 23.<br />
Percent <strong>of</strong> Disabl<strong>in</strong>g Cases<br />
18<br />
16<br />
14<br />
12<br />
10<br />
8<br />
6<br />
4<br />
2<br />
0<br />
Exposure to<br />
harmful<br />
subst<br />
4.6%<br />
Fires &<br />
Explosions<br />
0.2%<br />
Falls<br />
13.7%<br />
Contact with<br />
obj., eq<br />
16.1%<br />
Bodily Bodily reaction<br />
reaction<br />
& exertion<br />
&<br />
54.1%<br />
exertion<br />
54.1%<br />
N=16,561<br />
Figure 22. Bodily Reaction & Exertion<br />
Percent <strong>of</strong> Disabl<strong>in</strong>g Cases, Ma<strong>in</strong>e, 1999<br />
Bodily Bodily reaction<br />
& exertion reaction UNS &<br />
exertion 2.1% UNS<br />
2.1%<br />
Bodily<br />
conditions<br />
NEC<br />
5.4%<br />
Repetitive<br />
motion<br />
13.4%<br />
Top Five Events<br />
Percent <strong>of</strong> Total Disabl<strong>in</strong>g Cases, Ma<strong>in</strong>e, 1993-1999<br />
1993 1994 1995 1996 1997 1998 1999<br />
Year <strong>of</strong> Injury or Illness<br />
Overexertion<br />
Overexertion<br />
58.1%<br />
Bodily<br />
reaction<br />
21.0%<br />
N=8,955<br />
Overexertion<br />
lift<strong>in</strong>g<br />
Fall to<br />
work<strong>in</strong>g<br />
surface<br />
Overexertion<br />
push/pull<br />
Overexertion<br />
NEC<br />
Slip, trip w/o<br />
fall<strong>in</strong>g<br />
_________________________________________________________________________________________<br />
Ma<strong>in</strong>e Department <strong>of</strong> Labor 32<br />
Bureau <strong>of</strong> Labor St<strong>and</strong>ards
<strong>Characteristics</strong> <strong>of</strong> <strong>Work</strong>-related <strong>Injuries</strong> <strong>and</strong> <strong>Illnesses</strong> <strong>in</strong> Ma<strong>in</strong>e 1999_________________<br />
Table 13. Disabl<strong>in</strong>g Cases by Event or Exposure, Ma<strong>in</strong>e, 1997-1999<br />
Event or Exposure<br />
Disabl<strong>in</strong>g Cases<br />
1997 1998 1999<br />
Number Percent Number Percent Number Percent<br />
Total 12,718 100.0 12,863 100.0 16,561 100.0<br />
*Bodily reaction <strong>and</strong> exertion 6,716 52.8 6,730 52.3 8,955 54.1<br />
Overexertion 3,785 29.8 3,837 29.8 5,199 31.4<br />
Overexertion <strong>in</strong> lift<strong>in</strong>g 1,748 13.7 1,842 14.3 2,661 16.1<br />
Overexertion <strong>in</strong> pull<strong>in</strong>g/push<strong>in</strong>g objects 487 3.8 547 4.3 780 4.7<br />
Overexertion, NEC 616 4.8 698 5.4 677 4.1<br />
Overexertion hold<strong>in</strong>g/carry<strong>in</strong>g objects 312 2.5 352 2.7 563 3.4<br />
Overexertion, UNS 577 4.5 365 2.8 480 2.9<br />
Overexertion <strong>in</strong> throw<strong>in</strong>g objects 45 0.4 33 0.3 38 0.2<br />
Bodily reaction 1,618 12.7 1,560 12.1 1,882 11.4<br />
Slip, trip, loss <strong>of</strong> balance-without fall 545 4.3 533 4.1 606 3.7<br />
Bend<strong>in</strong>g/climb<strong>in</strong>g/crawl<strong>in</strong>g/twist<strong>in</strong>g 514 4.0 483 3.8 598 3.6<br />
Bodily reaction, NEC 313 2.5 322 2.5 356 2.1<br />
Walk<strong>in</strong>g--without other <strong>in</strong>cident 106 0.8 108 0.8 159 1.0<br />
St<strong>and</strong><strong>in</strong>g 33 0.3 30 0.2 58 0.4<br />
Sitt<strong>in</strong>g 22 0.2 18 0.1 36 0.2<br />
Repetitive motion 813 6.4 805 6.3 1,198 7.2<br />
Repetitive motion, UNS 439 3.5 378 2.9 416 2.5<br />
Repetitive placg/graspg/movg ob ex tool 132 1.0 143 1.1 236 1.4<br />
Typ<strong>in</strong>g or keyentry 99 0.8 148 1.2 230 1.4<br />
Repetitive use <strong>of</strong> tools 84 0.7 80 0.6 202 1.2<br />
Bodily conditions, NEC 400 3.1 432 3.4 485 2.9<br />
Bodily reaction <strong>and</strong> exertion, UNS 99 0.8 96 0.7 191 1.2<br />
*Contact with objects <strong>and</strong> equipment 2,376 18.7 2,421 18.8 3,100 18.7<br />
Struck by object 1,144 9.0 1,168 9.1 1,422 8.6<br />
Struck by sw<strong>in</strong>g<strong>in</strong>g or slipp<strong>in</strong>g object 360 2.8 411 3.2 525 3.2<br />
Struck by slipp<strong>in</strong>g h<strong>and</strong>held object 261 2.1 300 2.3 362 2.2<br />
Struck by/slammed <strong>in</strong> sw<strong>in</strong>g door/gate 50 0.4 52 0.4 89 0.5<br />
Struck by fall<strong>in</strong>g object 340 2.7 346 2.7 452 2.7<br />
Struck by object, NEC 275 2.2 231 1.8 248 1.5<br />
Struck by fly<strong>in</strong>g object 87 0.7 93 0.7 133 0.8<br />
Struck aga<strong>in</strong>st object 743 5.8 766 6.0 967 5.8<br />
Struck aga<strong>in</strong>st stationary object 221 1.7 250 1.9 403 2.4<br />
Stepped on object 80 0.6 79 0.6 102 0.6<br />
Struck aga<strong>in</strong>st mov<strong>in</strong>g object 68 0.5 46 0.4 68 0.4<br />
Caught <strong>in</strong>/compressed by equip/object 206 1.6 201 1.6 305 1.8<br />
Caught <strong>in</strong> runn<strong>in</strong>g equipment or mach 120 0.9 94 0.7 139 0.8<br />
Rubbed/abraded by friction/pressure 198 1.6 203 1.6 283 1.7<br />
Rubbed/abraded-foreign matter <strong>in</strong> eye 126 1.0 142 1.1 200 1.2<br />
Rubbed/abraded-kneel<strong>in</strong>g on surface 60 0.5 54 0.4 70 0.4<br />
Rubbed/abraded/jarred by vibration<br />
Cont<strong>in</strong>ued on next page<br />
20 0.2 22 0.2 38 0.2<br />
_________________________________________________________________________________________<br />
Ma<strong>in</strong>e Department <strong>of</strong> Labor 33<br />
Bureau <strong>of</strong> Labor St<strong>and</strong>ards
<strong>Characteristics</strong> <strong>of</strong> <strong>Work</strong>-related <strong>Injuries</strong> <strong>and</strong> <strong>Illnesses</strong> <strong>in</strong> Ma<strong>in</strong>e 1999_________________<br />
Table 13. Disabl<strong>in</strong>g Cases by Event or Exposure (cont.)<br />
Event or Exposure<br />
Disabl<strong>in</strong>g Cases<br />
1997 1998 1999<br />
Number Percent Number Percent Number Percent<br />
*Falls 1,869 14.7 1,946 15.1 2,275 13.7<br />
Fall on same level 1,200 9.4 1,273 9.9 1,460 8.8<br />
Fall to floor, walkway, other surface 1,097 8.6 1,126 8.8 1,292 7.8<br />
Fall onto or aga<strong>in</strong>st objects 103 0.8 146 1.1 166 1.0<br />
Fall to lower level 577 4.5 586 4.6 716 4.3<br />
Fall down stairs or steps 156 1.2 153 1.2 201 1.2<br />
Fall from ladder 136 1.1 132 1.0 156 0.9<br />
Fall to lower level, NEC 141 1.1 151 1.2 149 0.9<br />
Fall from nonmov<strong>in</strong>g vehicle 71 0.6 81 0.6 109 0.7<br />
Fall from floor, dock, or ground level 31 0.2 18 0.1 39 0.2<br />
Fall from scaffold, stag<strong>in</strong>g 17 0.1 22 0.2 22 0.1<br />
Fall from ro<strong>of</strong> 14 0.1 20 0.2 19 0.1<br />
Jump to lower level 40 0.3 49 0.4 52 0.3<br />
*Exposure to harmful substance/environ 432 3.4 529 4.1 756 4.6<br />
Exposure to caustic/noxious/allerg subs 281 2.2 300 2.3 441 2.7<br />
Inhalation <strong>of</strong> substance 103 0.8 109 0.8 187 1.1<br />
Inhalation <strong>in</strong> open/nonconf<strong>in</strong>ed space 3 0.0 6 0.0 33 0.2<br />
Inhalation <strong>in</strong> encl/restrict/confn space 58 0.5 25 0.2 19 0.1<br />
Contact with sk<strong>in</strong> other exposed tissue 122 1.0 134 1.0 160 1.0<br />
Injections, st<strong>in</strong>gs, venomous bites 11 0.1 15 0.1 25 0.2<br />
Exposure to caustic/nox/allerg sub NEC 24 0.2 26 0.2 36 0.2<br />
Contact with temperature extremes 103 0.8 173 1.3 222 1.3<br />
Contact with hot objects or substance 98 0.8 157 1.2 201 1.2<br />
Exposure to environmental heat 4 0.0 8 0.1 12 0.1<br />
Exposure to radiation 18 0.1 23 0.2 49 0.3<br />
Exposure to weld<strong>in</strong>g light 16 0.1 22 0.2 41 0.2<br />
Contact w/electric current 20 0.2 17 0.1 25 0.2<br />
*Nonclassifiable 754 5.9 651 5.1 719 4.3<br />
*Transportation accidents 408 3.2 406 3.2 506 3.1<br />
Highway accident 241 1.9 227 1.8 289 1.7<br />
Collision between veh, mobile equip 193 1.5 166 1.3 197 1.2<br />
Collision-movg-st<strong>and</strong>g vehicle- roadway 55 0.4 71 0.6 66 0.4<br />
Collision-mov<strong>in</strong>g opp dir-oncom<strong>in</strong>g 17 0.1 10 0.1 22 0.1<br />
Veh struck stationary object side road 17 0.1 24 0.2 25 0.2<br />
Noncollision accident 23 0.2 28 0.2 44 0.3<br />
Jack-knifed/overturned--no collision 0 0.0 7 0.1 20 0.1<br />
Ran <strong>of</strong>f highway--no collision 15 0.1 12 0.1 14 0.1<br />
Nonhighway accident, ex rail, air, water 66 0.5 82 0.6 94 0.6<br />
Noncollision accident 62 0.5 72 0.6 81 0.5<br />
Overturned 31 0.2 46 0.4 33 0.2<br />
Pedestrian struck by vehicle 52 0.4 58 0.5 77 0.5<br />
Pedestrian struck by vehicle <strong>in</strong> road 19 0.1 10 0.1 23 0.1<br />
Pedestrian struck by vehicle <strong>in</strong> pkg lot<br />
Cont<strong>in</strong>ued on next page<br />
24 0.2 29 0.2 42 0.3<br />
_________________________________________________________________________________________<br />
Ma<strong>in</strong>e Department <strong>of</strong> Labor 34<br />
Bureau <strong>of</strong> Labor St<strong>and</strong>ards
<strong>Characteristics</strong> <strong>of</strong> <strong>Work</strong>-related <strong>Injuries</strong> <strong>and</strong> <strong>Illnesses</strong> <strong>in</strong> Ma<strong>in</strong>e 1999_________________<br />
Table 13. Disabl<strong>in</strong>g Cases by Event or Exposure (cont.)<br />
Event or Exposure<br />
Disabl<strong>in</strong>g Cases<br />
1997 1998 1999<br />
Number Percent Number Percent Number Percent<br />
*Assaults <strong>and</strong> violent acts 144 1.1 164 1.3 218 1.3<br />
Assaults <strong>and</strong> violent acts by person 117 0.9 140 1.1 177 1.1<br />
Hitt<strong>in</strong>g, kick<strong>in</strong>g, beat<strong>in</strong>g 43 0.3 56 0.4 69 0.4<br />
Assaults/violent acts by person NEC 43 0.3 53 0.4 53 0.3<br />
Assaults/violent acts by person UNS 21 0.2 15 0.1 20 0.1<br />
Threats or verbal assaults 8 0.1 13 0.1 15 0.1<br />
Assaults by animals 26 0.2 24 0.2 39 0.2<br />
Nonvenomous bites 23 0.2 21 0.2 36 0.2<br />
Self-<strong>in</strong>flicted <strong>in</strong>jury 1 0.0 0 0.0 1 0.0<br />
*Fires <strong>and</strong> explosions 19 0.1 16 0.1 32 0.2<br />
Fire--un<strong>in</strong>tended or uncontrolled 9 0.1 6 0.0 18 0.1<br />
Explosion 10 0.1 9 0.1 13 0.1<br />
Fire or explosion UNS 0 0.0 1 0.0 1 0.0<br />
*L<strong>in</strong>es add up to total. Subgroups listed are those with highest lost-time <strong>in</strong>juries; they are not all-<strong>in</strong>clusive <strong>and</strong> do<br />
not add up to the group total.<br />
UNS - Unspecified event or exposure<br />
_________________________________________________________________________________________<br />
Ma<strong>in</strong>e Department <strong>of</strong> Labor 35<br />
Bureau <strong>of</strong> Labor St<strong>and</strong>ards
<strong>Characteristics</strong> <strong>of</strong> <strong>Work</strong>-related <strong>Injuries</strong> <strong>and</strong> <strong>Illnesses</strong> <strong>in</strong> Ma<strong>in</strong>e 1999_________________<br />
Occupation <strong>of</strong> Injured or Ill <strong>Work</strong>er<br />
Figure 24 shows the top four occupations <strong>of</strong> the employees<br />
who lost time due to work-related <strong>in</strong>juries <strong>and</strong><br />
illnesses from 1993-1999.<br />
Truck driver is currently the most hazardous occupation<br />
<strong>in</strong> Ma<strong>in</strong>e. In 1993, 976 cases <strong>in</strong>volv<strong>in</strong>g truck drivers<br />
were filed due to work-related <strong>in</strong>juries (6.2% <strong>of</strong> all<br />
disabl<strong>in</strong>g cases for that year) as compared to 1,042<br />
(6.3%) <strong>in</strong> 1999.<br />
Laborers, except construction laborers, ranked as the<br />
number one occupation for lost time due to work-related<br />
<strong>in</strong>juries <strong>and</strong> illnesses, except <strong>in</strong> 1999. Disabl<strong>in</strong>g cases<br />
Figure 24.<br />
Percent <strong>of</strong> Cases<br />
8<br />
7<br />
6<br />
5<br />
4<br />
3<br />
2<br />
1<br />
0<br />
Top Four Occupations<br />
Percent <strong>of</strong> Total Disabl<strong>in</strong>g Cases, Ma<strong>in</strong>e, 1993-1999<br />
among laborers have decreased from 1,090 (6.9%) <strong>of</strong> all<br />
disabl<strong>in</strong>g cases <strong>in</strong> 1993 to 1,038 (6.3%) <strong>in</strong> 1999.<br />
Nurs<strong>in</strong>g aides ranked the number three occupation <strong>in</strong><br />
1999 with 1,020 (6.2%) disabl<strong>in</strong>g work-related <strong>in</strong>juries<br />
<strong>and</strong> illnesses.<br />
Janitors <strong>and</strong> cleaners ranked as the number four occupation<br />
with, 555 (3.4%) disabl<strong>in</strong>g work-related <strong>in</strong>juries<br />
<strong>and</strong> illnesses <strong>in</strong> 1999.<br />
These four occupational groups accounted for 22.1%<br />
<strong>of</strong> all lost-time <strong>in</strong>juries <strong>and</strong> illnesses <strong>in</strong> Ma<strong>in</strong>e <strong>in</strong><br />
1999. See Table 14 on page 37 for details.<br />
1993 1994 1995 1996 1997 1998 1999<br />
Year <strong>of</strong> Injury or Illness<br />
Laborers ex.<br />
const<br />
Truck drivers<br />
Nurs<strong>in</strong>g<br />
aides<br />
Janitors &<br />
cleaners<br />
_________________________________________________________________________________________<br />
Ma<strong>in</strong>e Department <strong>of</strong> Labor 36<br />
Bureau <strong>of</strong> Labor St<strong>and</strong>ards
<strong>Characteristics</strong> <strong>of</strong> <strong>Work</strong>-related <strong>Injuries</strong> <strong>and</strong> <strong>Illnesses</strong> <strong>in</strong> Ma<strong>in</strong>e 1999_________________<br />
Table 14. Disabl<strong>in</strong>g Cases by Occupation <strong>of</strong> Injured <strong>Work</strong>er, Ma<strong>in</strong>e, 1997-1999<br />
Occupation <strong>of</strong> Injured <strong>Work</strong>er<br />
Disabl<strong>in</strong>g Cases<br />
1997 1998 1999<br />
Number Percent Number Percent Number Percent<br />
Total 12,718 100.0 12,863 100.0 16,561 100.0<br />
*Service <strong>Work</strong>er 2,200 17.3 2,350 18.3 3,099 18.7<br />
Nurs<strong>in</strong>g aides, orderlies, & attendants 684 5.4 714 5.6 1,020 6.2<br />
Janitors <strong>and</strong> cleaners 431 3.4 467 3.6 555 3.4<br />
Kitchen workers, food preparation 220 1.7 200 1.6 263 1.6<br />
Cooks 218 1.7 226 1.8 260 1.6<br />
Miscellaneous food preparation occup 115 0.9 166 1.3 218 1.3<br />
Maids <strong>and</strong> housemen 170 1.3 164 1.3 198 1.2<br />
Health aides, exc. nurs<strong>in</strong>g 46 0.4 121 0.9 190 1.1<br />
Waiters <strong>and</strong> waitresses 89 0.7 64 0.5 101 0.6<br />
Supervisors-food prep/service occup 24 0.2 26 0.2 44 0.3<br />
Child care workers, NEC 40 0.3 43 0.3 43 0.3<br />
Waiters/waitresses assistants 35 0.3 30 0.2 41 0.2<br />
Supervisors-clean<strong>in</strong>g/bldg service wrkr 23 0.2 36 0.3 33 0.2<br />
Attendants/amusement/rec facilities 36 0.3 38 0.3 30 0.2<br />
*Precision Production, Craft or Repair 2,210 17.4 2,331 18.1 2,965 17.9<br />
Carpenters 327 2.6 338 2.6 425 2.6<br />
Automobile mechanics 121 1.0 162 1.3 189 1.1<br />
Plumber, pipefitter, <strong>and</strong> steamfitter 153 1.2 120 0.9 164 1.0<br />
Construction trades, NEC 69 0.5 65 0.5 158 1.0<br />
Electricians 130 1.0 114 0.9 150 0.9<br />
Structural metal workers 91 0.7 77 0.6 129 0.8<br />
Miscellaneous precision metal workers 72 0.6 76 0.6 118 0.7<br />
Heat<strong>in</strong>g/air condition/refrigeration mech 63 0.5 93 0.7 115 0.7<br />
Not specified mechanics <strong>and</strong> repairers 1 0.0 117 0.9 105 0.6<br />
Mach<strong>in</strong>ists 71 0.6 84 0.7 101 0.6<br />
Sheet metal workers 57 0.4 71 0.6 100 0.6<br />
Specified mechanics & repairers, NEC 197 1.5 93 0.7 88 0.5<br />
Supervisors, production occupations 52 0.4 64 0.5 86 0.5<br />
Supervisor-NEC 43 0.3 67 0.5 77 0.5<br />
Bus/truck/stationary eng<strong>in</strong>e mechanics 48 0.4 43 0.3 63 0.4<br />
Insulation workers 33 0.3 54 0.4 57 0.3<br />
Pa<strong>in</strong>ters, construction & ma<strong>in</strong>tenance 44 0.3 49 0.4 55 0.3<br />
Electrical/electronic equip assemblers 38 0.3 44 0.3 55 0.3<br />
Industrial mach<strong>in</strong>ery repairers 78 0.6 54 0.4 50 0.3<br />
Electronic repairer communic/<strong>in</strong>dstl eq 14 0.1 28 0.2 41 0.2<br />
Drywall <strong>in</strong>stallers 23 0.2 16 0.1 40 0.2<br />
Brickmasons <strong>and</strong> stonemasons 16 0.1 35 0.3 38 0.2<br />
Ro<strong>of</strong>ers 13 0.1 23 0.2 38 0.2<br />
Automobile body <strong>and</strong> related repairers 14 0.1 44 0.3 34 0.2<br />
Butchers <strong>and</strong> meat cutters 28 0.2 20 0.2 34 0.2<br />
Millwrights<br />
Bakers Cont<strong>in</strong>ued on next page<br />
Cont<strong>in</strong>ued on next page<br />
29<br />
15<br />
0.2<br />
0.1<br />
27<br />
20<br />
0.2<br />
0.2<br />
31<br />
31<br />
0.2<br />
0.2<br />
_________________________________________________________________________________________<br />
Ma<strong>in</strong>e Department <strong>of</strong> Labor 37<br />
Bureau <strong>of</strong> Labor St<strong>and</strong>ards
Cont<strong>in</strong>ued on next page<br />
<strong>Characteristics</strong> <strong>of</strong> <strong>Work</strong>-related <strong>Injuries</strong> <strong>and</strong> <strong>Illnesses</strong> <strong>in</strong> Ma<strong>in</strong>e 1999_________________<br />
Table 14. Disabl<strong>in</strong>g Cases by Occupation <strong>of</strong> Injured <strong>Work</strong>er (cont.)<br />
Occupation <strong>of</strong> Injured <strong>Work</strong>er<br />
Disabl<strong>in</strong>g Cases<br />
1997 1998 1999<br />
Number Percent Number Percent Number Percent<br />
*H<strong>and</strong>ler, Equipment Cleaner or Laborer 2,075 16.3 2,132 16.6 2,745 16.6<br />
Laborers-except construction 969 7.6 935 7.3 1,038 6.3<br />
Construction laborers 313 2.5 337 2.6 518 3.1<br />
Freight/stock/material h<strong>and</strong>lers, NEC 230 1.8 266 2.1 443 2.7<br />
Stock h<strong>and</strong>lers <strong>and</strong> baggers 220 1.7 290 2.3 206 1.2<br />
H<strong>and</strong> packers <strong>and</strong> packagers 111 0.9 92 0.7 157 0.9<br />
Garage/service station related occup 74 0.6 55 0.4 86 0.5<br />
Mach<strong>in</strong>e feeders <strong>and</strong> <strong>of</strong>fbearers 36 0.3 37 0.3 76 0.5<br />
Vehicle washers & equipment cleaners 28 0.2 26 0.2 76 0.5<br />
Helpers-construction trades 43 0.3 42 0.3 59 0.4<br />
Garbage collectors 23 0.2 26 0.2 42 0.3<br />
Supervisor-h<strong>and</strong>ler/eq clean/laborer NEC 20 0.2 21 0.2 24 0.1<br />
*Mach<strong>in</strong>e Operator, Assembler or Inspector 1,294 10.2 1,250 9.7 1,689 10.2<br />
Mach<strong>in</strong>e operators, not specified 237 1.9 231 1.8 309 1.9<br />
Miscellaneous mach<strong>in</strong>e operators NEC 196 1.5 196 1.5 233 1.4<br />
Welders <strong>and</strong> cutters 113 0.9 108 0.8 196 1.2<br />
Shoe mach<strong>in</strong>e operators 123 1.0 121 0.9 156 0.9<br />
Assemblers 67 0.5 75 0.6 121 0.7<br />
Miscellaneous woodwork<strong>in</strong>g mach op 51 0.4 61 0.5 68 0.4<br />
Textile sew<strong>in</strong>g mach<strong>in</strong>e operators 28 0.2 51 0.4 66 0.4<br />
Saw<strong>in</strong>g mach<strong>in</strong>e operators 32 0.3 30 0.2 62 0.4<br />
Launder<strong>in</strong>g/dry clean<strong>in</strong>g mach<strong>in</strong>e oper 57 0.4 44 0.3 50 0.3<br />
Production <strong>in</strong>spector/checker/exam<strong>in</strong>er 51 0.4 37 0.3 49 0.3<br />
Miscellaneous textile mach<strong>in</strong>e oper 80 0.6 60 0.5 46 0.3<br />
Packag<strong>in</strong>g <strong>and</strong> fill<strong>in</strong>g mach<strong>in</strong>e oper 13 0.1 9 0.1 39 0.2<br />
Pr<strong>in</strong>t<strong>in</strong>g press operators 21 0.2 26 0.2 35 0.2<br />
Pa<strong>in</strong>t<strong>in</strong>g & pa<strong>in</strong>t spray<strong>in</strong>g mach<strong>in</strong>e op 8 0.1 14 0.1 31 0.2<br />
Mold<strong>in</strong>g <strong>and</strong> cast<strong>in</strong>g mach<strong>in</strong>e oper 28 0.2 32 0.2 24 0.1<br />
W<strong>in</strong>d<strong>in</strong>g <strong>and</strong> twist<strong>in</strong>g mach<strong>in</strong>e oper 24 0.2 19 0.1 22 0.1<br />
Slic<strong>in</strong>g <strong>and</strong> cutt<strong>in</strong>g mach<strong>in</strong>e operators 10 0.1 21 0.2 21 0.1<br />
Wood lathe/rout<strong>in</strong>g/plan<strong>in</strong>g mach oper 15 0.1 5 0.0 18 0.1<br />
Miscellaneous pr<strong>in</strong>t<strong>in</strong>g mach<strong>in</strong>e oper 29 0.2 21 0.2 13 0.1<br />
Graders <strong>and</strong> sorters, exc. agricultural 8 0.1 10 0.1 12 0.1<br />
*Transportation or Material H<strong>and</strong>ler 1,199 9.4 1,192 9.3 1,543 9.3<br />
Truck drivers 820 6.4 813 6.3 1,042 6.3<br />
Driver-sales workers 85 0.7 102 0.8 143 0.9<br />
Bus drivers 101 0.8 72 0.6 88 0.5<br />
Operat<strong>in</strong>g eng<strong>in</strong>eers 57 0.4 60 0.5 77 0.5<br />
Industrial truck/tractor equip operators 46 0.4 51 0.4 70 0.4<br />
Misc material mov<strong>in</strong>g equipment oper 45 0.4 50 0.4 60 0.4<br />
Motor transportation occupations, NEC 12 0.1 10 0.1 12 0.1<br />
Excavat<strong>in</strong>g & load<strong>in</strong>g mach<strong>in</strong>e oper 5 0.0 9 0.1 11 0.1<br />
_________________________________________________________________________________________<br />
Ma<strong>in</strong>e Department <strong>of</strong> Labor 38<br />
Bureau <strong>of</strong> Labor St<strong>and</strong>ards
Cont<strong>in</strong>ued on next page<br />
<strong>Characteristics</strong> <strong>of</strong> <strong>Work</strong>-related <strong>Injuries</strong> <strong>and</strong> <strong>Illnesses</strong> <strong>in</strong> Ma<strong>in</strong>e 1999_________________<br />
Table 14. Disabl<strong>in</strong>g Cases by Occupation <strong>of</strong> Injured <strong>Work</strong>er (cont.)<br />
Occupation <strong>of</strong> Injured <strong>Work</strong>er<br />
Disabl<strong>in</strong>g Cases<br />
1997 1998 1999<br />
Number Percent Number Percent Number Percent<br />
*Adm<strong>in</strong>istration Support-Clerical 882 6.9 936 7.3 1,103 6.7<br />
Order clerks 64 0.5 146 1.1 179 1.1<br />
Adm<strong>in</strong>istrative support occupation NEC 88 0.7 80 0.6 118 0.7<br />
Traffic, shipp<strong>in</strong>g, <strong>and</strong> receiv<strong>in</strong>g clerks 157 1.2 145 1.1 89 0.5<br />
Secretaries 52 0.4 55 0.4 84 0.5<br />
Typists 49 0.4 43 0.3 63 0.4<br />
General <strong>of</strong>fice clerks 65 0.5 71 0.6 57 0.3<br />
Insurance adjusters/exam<strong>in</strong>ers/<strong>in</strong>vestgrs 27 0.2 35 0.3 51 0.3<br />
Teachers aides 12 0.1 9 0.1 40 0.2<br />
Investigators /adjusters, ex <strong>in</strong>surance 36 0.3 20 0.2 39 0.2<br />
Bank tellers 22 0.2 29 0.2 34 0.2<br />
Stock <strong>and</strong> <strong>in</strong>ventory clerks 16 0.1 22 0.2 30 0.2<br />
Bookkeepers/account<strong>in</strong>g/audit clerks 35 0.3 37 0.3 26 0.2<br />
Receptionists 23 0.2 17 0.1 22 0.1<br />
Data-entry keyers 9 0.1 21 0.2 21 0.1<br />
Dispatchers 14 0.1 16 0.1 18 0.1<br />
Records clerks 11 0.1 9 0.1 17 0.1<br />
Supervisors, general <strong>of</strong>fice 16 0.1 11 0.1 15 0.1<br />
Telephone operators 8 0.1 5 0.0 15 0.1<br />
Eligibility clerks, social welfare 39 0.3 32 0.2 15 0.1<br />
Meter readers 19 0.1 8 0.1 14 0.1<br />
Expediters 7 0.1 15 0.1 14 0.1<br />
Computer operators 6 0.0 7 0.1 13 0.1<br />
Mail clerks, exc. postal service 15 0.1 15 0.1 13 0.1<br />
Messengers 20 0.2 19 0.1 13 0.1<br />
*Pr<strong>of</strong>essional Specialty 707 5.6 628 4.9 852 5.1<br />
Registered nurses 238 1.9 194 1.5 273 1.6<br />
Social workers 52 0.4 71 0.6 102 0.6<br />
Teachers, NEC 87 0.7 79 0.6 89 0.5<br />
Elementary school 78 0.6 73 0.6 57 0.3<br />
Secondary school 4 0.0 18 0.1 46 0.3<br />
Postsecondary teachers-subj not spec 21 0.2 12 0.1 42 0.3<br />
Counselors, educational & vocational 23 0.2 22 0.2 31 0.2<br />
Physicians assistants 23 0.2 19 0.1 22 0.1<br />
Respiratory therapists 4 0.0 4 0.0 17 0.1<br />
Special education 12 0.1 9 0.1 16 0.1<br />
Recreation workers 29 0.2 21 0.2 16 0.1<br />
*Sales Occupation 698 5.5 639 5.0 783 4.7<br />
Cashiers 160 1.3 143 1.1 196 1.2<br />
Supervisors/proprietors-sales occupation 137 1.1 150 1.2 177 1.1<br />
Sales counter clerks 122 1.0 173 1.3 144 0.9<br />
Sales workers, other commodities 155 1.2 46 0.4 99 0.6<br />
Sales workers, hardware/bldg supplies 14 0.1 29 0.2 37 0.2<br />
Sales workers, apparel 18 0.1 10 0.1 22 0.1<br />
_________________________________________________________________________________________<br />
Ma<strong>in</strong>e Department <strong>of</strong> Labor 39<br />
Bureau <strong>of</strong> Labor St<strong>and</strong>ards
<strong>Characteristics</strong> <strong>of</strong> <strong>Work</strong>-related <strong>Injuries</strong> <strong>and</strong> <strong>Illnesses</strong> <strong>in</strong> Ma<strong>in</strong>e 1999_________________<br />
Table 14. Disabl<strong>in</strong>g Cases by Occupation <strong>of</strong> Injured <strong>Work</strong>er (cont.)<br />
Occupation <strong>of</strong> Injured <strong>Work</strong>er<br />
Disabl<strong>in</strong>g Cases<br />
1997 1998 1999<br />
Number Percent Number Percent Number Percent<br />
*Farm<strong>in</strong>g, Fish<strong>in</strong>g, or Forestry Occup. 364 2.9 391 3.0 441 2.7<br />
Groundskeepers & gardeners ex. farm 113 0.9 150 1.2 153 0.9<br />
Farm workers 65 0.5 69 0.5 76 0.5<br />
Timber cutt<strong>in</strong>g & logg<strong>in</strong>g occupations 90 0.7 82 0.6 75 0.5<br />
Animal caretakers, except farm 28 0.2 25 0.2 41 0.2<br />
Mar<strong>in</strong>e life cultivation workers 23 0.2 13 0.1 37 0.2<br />
Supervisors-related agricultural occup 14 0.1 14 0.1 23 0.1<br />
Forestry workers, except logg<strong>in</strong>g 11 0.1 19 0.1 19 0.1<br />
*Executive Adm<strong>in</strong>istrative or Managerial 314 2.5 268 2.1 421 2.5<br />
Managers <strong>and</strong> adm<strong>in</strong>istrators, NEC 100 0.8 90 0.7 120 0.7<br />
Managers, food serv<strong>in</strong>g/lodg<strong>in</strong>g establish 37 0.3 31 0.2 56 0.3<br />
Managers/service organizations NEC 32 0.3 29 0.2 38 0.2<br />
F<strong>in</strong>ancial managers 16 0.1 10 0.1 35 0.2<br />
Management related occupations NEC 34 0.3 24 0.2 30 0.2<br />
Managers, medic<strong>in</strong>e <strong>and</strong> health 10 0.1 18 0.1 22 0.1<br />
Accountants <strong>and</strong> auditors 17 0.1 10 0.1 18 0.1<br />
Inspectors/compliance <strong>of</strong>ficer ex constr 11 0.1 12 0.1 18 0.1<br />
Adm<strong>in</strong>istrators, education/related fields 8 0.1 4 0.0 17 0.1<br />
Adm<strong>in</strong>istrators/<strong>of</strong>ficials, public adm<strong>in</strong> 14 0.1 9 0.1 15 0.1<br />
Managers, properties <strong>and</strong> real estate 2 0.0 2 0.0 11 0.1<br />
*Protective Service 392 3.1 376 2.9 418 2.5<br />
Police <strong>and</strong> detectives, public service 127 1.0 112 0.9 129 0.8<br />
Firefight<strong>in</strong>g occupations 104 0.8 109 0.8 116 0.7<br />
Guards <strong>and</strong> police, exc. public service 45 0.4 37 0.3 51 0.3<br />
Correctional <strong>in</strong>stitution <strong>of</strong>ficers 52 0.4 59 0.5 45 0.3<br />
Protective service occupations, NEC 28 0.2 36 0.3 24 0.1<br />
Supervisors-police <strong>and</strong> detectives 13 0.1 12 0.1 22 0.1<br />
Sheriffs/bailiffs/law enforcement <strong>of</strong>ficers 3 0.0 3 0.0 13 0.1<br />
Supervisors-firefight<strong>in</strong>g/prevention 13 0.1 7 0.1 12 0.1<br />
*Technician/Support Occupation 180 1.4 212 1.6 282 1.7<br />
Health technologists/technicians, NEC 70 0.6 103 0.8 112 0.7<br />
Technicians, NEC 13 0.1 18 0.1 53 0.3<br />
Licensed practical nurses 46 0.4 48 0.4 38 0.2<br />
Radiology technicians 13 0.1 11 0.1 26 0.2<br />
Cl<strong>in</strong>ical lab technologists/technicians 7 0.1 8 0.1 16 0.1<br />
*Unknown 192 1.5 139 1.1 209 1.3<br />
*Private Household 11 0.1 15 0.1 10 0.1<br />
*Military Occupation 0 0.0 4 0.0 1 0.0<br />
*L<strong>in</strong>es add up to total. Subgroups listed are those with highest lost-time <strong>in</strong>juries; they are not all-<strong>in</strong>clusive<br />
<strong>and</strong> do not add up to the group total.<br />
UNS - Unspecified source <strong>of</strong> <strong>in</strong>jury<br />
NEC - Not Elsewhere Classified-no specific code available for source <strong>of</strong> <strong>in</strong>jury described<br />
_________________________________________________________________________________________<br />
Ma<strong>in</strong>e Department <strong>of</strong> Labor 40<br />
Bureau <strong>of</strong> Labor St<strong>and</strong>ards
Nature & Part Comb<strong>in</strong>ation<br />
back, with 4,900 cases (11.6%). Nonspecific pa<strong>in</strong>, sore <strong>and</strong> hurt to the back<br />
accounted for 3,518 (8.3%) lost-time <strong>in</strong>juries as shown <strong>in</strong> Table 15.<br />
The most frequent nature/part comb<strong>in</strong>ation for lost-time <strong>in</strong>juries <strong>and</strong> illnesses<br />
for the three-year period 1997 to 1999 was spra<strong>in</strong>s, stra<strong>in</strong>s <strong>and</strong> tears to the<br />
Table 15. Nature <strong>of</strong> Injury or Illness by Part <strong>of</strong> Body Injured, Disabl<strong>in</strong>g Cases, Ma<strong>in</strong>e, 1997-1999<br />
<strong>Characteristics</strong> <strong>of</strong> <strong>Work</strong>-related <strong>Injuries</strong> <strong>and</strong> <strong>Illnesses</strong> <strong>in</strong> Ma<strong>in</strong>e 1999_________________<br />
Part <strong>of</strong> Body Affected<br />
Nature <strong>of</strong> Injury or Illness<br />
Upper Ex- Lower Ex- Trunk, ex- Multiple<br />
Body Neck<br />
Total Back tremitiestremitiescept Back Body Parts Head Systems Throat Other<br />
Total 42,142 10,317 8,772 7,865 5,958 4,619 2,025 1,443 824 319<br />
Spra<strong>in</strong>s, stra<strong>in</strong>s, tears 11,640 4,900 946 2,886 1,712 736 3 0 418 39<br />
Nonspecified pa<strong>in</strong>, sore, hurt 9,200 3,518 1,576 1,048 1,422 1,390 49 0 192 5<br />
Traumatic <strong>in</strong>juries & disorders, UNS 3,344 625 546 733 390 644 313 0 68 25<br />
Nonclassifiable 2,960 610 489 500 414 551 131 19 68 178<br />
Bruises, contusions 2,340 185 433 793 356 407 142 0 9 15<br />
Fractures 2,064 73 717 846 272 64 76 0 10 6<br />
Cuts, lacerations 1,983 3 1,506 209 11 33 212 0 5 4<br />
Tendonitis 979 3 633 91 160 57 1 0 19 15<br />
Anxiety, stress, 952 0 0 0 0 0 0 952 0 0<br />
General symptoms 528 10 241 24 9 99 12 129 4 0<br />
Hernia 493 0 0 0 493 0 0 0 0 0<br />
Nonspecified <strong>in</strong>flammation 487 13 214 184 45 22 5 2 2 0<br />
Heat burns, scalds 484 2 270 91 14 79 24 0 1 3<br />
Punctures, except bites 422 1 258 139 6 3 14 0 0 1<br />
Carpal Tunnel Syndrome 417 0 410 2 3 0 0 1 0 1<br />
Foreign bodies- superficial spl<strong>in</strong>ter 355 0 1 1 0 0 353 0 0 0<br />
Dislocations 324 123 30 49 104 3 10 0 5 0<br />
Abrasions, scratches 246 5 26 43 5 15 150 0 2 0<br />
Dermatitis 215 0 82 12 2 100 14 0 0 5<br />
Cuts, abrasions, bruises 194 2 27 32 1 111 21 0 0 0<br />
Spra<strong>in</strong>s & bruises 185 14 20 46 11 88 1 0 4 1<br />
Concussions 174 0 0 0 0 1 173 0 0 0<br />
Chemical burns 171 2 30 25 4 14 92 0 1 3<br />
Multiple symptoms 155 0 2 0 4 54 4 91 0 0<br />
Amputations 149 0 142 7 0 0 0 0 0 0<br />
All other natures 1,681 228 173 104 520 148 225 249 16 18<br />
_________________________________________________________________________________________<br />
Ma<strong>in</strong>e Department <strong>of</strong> Labor 41<br />
Bureau <strong>of</strong> Labor St<strong>and</strong>ards
Nature & Event or Exposure Comb<strong>in</strong>ation<br />
due to overexertion. Another 4,168 (9.9%) lost-time overexertion cases<br />
were due to nonspecified pa<strong>in</strong>, sore, <strong>and</strong> hurt.<br />
Table 16 shows that <strong>of</strong> the 42,142 lost-time <strong>in</strong>juries that occurred between<br />
1997 <strong>and</strong> 1999, 6,137 (14.6%) were spra<strong>in</strong>s, stra<strong>in</strong>s, <strong>and</strong> tears<br />
Table 16. Nature <strong>of</strong> Injury or Illness by Event or Exposure, Disabl<strong>in</strong>g Cases, Ma<strong>in</strong>e, 1997-1999<br />
Event or Exposure<br />
<strong>Characteristics</strong> <strong>of</strong> <strong>Work</strong>-related <strong>Injuries</strong> <strong>and</strong> <strong>Illnesses</strong> <strong>in</strong> Ma<strong>in</strong>e 1999_________________<br />
Nature <strong>of</strong> Injury or Illness<br />
Fire Explosion<br />
Assault<br />
Violent<br />
Act<br />
Transportation<br />
Accident<br />
Exposure<br />
Harmful<br />
Substance<br />
Other<br />
Unknown<br />
Bodily<br />
Motion<br />
Bodily<br />
Reaction<br />
Contact<br />
w/Object<br />
Equip Fall<br />
Overexertion<br />
Total<br />
Total 42,142 12,821 7,897 6,090 5,447 4,133 2,124 1,717 1,320 526 67<br />
Spra<strong>in</strong>s, stra<strong>in</strong>s, tears 11,640 6,137 586 1,227 2,842 276 304 0 219 48 1<br />
Nonspecified pa<strong>in</strong>, sore, hurt 9,200 4,168 678 828 1,441 993 804 15 220 52 1<br />
Traumatic <strong>in</strong>juries & disorders, UNS 3,344 740 883 813 349 92 143 10 214 98 2<br />
Nonclassifiable 2,960 623 514 659 342 195 300 88 190 47 2<br />
Bruises, contusions 2,340 32 1,110 913 18 1 31 0 178 51 6<br />
Fractures 2,064 34 765 1,008 95 1 22 0 112 24 3<br />
Cuts, lacerations 1,983 7 1,766 147 1 0 14 0 37 8 3<br />
Tendonitis 979 165 35 4 89 600 83 1 1 1 0<br />
Anxiety, stress 952 0 0 0 0 881 0 20 3 47 1<br />
General symptoms 528 99 18 12 22 239 85 43 6 4 0<br />
Hernia 493 416 3 4 29 5 36 0 0 0 0<br />
Nonspecified <strong>in</strong>flammation 487 95 72 36 65 109 101 4 2 3 0<br />
Heat burns, scalds 484 0 0 0 0 0 0 454 1 0 29<br />
Punctures, except bites 422 0 404 8 0 0 3 5 1 1 0<br />
Carpal Tunnel Syndrome 417 16 0 0 5 391 5 0 0 0 0<br />
Foreign bodies-superficial spl<strong>in</strong>ter 355 0 354 0 1 0 0 0 0 0 0<br />
Dislocations 324 124 47 64 65 4 13 0 6 1 0<br />
Abrasions, scratches 246 0 192 38 0 0 2 0 2 11 1<br />
Dermatitis 215 0 0 0 0 0 2 213 0 0 0<br />
Cuts, abrasions, bruises 194 0 63 88 0 0 1 0 32 9 1<br />
Spra<strong>in</strong>s & bruises 185 0 48 107 0 0 0 0 19 11 0<br />
Concussions 174 1 82 58 0 0 2 0 26 5 0<br />
Chemical burns 171 0 0 0 0 0 0 167 0 0 4<br />
Multiple symptoms 155 3 3 2 1 16 47 79 3 1 0<br />
Amputations 149 0 142 2 0 0 1 0 4 0 0<br />
All other natures 1,681 161 132 72 82 330 125 618 44 104 13<br />
_________________________________________________________________________________________<br />
Ma<strong>in</strong>e Department <strong>of</strong> Labor 42<br />
Bureau <strong>of</strong> Labor St<strong>and</strong>ards
Nature & Source Comb<strong>in</strong>ation<br />
1999, result<strong>in</strong>g <strong>in</strong> 4,246 (10.1%) cases <strong>of</strong> spra<strong>in</strong>s, stra<strong>in</strong>s, <strong>and</strong> tears; another<br />
3,195 cases (7.6%) were due to nonspecific pa<strong>in</strong>, sore <strong>and</strong> hurt.<br />
Table 17 shows a cross tabulation <strong>of</strong> the nature <strong>of</strong> the <strong>in</strong>jury or illness by<br />
the source <strong>of</strong> the <strong>in</strong>jury or illness. Persons, plants, animals, or m<strong>in</strong>erals<br />
caused 11,640 (27.6%) lost-time <strong>in</strong>jury <strong>and</strong> illness claims from 1997-<br />
Table 17. Nature <strong>of</strong> Injury or Illness by Source <strong>of</strong> Injury or Illness, Disabl<strong>in</strong>g Cases, Ma<strong>in</strong>e, 1997-1999<br />
<strong>Characteristics</strong> <strong>of</strong> <strong>Work</strong>-related <strong>Injuries</strong> <strong>and</strong> <strong>Illnesses</strong> <strong>in</strong> Ma<strong>in</strong>e 1999_________________<br />
Source <strong>of</strong> Injury or Illness<br />
Person<br />
Tools<br />
Nature <strong>of</strong> Injury or Illness<br />
Plant<br />
Equip<br />
Animal Structure Conta<strong>in</strong>- Parts<br />
Instru-<br />
Furniture Chemi-<br />
Total M<strong>in</strong>eral Surface Other ers Materials Vehicles ment Mach<strong>in</strong>ery Fixture cals<br />
Total 42,142 12,878 7,019 5,619 4,713 3,229 2,628 2,358 1,934 1,220 544<br />
Spra<strong>in</strong>s, stra<strong>in</strong>s, tears 11,640 4,246 1,508 1,099 2,022 917 575 544 330 397 2<br />
Nonspecified pa<strong>in</strong>, sore, hurt 9,200 3,195 999 1,598 1,299 565 517 410 339 274 4<br />
Traumatic <strong>in</strong>juries & disorders UNS 3,344 731 899 330 349 268 338 154 156 117 2<br />
Nonclassifiable 2,960 714 736 463 230 172 288 105 106 87 59<br />
Bruises, contusions 2,340 146 986 79 187 225 341 85 150 141 0<br />
Fractures 2,064 216 1,069 39 105 216 173 84 122 40 0<br />
Cuts, lacerations 1,983 44 205 96 149 258 115 642 405 69 0<br />
Tendonitis 979 678 30 164 43 15 16 18 10 5 0<br />
Anxiety, stress 952 948 0 0 1 0 3 0 0 0 0<br />
General symptoms 528 278 14 120 24 12 16 15 10 7 32<br />
Hernia 493 42 19 160 126 69 11 30 16 20 0<br />
Nonspecified <strong>in</strong>flammation 487 173 65 144 18 26 19 21 13 8 0<br />
Heat burns, scalds 484 129 2 224 16 37 4 7 45 0 20<br />
Punctures, except bites 422 18 12 37 9 256 0 71 16 3 0<br />
Carpal Tunnel Syndrome 417 397 3 9 3 0 0 1 4 0 0<br />
Foreign bodies-superficial spl<strong>in</strong>ter 355 8 0 339 1 4 0 0 0 0 3<br />
Dislocations 324 83 75 45 40 28 21 16 7 9 0<br />
Abrasions, scratches 246 28 42 102 11 28 10 16 6 3 0<br />
Dermatitis 215 49 0 103 0 8 0 1 0 0 54<br />
Cuts, abrasions, bruises 194 14 88 4 10 18 42 1 12 5 0<br />
Spra<strong>in</strong>s & bruises 185 17 114 3 5 5 28 2 6 5 0<br />
Concussions 174 10 67 6 14 11 34 10 5 17 0<br />
Chemical burns 171 0 0 2 0 2 0 0 0 0 167<br />
Multiple symptoms 155 18 3 75 4 3 3 0 1 0 48<br />
Amputations 149 0 4 2 2 17 11 13 100 0 0<br />
All other natures 1,681 228 173 104 520 148 225 249 16 18 17<br />
_________________________________________________________________________________________<br />
Ma<strong>in</strong>e Department <strong>of</strong> Labor 43<br />
Bureau <strong>of</strong> Labor St<strong>and</strong>ards
Source & Event or Exposure Comb<strong>in</strong>ation<br />
overexertion occurred. Another 4,133 workers (9.8%) lost time by bodily<br />
motion due to persons, plants, animals, m<strong>in</strong>erals. The person <strong>in</strong>jured<br />
is used as the source for such events as free bodily motion (walk<strong>in</strong>g,<br />
sitt<strong>in</strong>g, reach<strong>in</strong>g), repetitive motion (typ<strong>in</strong>g, prolonged use <strong>of</strong> h<strong>and</strong>tools),<br />
bodily conditions (heart attacks, strokes). See the footnote for a<br />
description <strong>of</strong> bodily reaction <strong>and</strong> bodily motion.<br />
As shown <strong>in</strong> Table 18, falls to structures <strong>and</strong> surfaces led to 5,750<br />
claims (13.6%) for disabl<strong>in</strong>g work-related <strong>in</strong>juries <strong>and</strong> illnesses dur<strong>in</strong>g<br />
the 1997-1999 period, the highest source/event comb<strong>in</strong>ation. The second<br />
highest comb<strong>in</strong>ation was bodily reaction due to persons, plants,<br />
animals <strong>and</strong> m<strong>in</strong>erals with 5,078 cases (12.0%). Bodily reaction <strong>in</strong>cludes<br />
bend<strong>in</strong>g, climb<strong>in</strong>g, sitt<strong>in</strong>g, slipp<strong>in</strong>g without fall<strong>in</strong>g where no<br />
<strong>Characteristics</strong> <strong>of</strong> <strong>Work</strong>-related <strong>Injuries</strong> <strong>and</strong> <strong>Illnesses</strong> <strong>in</strong> Ma<strong>in</strong>e 1999_________________<br />
Table 18. Source <strong>of</strong> Injury or Illness by Event or Exposure, Disabl<strong>in</strong>g Cases, Ma<strong>in</strong>e, 1997-1999<br />
Event or Exposure<br />
Assault<br />
Violent<br />
Acts<br />
Transportation<br />
Accident<br />
Exposure<br />
Harmful<br />
Substance<br />
Contact<br />
w/Object<br />
Equip Fall<br />
Source <strong>of</strong> Injury or Illness<br />
Fire Explosion<br />
Other<br />
Unknown<br />
Bodily**<br />
Motion<br />
Bodily*<br />
Reaction<br />
Overexertion<br />
Total<br />
Total 42,142 12,821 7,897 6,090 5,447 4,133 2,124 1,717 1,320 526 67<br />
Persons, Plants, Animals, M<strong>in</strong>erals 12,878 2,256 511 18 5,078 4,133 3 360 0 519 0<br />
Structures <strong>and</strong> Surfaces 7,019 347 897 5,750 10 0 4 0 7 0 4<br />
Other Sources <strong>and</strong> Nonclassifiable 5,619 1,771 797 9 338 0 2,100 561 0 6 37<br />
Conta<strong>in</strong>ers 4,713 3,820 802 66 0 0 3 16 0 0 6<br />
Parts <strong>and</strong> Materials 3,229 1,584 1,524 36 0 0 3 67 1 1 13<br />
Vehicles 2,628 604 653 79 8 0 4 4 1,275 0 1<br />
Tools, Equipment, Instruments 2,358 1,129 1,103 16 7 0 4 98 0 0 1<br />
Mach<strong>in</strong>ery 1,934 619 1,143 55 4 0 1 72 37 0 3<br />
Furniture <strong>and</strong> Fixtures 1,220 687 461 61 2 0 2 7 0 0 0<br />
Chemical <strong>and</strong> Chemical Products 544 4 6 0 0 0 0 532 0 0 2<br />
*Bodily reaction <strong>in</strong>cludes bend<strong>in</strong>g, climb<strong>in</strong>g, crawl<strong>in</strong>g, reach<strong>in</strong>g, twist<strong>in</strong>g, runn<strong>in</strong>g, sitt<strong>in</strong>g, slips, trips, st<strong>and</strong><strong>in</strong>g, walk<strong>in</strong>g where no exertion is <strong>in</strong>volved.<br />
**Bodily motion <strong>in</strong>cludes, repetitive typ<strong>in</strong>g, data key entry, use <strong>of</strong> tools, plac<strong>in</strong>g, grasp<strong>in</strong>g or mov<strong>in</strong>g objects, <strong>and</strong> susta<strong>in</strong>ed view<strong>in</strong>g <strong>of</strong> term<strong>in</strong>al<br />
screens. Heart attacks <strong>and</strong> stress also are <strong>in</strong> this group when no outside force is the cause.<br />
_________________________________________________________________________________________<br />
Ma<strong>in</strong>e Department <strong>of</strong> Labor 44<br />
Bureau <strong>of</strong> Labor St<strong>and</strong>ards
<strong>Characteristics</strong> <strong>of</strong> <strong>Work</strong>-related <strong>Injuries</strong> <strong>and</strong> <strong>Illnesses</strong> <strong>in</strong> Ma<strong>in</strong>e 1999_________________<br />
Appendices<br />
Appendix A<br />
Technical Notes 46<br />
Cod<strong>in</strong>g Summary 48<br />
Sample <strong>of</strong> Nature Codes 49<br />
Appendix B<br />
Fatality Reports for 1999 50<br />
_________________________________________________________________________________________<br />
Ma<strong>in</strong>e Department <strong>of</strong> Labor 45<br />
Bureau <strong>of</strong> Labor St<strong>and</strong>ards
Appendix A<br />
Technical Notes<br />
<strong>Characteristics</strong> <strong>of</strong> <strong>Work</strong>-related <strong>Injuries</strong> <strong>and</strong> <strong>Illnesses</strong> <strong>in</strong> Ma<strong>in</strong>e 1999_________________<br />
Under the Ma<strong>in</strong>e <strong>Work</strong>ersí Compensation Act <strong>and</strong><br />
the Occupational Disease Law, employers must file a<br />
First Report <strong>of</strong> Occupational Injury or Disease or its<br />
equivalent with the <strong>Work</strong>ersí Compensation Board<br />
with<strong>in</strong> seven days <strong>of</strong> notice or knowledge <strong>of</strong> each<br />
<strong>in</strong>cident which resulted <strong>in</strong> the loss <strong>of</strong> at least one<br />
Data Element Source Def<strong>in</strong>ition<br />
Case Number Ma<strong>in</strong>e <strong>Work</strong>ersí<br />
Compensation Board<br />
(WCB)<br />
Employer<br />
Number (UIAN)<br />
Industry (SIC)/<br />
Ownership<br />
Bureau <strong>of</strong> Unemployment<br />
Compensation (BUC)<br />
U.S. Office <strong>of</strong> Management<br />
& Budget, St<strong>and</strong>ard<br />
Industrial<br />
Classification Manual<br />
County State Plann<strong>in</strong>g Office,<br />
Geographic, Cod<strong>in</strong>g<br />
System<br />
Insurance<br />
Carrier<br />
National Council <strong>of</strong><br />
Compensation Insurance<br />
(NCCI)<br />
Gender From First Report<br />
Unique number assigned sequentially by the WCB.<br />
Unemployment Insurance number assigned by BUC.<br />
A 4-digit code assigned to each employer to classify the<br />
establishment by type <strong>of</strong> activity <strong>in</strong> which it is engaged.<br />
An ownership code is also assigned to show whether the<br />
employer is <strong>in</strong> private <strong>in</strong>dustry, state<br />
<strong>gov</strong>ernment, or local <strong>gov</strong>ernment.<br />
A code is assigned based on the county <strong>in</strong> which the<br />
<strong>in</strong>cident occurred.<br />
The NCCI number <strong>of</strong> the employerís<br />
<strong>in</strong>surance carrier is assigned.<br />
Age From First Report Calculated date <strong>of</strong> birth to date <strong>of</strong> <strong>in</strong>jury.<br />
Date <strong>of</strong> Injury or<br />
Illness<br />
From First Report The date <strong>of</strong> occurrence is used if applicable. For illnesses,<br />
the date <strong>of</strong> diagnosis is used.<br />
Time <strong>of</strong> Accident From First Report Time listed is converted to the 4-digit 24-hour system<br />
(optional).<br />
Length <strong>of</strong> Service From First Report Calculated time between date <strong>of</strong> hire <strong>and</strong> date <strong>of</strong> <strong>in</strong>jury<br />
(optional).<br />
Occupation 1993 U.S. Bureau <strong>of</strong><br />
Census Occupational<br />
Classification System<br />
dayís work after the day <strong>of</strong> the <strong>in</strong>jury. Each case is<br />
assigned a unique identifier. The First Reports are<br />
then coded by the Department <strong>of</strong> Labor for the data<br />
elements shown below:<br />
Codes assigned based on <strong>in</strong>formation listed on First Report.<br />
_________________________________________________________________________________________<br />
Ma<strong>in</strong>e Department <strong>of</strong> Labor 46<br />
Bureau <strong>of</strong> Labor St<strong>and</strong>ards
<strong>Characteristics</strong> <strong>of</strong> <strong>Work</strong>-related <strong>Injuries</strong> <strong>and</strong> <strong>Illnesses</strong> <strong>in</strong> Ma<strong>in</strong>e 1999_________________<br />
Data Element Source Def<strong>in</strong>ition<br />
Nature <strong>of</strong> Injury<br />
or Illness<br />
Part <strong>of</strong> Body<br />
Injured<br />
Occupational Injury &<br />
Illness Classification Manual<br />
Occupational Injury &<br />
Illness Classification Manual<br />
Source <strong>of</strong> Injury Occupational Injury &<br />
Illness Classification Manual<br />
Event or<br />
Exposure<br />
Occupational Injury &<br />
Illness Classification Manual<br />
Secondary Source Occupational Injury &<br />
Illness Classification Manual<br />
Used for first time for 1993 <strong>in</strong>juries <strong>and</strong> illnesses. Cod<strong>in</strong>g<br />
is done on 1-digit, 2-digit, 3-digit, or 4-digit level depend<strong>in</strong>g<br />
on the details <strong>of</strong> the description <strong>of</strong> the <strong>in</strong>jury or illness<br />
Indicates part <strong>of</strong> body or the body system associated with<br />
the nature <strong>of</strong> <strong>in</strong>jury or illness.<br />
Identifies the object, substance, or motion which directly<br />
produced or <strong>in</strong>flicted the <strong>in</strong>jury or illness.<br />
Identifies the event or exposure which directly led to the<br />
<strong>in</strong>jury or illness.<br />
Identifies the object, substance or person that generated the<br />
source <strong>of</strong> <strong>in</strong>jury or illness that contributed to the event or<br />
exposure.<br />
Severity From First Report Severity code is one <strong>of</strong> the follow<strong>in</strong>g:<br />
1). Fatality<br />
2). Disabl<strong>in</strong>g (one or more lost work-days beyond the date<br />
<strong>of</strong> the <strong>in</strong>jury)<br />
3). Nondisabl<strong>in</strong>g (no lost work time beyond the date <strong>of</strong><br />
the <strong>in</strong>jury)<br />
9). Unknown (not reported).<br />
_________________________________________________________________________________________<br />
Ma<strong>in</strong>e Department <strong>of</strong> Labor 47<br />
Bureau <strong>of</strong> Labor St<strong>and</strong>ards
Cod<strong>in</strong>g Summary<br />
<strong>Characteristics</strong> <strong>of</strong> <strong>Work</strong>-related <strong>Injuries</strong> <strong>and</strong> <strong>Illnesses</strong> <strong>in</strong> Ma<strong>in</strong>e 1999_________________<br />
The First Reports <strong>of</strong> Occupational Injury or Disease<br />
are read by staff who assign codes to the occupation,<br />
nature (k<strong>in</strong>d) <strong>of</strong> <strong>in</strong>jury, part <strong>of</strong> body <strong>in</strong>jured, source <strong>of</strong><br />
<strong>in</strong>jury, <strong>and</strong> the event lead<strong>in</strong>g up to the <strong>in</strong>jury. The<br />
coder selects codes from one to four digits <strong>in</strong> length.<br />
A 4-digit code is the most detailed description <strong>and</strong> a<br />
1-digit code is the most general category.<br />
Occupation codes are all 4-digit codes.<br />
When an <strong>in</strong>jury is described on a First Report <strong>of</strong> Occupational Injury or Disease, the coder<br />
goes through the follow<strong>in</strong>g process:<br />
♦ codes 4-digit level for<br />
♦ nature<br />
♦ part <strong>of</strong> body<br />
♦ source <strong>of</strong> <strong>in</strong>jury<br />
♦ event<br />
♦ if not enough detail,<br />
uses a 3-digit or 2-digit code<br />
For example, if the report <strong>in</strong>dicates that the f<strong>in</strong>gertip was amputated:<br />
♦ 0311-amputation, f<strong>in</strong>gertip is coded<br />
If the report <strong>in</strong>dicates an amputation but no body part is mentioned:<br />
♦ 031-amputation would be used s<strong>in</strong>ce there is not enough <strong>in</strong>formation to<br />
identify the body part<br />
If the <strong>in</strong>jury was described as bleed<strong>in</strong>g, with no other detail:<br />
♦ 03-open wound would be used because the coder would not know<br />
whether it was an amputation, animal bite, cut or puncture<br />
Due to space limitations, the tables <strong>in</strong> this publication only display 1- <strong>and</strong> 2-digit levels,<br />
with a few <strong>of</strong> the more common 3-digit <strong>and</strong> 4-digit levels.<br />
The next page shows a small sample <strong>of</strong> the nature codes to help expla<strong>in</strong> this cod<strong>in</strong>g structure.<br />
_________________________________________________________________________________________<br />
Ma<strong>in</strong>e Department <strong>of</strong> Labor 48<br />
Bureau <strong>of</strong> Labor St<strong>and</strong>ards
Sample <strong>of</strong> Nature Codes<br />
1-digit<br />
most<br />
general<br />
2-digit<br />
more<br />
detail<br />
3-digit<br />
even more<br />
detail<br />
4-digit<br />
most<br />
detail<br />
<strong>Characteristics</strong> <strong>of</strong> <strong>Work</strong>-related <strong>Injuries</strong> <strong>and</strong> <strong>Illnesses</strong> <strong>in</strong> Ma<strong>in</strong>e 1999_________________<br />
Nature <strong>of</strong> Injury or Illness<br />
_________________________________________________________________________________________<br />
Ma<strong>in</strong>e Department <strong>of</strong> Labor 49<br />
Bureau <strong>of</strong> Labor St<strong>and</strong>ards<br />
1999<br />
Number Percent<br />
0 Traumatic <strong>Injuries</strong> & Disorders 13,402 100.0<br />
00 Traumatic <strong>in</strong>juries & disorders, UNS 1,137 8.5<br />
01 Traumatic <strong>in</strong>juries-bones nerves sp<strong>in</strong>al cord 888 6.6<br />
011 Dislocations 143 1.1<br />
012 Fractures 743 5.5<br />
014 Traumatic <strong>in</strong>juries-nerves, ex sp<strong>in</strong>al cord 2 0.0<br />
02 Traumatic <strong>in</strong>juries-muscles/tendons/lig/jo<strong>in</strong>t 5,166 38.5<br />
021 Spra<strong>in</strong>s, stra<strong>in</strong>s, tears 5,164 38.5<br />
029 Inj-muscles/tendons/ligaments/jo<strong>in</strong>t,NEC 2 0.0<br />
03 Open wounds 1,048 7.8<br />
031 Amputations 38 0.3<br />
0311 Amputations, f<strong>in</strong>gertip 17 0.1<br />
0319 Amputations, except f<strong>in</strong>gertip 21 0.2<br />
032 Animal or <strong>in</strong>sect bites 38 0.3<br />
033 Avulsions 2 0.0<br />
034 Cuts, lacerations 774 5.8<br />
036 Gunshot wounds 5 0.0<br />
037 Punctures, except bites 191 1.4<br />
04 Surface wounds & bruises 1,288 9.6<br />
041 Abrasions, scratches 91 0.7<br />
042 Blisters 3 0.0<br />
043 Bruises, contusions 1,027 7.7<br />
044 Foreign bodies-superficial spl<strong>in</strong>ter/chip 163 1.2<br />
045 Friction burns 1 0.0<br />
048 Multiple surface wounds & bruises 3 0.0<br />
05 Burns 290 2.2<br />
050 Burns, UNS 1 0.0<br />
051 chemical burns 66 0.5<br />
052 Electrical burns 4 0.0<br />
053 Heat burns, scalds 216 1.6<br />
059 Burns, NEC 3 0.0<br />
06 Intracranial <strong>in</strong>juries 74 0.6<br />
060 Intracranial <strong>in</strong>juries, UNS 1 0.0<br />
062 Concussions 73 0.5
Appendix B<br />
Fatality Reports for 1999<br />
<strong>Characteristics</strong> <strong>of</strong> <strong>Work</strong>-related <strong>Injuries</strong> <strong>and</strong> <strong>Illnesses</strong> <strong>in</strong> Ma<strong>in</strong>e 1999_________________<br />
The follow<strong>in</strong>g is a list<strong>in</strong>g <strong>of</strong> the 42 fatalities received<br />
by the <strong>Work</strong>ersí Compensation Board for the year<br />
1999 through a First Report <strong>of</strong> Occupational Injury<br />
or Disease. These fatalities are not necessarily workrelated,<br />
<strong>and</strong> they may have occurred when the worker<br />
was not <strong>in</strong> work status. The fatality data from a First<br />
Report is not the same as the data from the Census <strong>of</strong><br />
Fatal Occupational <strong>Injuries</strong> report. See the Introduction<br />
on Page 1 for clarification or to order a copy <strong>of</strong><br />
this publication.<br />
Date <strong>of</strong> Injury Occupation Age Sex Event<br />
6-May-1999 Cable TV ma<strong>in</strong>tenance 45 M Fell from telephone pole<br />
18-Nov-1999 Plumber 53 M Heart attack<br />
6-Dec-1999 Plumber 62 M Heart attack<br />
6-Aug-1999 Telephone l<strong>in</strong>e <strong>in</strong>staller 44 M Heart attack<br />
5-Oct-1999 Electrician 54 M Heart attack<br />
28-May-1999 Construction laborer 42 M Caught <strong>in</strong> ro<strong>of</strong> truss collapse<br />
Manufactur<strong>in</strong>g<br />
20-Oct-1999 Skidder operator 55 M Auto accident-rear ended<br />
4-Nov-1999 Logger 38 M Struck by fall<strong>in</strong>g tree<br />
23-Dec-1999 Logger 44 M Struck by fall<strong>in</strong>g tree<br />
2-Sep-1999 Mach<strong>in</strong>e operator 25 M Electrocution<br />
14-Nov-1999 Millwright 36 M Fall from crane<br />
15-Jul-1999 Mach<strong>in</strong>e operator 59 M Caught <strong>in</strong> mach<strong>in</strong>ery<br />
3-May-1999 Packer 48 F Heart attack<br />
29-Nov-1999 Mach<strong>in</strong>e operator 49 M Heart attack<br />
28-May-1999 General manager 59 M Auto accident-stroke<br />
Transportation & Public Utilities<br />
19-Jun-1999 Truck driver 72 M Heart attack<br />
9-Jul-1999 Truck driver 50 M Heart attack<br />
11-Sep-1999 Truck driver 29 M Auto accident-rollover<br />
12-Dec-1999 Power l<strong>in</strong>eworker 30 M Electrocution<br />
Wholesale Trade<br />
22-Jun-1999 Garage service station worker 46 M Tire explosion<br />
31-Oct-1999 Manager 51 M Heart attack<br />
12-Jan-1999 Supervisor <strong>of</strong> sales 54 M Auto accident-sideswipe<br />
Cont<strong>in</strong>ued on next page<br />
Construction<br />
_________________________________________________________________________________________<br />
Ma<strong>in</strong>e Department <strong>of</strong> Labor 50<br />
Bureau <strong>of</strong> Labor St<strong>and</strong>ards
<strong>Characteristics</strong> <strong>of</strong> <strong>Work</strong>-related <strong>Injuries</strong> <strong>and</strong> <strong>Illnesses</strong> <strong>in</strong> Ma<strong>in</strong>e 1999_________________<br />
Date <strong>of</strong> Injury Occupation Age Sex Event<br />
Retail Trade<br />
10-Jan-1999 Truck driver 65 M Heart attack<br />
Fire, Insurance, & Real Estate<br />
24-Mar-1999 Insurance adjuster 45 M Auto accident-head on<br />
1-Nov-1999 Insurance sales 34 M Auto accident-hit tree<br />
Services<br />
4-Aug-1999 Camp counselor 19 M Auto accident-struck tree<br />
23-Nov-1999 Service technician 45 M Auto accident-rear ended<br />
23-Jul-1999 Job coach 22 M Auto accident-struck tree<br />
20-Aug-1999 Truck driver 51 M Heart attack<br />
3-Jul-1999 Truck driver 42 M Auto accident-rollover<br />
15-Jan-1999 Plant manager 36 M Auto accident-head on<br />
14-Oct-1999 Janitor 45 M Heart attack<br />
6-Mar-1999 Registered nurse 71 F Heart attack<br />
29-Apr-1999 Personal care aide 55 F Heart attack<br />
5-Nov-1999 Manager-child care 56 F Auto accident-struck by truck<br />
29-Sep-1999 Field technician 37 M Struck by fall<strong>in</strong>g beam<br />
Government<br />
4-Jun-1999 Ma<strong>in</strong>tenance worker 44 M Heart attack<br />
13-Jul-1999 Tax collector 51 F Assault by shoot<strong>in</strong>g<br />
26-Jul-1999 Police <strong>of</strong>ficer 56 M Heart attack<br />
28-Dec-1999 Deputy sheriff 53 M Auto accident-rollover<br />
1-Jul-1999 Microbiologist 34 F Occupational disease<br />
8-Dec-1999 Typist 51 F Stress-related<br />
_________________________________________________________________________________________<br />
Ma<strong>in</strong>e Department <strong>of</strong> Labor 51<br />
Bureau <strong>of</strong> Labor St<strong>and</strong>ards