Characteristics of Work-Related Injuries and Illnesses in ... - Maine.gov
Characteristics of Work-Related Injuries and Illnesses in ... - Maine.gov
Characteristics of Work-Related Injuries and Illnesses in ... - Maine.gov

Create successful ePaper yourself
Turn your PDF publications into a flip-book with our unique Google optimized e-Paper software.
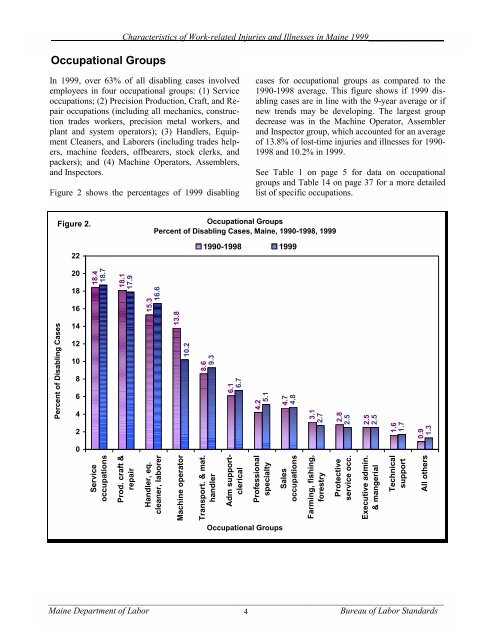
Occupational Groups<br />
<strong>Characteristics</strong> <strong>of</strong> <strong>Work</strong>-related <strong>Injuries</strong> <strong>and</strong> <strong>Illnesses</strong> <strong>in</strong> Ma<strong>in</strong>e 1999_________________<br />
In 1999, over 63% <strong>of</strong> all disabl<strong>in</strong>g cases <strong>in</strong>volved<br />
employees <strong>in</strong> four occupational groups: (1) Service<br />
occupations; (2) Precision Production, Craft, <strong>and</strong> Repair<br />
occupations (<strong>in</strong>clud<strong>in</strong>g all mechanics, construction<br />
trades workers, precision metal workers, <strong>and</strong><br />
plant <strong>and</strong> system operators); (3) H<strong>and</strong>lers, Equipment<br />
Cleaners, <strong>and</strong> Laborers (<strong>in</strong>clud<strong>in</strong>g trades helpers,<br />
mach<strong>in</strong>e feeders, <strong>of</strong>fbearers, stock clerks, <strong>and</strong><br />
packers); <strong>and</strong> (4) Mach<strong>in</strong>e Operators, Assemblers,<br />
<strong>and</strong> Inspectors.<br />
Figure 2 shows the percentages <strong>of</strong> 1999 disabl<strong>in</strong>g<br />
Percent <strong>of</strong> Disabl<strong>in</strong>g Cases<br />
Figure 2.<br />
22<br />
20<br />
18<br />
16<br />
14<br />
12<br />
10<br />
8<br />
6<br />
4<br />
2<br />
0<br />
18.4<br />
18.7<br />
Service<br />
occupations<br />
18.1<br />
17.9<br />
Prod. craft &<br />
repair<br />
15.3<br />
16.6<br />
H<strong>and</strong>ler, eq.<br />
cleaner, laborer<br />
Occupational Groups<br />
Percent <strong>of</strong> Disabl<strong>in</strong>g Cases, Ma<strong>in</strong>e, 1990-1998, 1999<br />
13.8<br />
Mach<strong>in</strong>e operator<br />
10.2<br />
1990-1998 1999<br />
8.6<br />
9.3<br />
Transport. & mat.<br />
h<strong>and</strong>ler<br />
6.1<br />
6.7<br />
Adm supportclerical<br />
cases for occupational groups as compared to the<br />
1990-1998 average. This figure shows if 1999 disabl<strong>in</strong>g<br />
cases are <strong>in</strong> l<strong>in</strong>e with the 9-year average or if<br />
new trends may be develop<strong>in</strong>g. The largest group<br />
decrease was <strong>in</strong> the Mach<strong>in</strong>e Operator, Assembler<br />
<strong>and</strong> Inspector group, which accounted for an average<br />
<strong>of</strong> 13.8% <strong>of</strong> lost-time <strong>in</strong>juries <strong>and</strong> illnesses for 1990-<br />
1998 <strong>and</strong> 10.2% <strong>in</strong> 1999.<br />
See Table 1 on page 5 for data on occupational<br />
groups <strong>and</strong> Table 14 on page 37 for a more detailed<br />
list <strong>of</strong> specific occupations.<br />
_________________________________________________________________________________________<br />
Ma<strong>in</strong>e Department <strong>of</strong> Labor 4<br />
Bureau <strong>of</strong> Labor St<strong>and</strong>ards<br />
4.2<br />
5.1<br />
Pr<strong>of</strong>essional<br />
specialty<br />
Occupational Groups<br />
4.7<br />
4.8<br />
Sales<br />
occupations<br />
3.1<br />
2.7<br />
Farm<strong>in</strong>g, fish<strong>in</strong>g,<br />
forestry<br />
2.8<br />
2.5<br />
Protective<br />
service occ.<br />
2.5<br />
2.5<br />
Executive adm<strong>in</strong>.<br />
& mangerial<br />
1.6<br />
1.7<br />
Technical<br />
support<br />
0.9<br />
1.3<br />
All others