Characteristics of Work-Related Injuries and Illnesses in ... - Maine.gov
Characteristics of Work-Related Injuries and Illnesses in ... - Maine.gov
Characteristics of Work-Related Injuries and Illnesses in ... - Maine.gov

You also want an ePaper? Increase the reach of your titles
YUMPU automatically turns print PDFs into web optimized ePapers that Google loves.
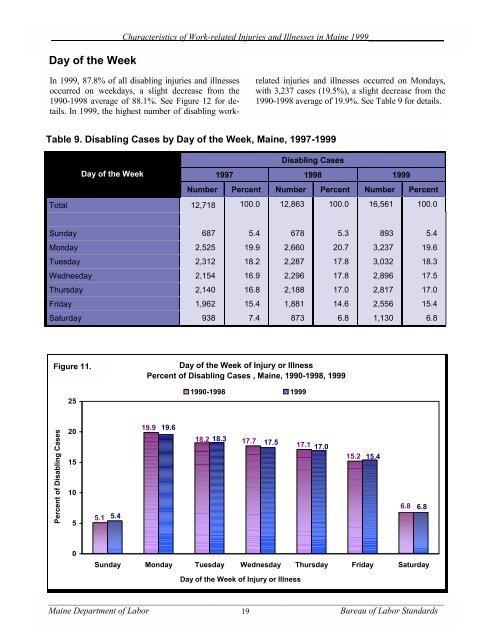
Day <strong>of</strong> the Week<br />
<strong>Characteristics</strong> <strong>of</strong> <strong>Work</strong>-related <strong>Injuries</strong> <strong>and</strong> <strong>Illnesses</strong> <strong>in</strong> Ma<strong>in</strong>e 1999_________________<br />
In 1999, 87.8% <strong>of</strong> all disabl<strong>in</strong>g <strong>in</strong>juries <strong>and</strong> illnesses<br />
occurred on weekdays, a slight decrease from the<br />
1990-1998 average <strong>of</strong> 88.1%. See Figure 12 for details.<br />
In 1999, the highest number <strong>of</strong> disabl<strong>in</strong>g work-<br />
Table 9. Disabl<strong>in</strong>g Cases by Day <strong>of</strong> the Week, Ma<strong>in</strong>e, 1997-1999<br />
Day <strong>of</strong> the Week<br />
related <strong>in</strong>juries <strong>and</strong> illnesses occurred on Mondays,<br />
with 3,237 cases (19.5%), a slight decrease from the<br />
1990-1998 average <strong>of</strong> 19.9%. See Table 9 for details.<br />
Disabl<strong>in</strong>g Cases<br />
1997 1998 1999<br />
Number Percent Number Percent Number Percent<br />
Total 12,718 100.0 12,863 100.0 16,561 100.0<br />
Sunday 687 5.4 678 5.3 893 5.4<br />
Monday 2,525 19.9 2,660 20.7 3,237 19.6<br />
Tuesday 2,312 18.2 2,287 17.8 3,032 18.3<br />
Wednesday 2,154 16.9 2,296 17.8 2,896 17.5<br />
Thursday 2,140 16.8 2,188 17.0 2,817 17.0<br />
Friday 1,962 15.4 1,881 14.6 2,556 15.4<br />
Saturday 938 7.4 873 6.8 1,130 6.8<br />
Figure 11.<br />
Percent <strong>of</strong> Disabl<strong>in</strong>g Cases<br />
25<br />
20<br />
15<br />
10<br />
5<br />
0<br />
5.1 5.4<br />
Day <strong>of</strong> the Week <strong>of</strong> Injury or Illness<br />
Percent <strong>of</strong> Disabl<strong>in</strong>g Cases , Ma<strong>in</strong>e, 1990-1998, 1999<br />
19.9<br />
19.6<br />
1990-1998 1999<br />
18.2 18.3<br />
17.7<br />
17.1 17.0<br />
Sunday Monday Tuesday Wednesday Thursday Friday Saturday<br />
_________________________________________________________________________________________<br />
Ma<strong>in</strong>e Department <strong>of</strong> Labor 19<br />
Bureau <strong>of</strong> Labor St<strong>and</strong>ards<br />
17.5<br />
Day <strong>of</strong> the Week <strong>of</strong> Injury or Illness<br />
15.2<br />
15.4<br />
6.8<br />
6.8