Characteristics of Work-Related Injuries and Illnesses in ... - Maine.gov
Characteristics of Work-Related Injuries and Illnesses in ... - Maine.gov
Characteristics of Work-Related Injuries and Illnesses in ... - Maine.gov

You also want an ePaper? Increase the reach of your titles
YUMPU automatically turns print PDFs into web optimized ePapers that Google loves.
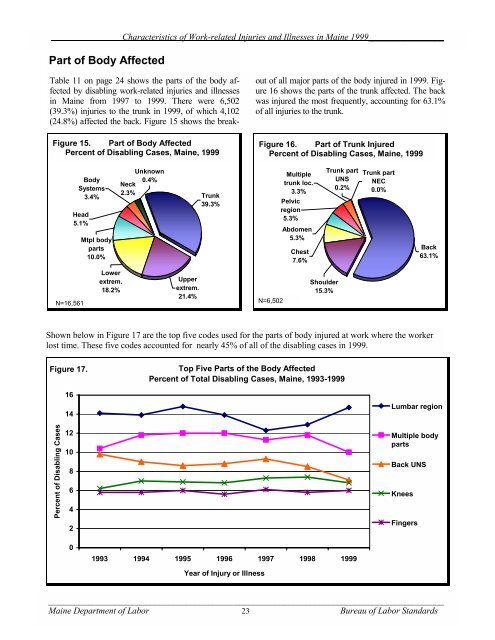
Part <strong>of</strong> Body Affected<br />
<strong>Characteristics</strong> <strong>of</strong> <strong>Work</strong>-related <strong>Injuries</strong> <strong>and</strong> <strong>Illnesses</strong> <strong>in</strong> Ma<strong>in</strong>e 1999_________________<br />
Table 11 on page 24 shows the parts <strong>of</strong> the body affected<br />
by disabl<strong>in</strong>g work-related <strong>in</strong>juries <strong>and</strong> illnesses<br />
<strong>in</strong> Ma<strong>in</strong>e from 1997 to 1999. There were 6,502<br />
(39.3%) <strong>in</strong>juries to the trunk <strong>in</strong> 1999, <strong>of</strong> which 4,102<br />
(24.8%) affected the back. Figure 15 shows the break-<br />
Figure 15. Part <strong>of</strong> Body Affected<br />
Percent <strong>of</strong> Disabl<strong>in</strong>g Cases, Ma<strong>in</strong>e, 1999<br />
Head<br />
5.1%<br />
N=16,561<br />
Percent <strong>of</strong> Disabl<strong>in</strong>g Cases<br />
16<br />
14<br />
12<br />
10<br />
8<br />
6<br />
4<br />
2<br />
0<br />
Body<br />
Systems<br />
3.4%<br />
Mtpl body<br />
parts<br />
10.0%<br />
Lower<br />
extrem.<br />
18.2%<br />
Unknown<br />
0.4%<br />
Neck<br />
2.3%<br />
Upper<br />
extrem.<br />
21.4%<br />
Trunk<br />
39.3%<br />
out <strong>of</strong> all major parts <strong>of</strong> the body <strong>in</strong>jured <strong>in</strong> 1999. Figure<br />
16 shows the parts <strong>of</strong> the trunk affected. The back<br />
was <strong>in</strong>jured the most frequently, account<strong>in</strong>g for 63.1%<br />
<strong>of</strong> all <strong>in</strong>juries to the trunk.<br />
Multiple<br />
trunk loc.<br />
3.3%<br />
Pelvic<br />
region<br />
5.3%<br />
Abdomen<br />
5.3%<br />
Shoulder<br />
15.3%<br />
Trunk part<br />
UNS<br />
0.2%<br />
Back<br />
63.1%<br />
_________________________________________________________________________________________<br />
Ma<strong>in</strong>e Department <strong>of</strong> Labor 23<br />
Bureau <strong>of</strong> Labor St<strong>and</strong>ards<br />
Chest<br />
7.6%<br />
Top Five Parts <strong>of</strong> the Body Affected<br />
Percent <strong>of</strong> Total Disabl<strong>in</strong>g Cases, Ma<strong>in</strong>e, 1993-1999<br />
1993 1994 1995 1996 1997 1998 1999<br />
Year <strong>of</strong> Injury or Illness<br />
Figure 16. Part <strong>of</strong> Trunk Injured<br />
Percent <strong>of</strong> Disabl<strong>in</strong>g Cases, Ma<strong>in</strong>e, 1999<br />
N=6,502<br />
Trunk part<br />
NEC<br />
0.0%<br />
Shown below <strong>in</strong> Figure 17 are the top five codes used for the parts <strong>of</strong> body <strong>in</strong>jured at work where the worker<br />
lost time. These five codes accounted for nearly 45% <strong>of</strong> all <strong>of</strong> the disabl<strong>in</strong>g cases <strong>in</strong> 1999.<br />
Figure 17.<br />
Lumbar region<br />
Multiple body<br />
parts<br />
Back UNS<br />
Knees<br />
F<strong>in</strong>gers