Characteristics of Work-Related Injuries and Illnesses in ... - Maine.gov
Characteristics of Work-Related Injuries and Illnesses in ... - Maine.gov
Characteristics of Work-Related Injuries and Illnesses in ... - Maine.gov

Create successful ePaper yourself
Turn your PDF publications into a flip-book with our unique Google optimized e-Paper software.
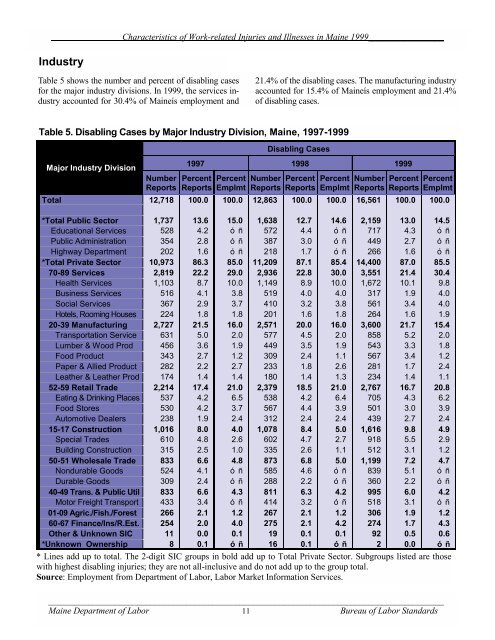
Industry<br />
<strong>Characteristics</strong> <strong>of</strong> <strong>Work</strong>-related <strong>Injuries</strong> <strong>and</strong> <strong>Illnesses</strong> <strong>in</strong> Ma<strong>in</strong>e 1999_________________<br />
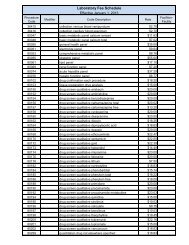
Table 5 shows the number <strong>and</strong> percent <strong>of</strong> disabl<strong>in</strong>g cases<br />
for the major <strong>in</strong>dustry divisions. In 1999, the services <strong>in</strong>dustry<br />
accounted for 30.4% <strong>of</strong> Ma<strong>in</strong>eís employment <strong>and</strong><br />
Table 5. Disabl<strong>in</strong>g Cases by Major Industry Division, Ma<strong>in</strong>e, 1997-1999<br />
Major Industry Division<br />
Number<br />
Reports<br />
21.4% <strong>of</strong> the disabl<strong>in</strong>g cases. The manufactur<strong>in</strong>g <strong>in</strong>dustry<br />
accounted for 15.4% <strong>of</strong> Ma<strong>in</strong>eís employment <strong>and</strong> 21.4%<br />
<strong>of</strong> disabl<strong>in</strong>g cases.<br />
Disabl<strong>in</strong>g Cases<br />
1997 1998 1999<br />
Percent<br />
Reports<br />
Percent<br />
Emplmt<br />
Number<br />
Reports<br />
Percent<br />
Reports<br />
Percent<br />
Emplmt<br />
Number<br />
Reports<br />
Percent<br />
Reports<br />
Percent<br />
Emplmt<br />
Total 12,718 100.0 100.0 12,863 100.0 100.0 16,561 100.0 100.0<br />
*Total Public Sector 1,737 13.6 15.0 1,638 12.7 14.6 2,159 13.0 14.5<br />
Educational Services 528 4.2 óñ 572 4.4 óñ 717 4.3 óñ<br />
Public Adm<strong>in</strong>istration 354 2.8 óñ 387 3.0 óñ 449 2.7 óñ<br />
Highway Department 202 1.6 óñ 218 1.7 óñ 266 1.6 óñ<br />
*Total Private Sector 10,973 86.3 85.0 11,209 87.1 85.4 14,400 87.0 85.5<br />
70-89 Services 2,819 22.2 29.0 2,936 22.8 30.0 3,551 21.4 30.4<br />
Health Services 1,103 8.7 10.0 1,149 8.9 10.0 1,672 10.1 9.8<br />
Bus<strong>in</strong>ess Services 516 4.1 3.8 519 4.0 4.0 317 1.9 4.0<br />
Social Services 367 2.9 3.7 410 3.2 3.8 561 3.4 4.0<br />
Hotels, Room<strong>in</strong>g Houses 224 1.8 1.8 201 1.6 1.8 264 1.6 1.9<br />
20-39 Manufactur<strong>in</strong>g 2,727 21.5 16.0 2,571 20.0 16.0 3,600 21.7 15.4<br />
Transportation Service 631 5.0 2.0 577 4.5 2.0 858 5.2 2.0<br />
Lumber & Wood Prod 456 3.6 1.9 449 3.5 1.9 543 3.3 1.8<br />
Food Product 343 2.7 1.2 309 2.4 1.1 567 3.4 1.2<br />
Paper & Allied Product 282 2.2 2.7 233 1.8 2.6 281 1.7 2.4<br />
Leather & Leather Prod 174 1.4 1.4 180 1.4 1.3 234 1.4 1.1<br />
52-59 Retail Trade 2,214 17.4 21.0 2,379 18.5 21.0 2,767 16.7 20.8<br />
Eat<strong>in</strong>g & Dr<strong>in</strong>k<strong>in</strong>g Places 537 4.2 6.5 538 4.2 6.4 705 4.3 6.2<br />
Food Stores 530 4.2 3.7 567 4.4 3.9 501 3.0 3.9<br />
Automotive Dealers 238 1.9 2.4 312 2.4 2.4 439 2.7 2.4<br />
15-17 Construction 1,016 8.0 4.0 1,078 8.4 5.0 1,616 9.8 4.9<br />
Special Trades 610 4.8 2.6 602 4.7 2.7 918 5.5 2.9<br />
Build<strong>in</strong>g Construction 315 2.5 1.0 335 2.6 1.1 512 3.1 1.2<br />
50-51 Wholesale Trade 833 6.6 4.8 873 6.8 5.0 1,199 7.2 4.7<br />
Nondurable Goods 524 4.1 óñ 585 4.6 óñ 839 5.1 óñ<br />
Durable Goods 309 2.4 óñ 288 2.2 óñ 360 2.2 óñ<br />
40-49 Trans. & Public Util 833 6.6 4.3 811 6.3 4.2 995 6.0 4.2<br />
Motor Freight Transport 433 3.4 óñ 414 3.2 óñ 518 3.1 óñ<br />
01-09 Agric./Fish./Forest 266 2.1 1.2 267 2.1 1.2 306 1.9 1.2<br />
60-67 F<strong>in</strong>ance/Ins/R.Est. 254 2.0 4.0 275 2.1 4.2 274 1.7 4.3<br />
Other & Unknown SIC 11 0.0 0.1 19 0.1 0.1 92 0.5 0.6<br />
*Unknown Ownership 8 0.1 óñ 16 0.1 óñ 2 0.0 óñ<br />
* L<strong>in</strong>es add up to total. The 2-digit SIC groups <strong>in</strong> bold add up to Total Private Sector. Subgroups listed are those<br />
with highest disabl<strong>in</strong>g <strong>in</strong>juries; they are not all-<strong>in</strong>clusive <strong>and</strong> do not add up to the group total.<br />
Source: Employment from Department <strong>of</strong> Labor, Labor Market Information Services.<br />
_________________________________________________________________________________________<br />
Ma<strong>in</strong>e Department <strong>of</strong> Labor 11<br />
Bureau <strong>of</strong> Labor St<strong>and</strong>ards