Characteristics of Work-Related Injuries and Illnesses in ... - Maine.gov
Characteristics of Work-Related Injuries and Illnesses in ... - Maine.gov
Characteristics of Work-Related Injuries and Illnesses in ... - Maine.gov

Create successful ePaper yourself
Turn your PDF publications into a flip-book with our unique Google optimized e-Paper software.
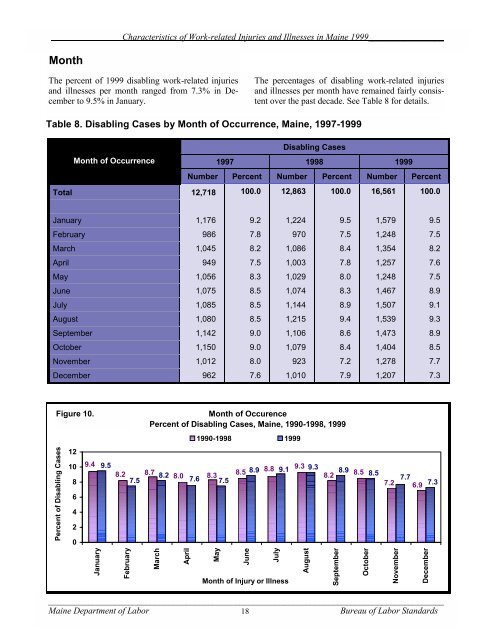
Month<br />
<strong>Characteristics</strong> <strong>of</strong> <strong>Work</strong>-related <strong>Injuries</strong> <strong>and</strong> <strong>Illnesses</strong> <strong>in</strong> Ma<strong>in</strong>e 1999_________________<br />
The percent <strong>of</strong> 1999 disabl<strong>in</strong>g work-related <strong>in</strong>juries<br />
<strong>and</strong> illnesses per month ranged from 7.3% <strong>in</strong> December<br />
to 9.5% <strong>in</strong> January.<br />
The percentages <strong>of</strong> disabl<strong>in</strong>g work-related <strong>in</strong>juries<br />
<strong>and</strong> illnesses per month have rema<strong>in</strong>ed fairly consistent<br />
over the past decade. See Table 8 for details.<br />
Table 8. Disabl<strong>in</strong>g Cases by Month <strong>of</strong> Occurrence, Ma<strong>in</strong>e, 1997-1999<br />
Month <strong>of</strong> Occurrence<br />
Disabl<strong>in</strong>g Cases<br />
1997 1998 1999<br />
Number Percent Number Percent Number Percent<br />
Total 12,718 100.0 12,863 100.0 16,561 100.0<br />
January 1,176 9.2 1,224 9.5 1,579 9.5<br />
February 986 7.8 970 7.5 1,248 7.5<br />
March 1,045 8.2 1,086 8.4 1,354 8.2<br />
April 949 7.5 1,003 7.8 1,257 7.6<br />
May 1,056 8.3 1,029 8.0 1,248 7.5<br />
June 1,075 8.5 1,074 8.3 1,467 8.9<br />
July 1,085 8.5 1,144 8.9 1,507 9.1<br />
August 1,080 8.5 1,215 9.4 1,539 9.3<br />
September 1,142 9.0 1,106 8.6 1,473 8.9<br />
October 1,150 9.0 1,079 8.4 1,404 8.5<br />
November 1,012 8.0 923 7.2 1,278 7.7<br />
December 962 7.6 1,010 7.9 1,207 7.3<br />
Figure 10.<br />
Percent <strong>of</strong> Disabl<strong>in</strong>g Cases<br />
12<br />
10<br />
8<br />
6<br />
4<br />
2<br />
0<br />
9.4 9.5<br />
January<br />
8.2<br />
February<br />
7.5<br />
Month <strong>of</strong> Occurence<br />
Percent <strong>of</strong> Disabl<strong>in</strong>g Cases, Ma<strong>in</strong>e, 1990-1998, 1999<br />
8.7<br />
March<br />
8.2<br />
8.0<br />
April<br />
1990-1998 1999<br />
7.6<br />
8.3<br />
7.5<br />
May<br />
8.8 9.3<br />
8.5 8.9 9.1 9.3<br />
June<br />
_________________________________________________________________________________________<br />
Ma<strong>in</strong>e Department <strong>of</strong> Labor 18<br />
Bureau <strong>of</strong> Labor St<strong>and</strong>ards<br />
July<br />
Month <strong>of</strong> Injury or Illness<br />
August<br />
8.2<br />
September<br />
8.9<br />
8.5<br />
October<br />
8.5<br />
7.2<br />
November<br />
7.7<br />
6.9<br />
7.3<br />
December