Characteristics of Work-Related Injuries and Illnesses in ... - Maine.gov
Characteristics of Work-Related Injuries and Illnesses in ... - Maine.gov
Characteristics of Work-Related Injuries and Illnesses in ... - Maine.gov

Create successful ePaper yourself
Turn your PDF publications into a flip-book with our unique Google optimized e-Paper software.
<strong>Characteristics</strong> <strong>of</strong> <strong>Work</strong>-related <strong>Injuries</strong> <strong>and</strong> <strong>Illnesses</strong> <strong>in</strong> Ma<strong>in</strong>e 1999_________________<br />
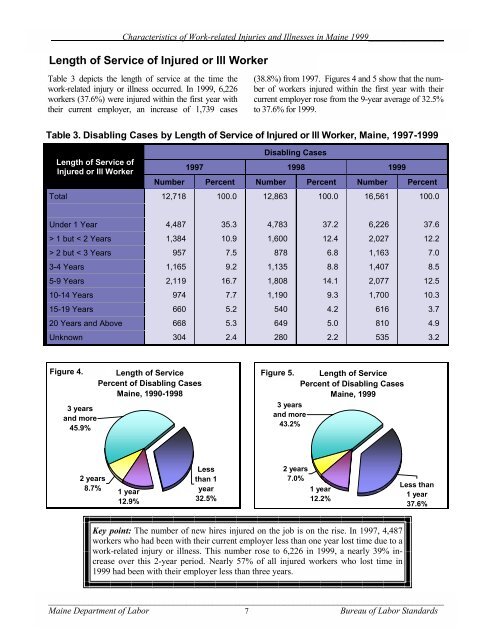
Length <strong>of</strong> Service <strong>of</strong> Injured or Ill <strong>Work</strong>er<br />
Table 3 depicts the length <strong>of</strong> service at the time the<br />
work-related <strong>in</strong>jury or illness occurred. In 1999, 6,226<br />
workers (37.6%) were <strong>in</strong>jured with<strong>in</strong> the first year with<br />
their current employer, an <strong>in</strong>crease <strong>of</strong> 1,739 cases<br />
(38.8%) from 1997. Figures 4 <strong>and</strong> 5 show that the number<br />
<strong>of</strong> workers <strong>in</strong>jured with<strong>in</strong> the first year with their<br />
current employer rose from the 9-year average <strong>of</strong> 32.5%<br />
to 37.6% for 1999.<br />
Table 3. Disabl<strong>in</strong>g Cases by Length <strong>of</strong> Service <strong>of</strong> Injured or Ill <strong>Work</strong>er, Ma<strong>in</strong>e, 1997-1999<br />
Length <strong>of</strong> Service <strong>of</strong><br />
Injured or Ill <strong>Work</strong>er<br />
Disabl<strong>in</strong>g Cases<br />
1997 1998 1999<br />
Number Percent Number Percent Number Percent<br />
Total 12,718 100.0 12,863 100.0 16,561 100.0<br />
Under 1 Year 4,487 35.3 4,783 37.2 6,226 37.6<br />
> 1 but < 2 Years 1,384 10.9 1,600 12.4 2,027 12.2<br />
> 2 but < 3 Years 957 7.5 878 6.8 1,163 7.0<br />
3-4 Years 1,165 9.2 1,135 8.8 1,407 8.5<br />
5-9 Years 2,119 16.7 1,808 14.1 2,077 12.5<br />
10-14 Years 974 7.7 1,190 9.3 1,700 10.3<br />
15-19 Years 660 5.2 540 4.2 616 3.7<br />
20 Years <strong>and</strong> Above 668 5.3 649 5.0 810 4.9<br />
Unknown 304 2.4 280 2.2 535 3.2<br />
Figure 4. Length <strong>of</strong> Service<br />
Figure 5. Length <strong>of</strong> Service<br />
Percent <strong>of</strong> Disabl<strong>in</strong>g Cases<br />
Percent <strong>of</strong> Disabl<strong>in</strong>g Cases<br />
Ma<strong>in</strong>e, 1990-1998<br />
Ma<strong>in</strong>e, 1999<br />
3 years<br />
<strong>and</strong> more<br />
45.9%<br />
2 years<br />
8.7%<br />
1 year<br />
12.9%<br />
Less<br />
than 1<br />
year<br />
32.5%<br />
3 years<br />
<strong>and</strong> more<br />
43.2%<br />
2 years<br />
7.0%<br />
1 year<br />
12.2%<br />
Key po<strong>in</strong>t: The number <strong>of</strong> new hires <strong>in</strong>jured on the job is on the rise. In 1997, 4,487<br />
workers who had been with their current employer less than one year lost time due to a<br />
work-related <strong>in</strong>jury or illness. This number rose to 6,226 <strong>in</strong> 1999, a nearly 39% <strong>in</strong>crease<br />
over this 2-year period. Nearly 57% <strong>of</strong> all <strong>in</strong>jured workers who lost time <strong>in</strong><br />
1999 had been with their employer less than three years.<br />
Less than<br />
1 year<br />
37.6%<br />
_________________________________________________________________________________________<br />
Ma<strong>in</strong>e Department <strong>of</strong> Labor 7<br />
Bureau <strong>of</strong> Labor St<strong>and</strong>ards