2012 City of Prince George Annual Report
2012 City of Prince George Annual Report
2012 City of Prince George Annual Report

Create successful ePaper yourself
Turn your PDF publications into a flip-book with our unique Google optimized e-Paper software.
CITY OF PRINCE GEORGE <strong>2012</strong> ANNUAL MUNICIPAL REPORT<br />
CITY OF<br />
PRINCE GEORGE<br />
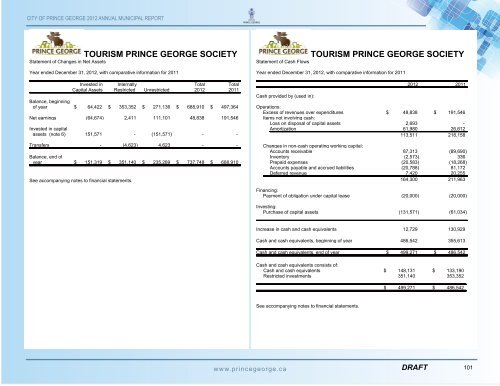
TOURISM PRINCE GEORGE SOCIETY<br />
Statement <strong>of</strong> Changes in Net Assets<br />
Year ended December 31, <strong>2012</strong>, with comparative information for 2011<br />
Invested in<br />
Capital Assets<br />
Internally<br />
Restricted<br />
Unrestricted<br />
Total<br />
<strong>2012</strong><br />
Total<br />
2011<br />
Balance, beginning<br />
<strong>of</strong> year $ 64,422 $ 353,352 $ 271,136 $ 688,910 $ 497,364<br />
Net earnings (64,674) 2,411 111,101 48,838 191,546<br />
Invested in capital<br />
assets (note 6) 151,571 - (151,571) - -<br />
Transfers - (4,623) 4,623 - -<br />
Balance, end <strong>of</strong><br />
year $ 151,319 $ 351,140 $ 235,289 $ 737,748 $ 688,910<br />
See accompanying notes to financial statements.<br />
TOURISM PRINCE GEORGE SOCIETY<br />
Statement <strong>of</strong> Cash Flows<br />
Year ended December 31, <strong>2012</strong>, with comparative information for 2011<br />
Cash provided by (used in):<br />
<strong>2012</strong> 2011<br />
Operations:<br />
Excess <strong>of</strong> revenues over expenditures $ 48,838 $ 191,546<br />
Items not involving cash:<br />
Loss on disposal <strong>of</strong> capital assets 2,693 -<br />
Amortization 61,980 26,612<br />
113,511 218,158<br />
Changes in non-cash operating working capital:<br />
Accounts receivable 87,313 (89,690)<br />
Inventory (2,573) 336<br />
Prepaid expenses (20,583) (18,268)<br />
Accounts payable and accrued liabilities (20,788) 81,172<br />
Deferred revenue 7,420 20,255<br />
164,300 211,963<br />
Financing:<br />
Payment <strong>of</strong> obligation under capital lease (20,000) (20,000)<br />
Investing:<br />
Purchase <strong>of</strong> capital assets (131,571) (61,034)<br />
Increase in cash and cash equivalents 12,729 130,929<br />
Cash and cash equivalents, beginning <strong>of</strong> year 486,542 355,613<br />
Cash and cash equivalents, end <strong>of</strong> year $ 499,271 $ 486,542<br />
Cash and cash equivalents consists <strong>of</strong>:<br />
Cash and cash equivalents $ 148,131 $ 133,190<br />
Restricted investments 351,140 353,352<br />
$ 499,271 $ 486,542<br />
See accompanying notes to financial statements.<br />
3<br />
4<br />
www.princegeorge.ca<br />
DRAFT 101