

wEyG1
wEyG1
wEyG1

You also want an ePaper? Increase the reach of your titles
YUMPU automatically turns print PDFs into web optimized ePapers that Google loves.
SECTION A<br />
USE OF THE HAGUE SYSTEM<br />
A.2.2 Designs contained in<br />
international registrations<br />
The Hague System allows a single international registration<br />
to include up to 100 different designs, provided<br />
they relate to products of the same class listed in the<br />
Locarno Classification. Focusing on the number of designs<br />
contained in international registrations provides a<br />
more accurate depiction of the volume of registrations<br />
based on the Hague System.<br />
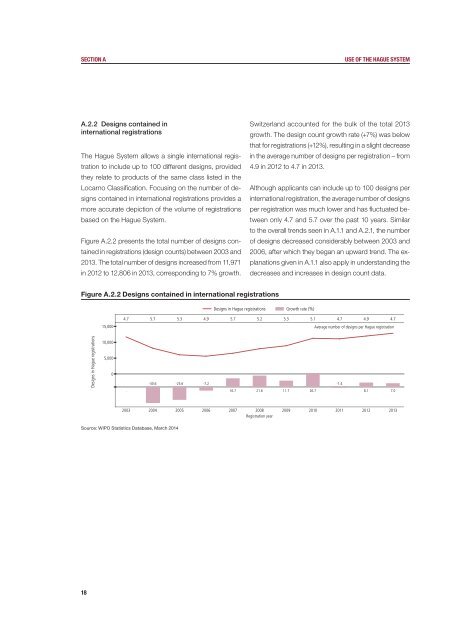
Figure A.2.2 presents the total number of designs contained<br />
in registrations (design counts) between 2003 and<br />
2013. The total number of designs increased from 11,971<br />
in 2012 to 12,806 in 2013, corresponding to 7% growth.<br />
Switzerland accounted for the bulk of the total 2013<br />
growth. The design count growth rate (+7%) was below<br />
that for registrations (+12%), resulting in a slight decrease<br />
in the average number of designs per registration – from<br />
4.9 in 2012 to 4.7 in 2013.<br />
Although applicants can include up to 100 designs per<br />
international registration, the average number of designs<br />
per registration was much lower and has fluctuated between<br />
only 4.7 and 5.7 over the past 10 years. Similar<br />
to the overall trends seen in A.1.1 and A.2.1, the number<br />
of designs decreased considerably between 2003 and<br />
2006, after which they began an upward trend. The explanations<br />
given in A.1.1 also apply in understanding the<br />
decreases and increases in design count data.<br />
Figure A.2.2 Designs contained in international registrations<br />
Designs in Hague registrations Growth rate (%)<br />
15,000<br />
4.7 5.7 5.3 4.9 5.7 5.2 5.3 5.1 4.7 4.9 4.7<br />
Average number of designs per Hague registration<br />
Designs in Hague registrations<br />
10,000<br />
5,000<br />
0<br />
-30.6 -25.6 -7.2<br />
-1.4<br />
.<br />
16.7 21.6 11.7 26.7<br />
8.1 7.0<br />
2003 2004 2005 2006 2007 2008 2009 2010 2011 2012 2013<br />
Registration year<br />
Source: WIPO Statistics Database, March 2014<br />
18