

wEyG1
wEyG1
wEyG1

Create successful ePaper yourself
Turn your PDF publications into a flip-book with our unique Google optimized e-Paper software.
SECTION B<br />
ADMINISTRATIVE PROCEDURES, REVENUE AND FEES<br />
Table B.2.2 Fees distributed to Hague members<br />
by the International Bureau: top 20 members<br />
Hague member<br />
Fees (Swiss francs)<br />
2013 Share<br />
(%)<br />
2011 2012 2013<br />
European Union 722,454 603,032 784,420 30.5<br />
Switzerland 268,733 308,172 317,256 12.3<br />
Ukraine 80,081 89,128 99,579 3.9<br />
Norway 62,520 73,735 95,220 3.7<br />
Serbia 76,673 105,228 87,119 3.4<br />
Kyrgyzstan 66,444 52,133 83,973 3.3<br />
Turkey 54,942 60,115 75,397 2.9<br />
Georgia 55,516 63,624 67,982 2.6<br />
Morocco 62,646 63,072 67,088 2.6<br />
Republic of 58,220 55,776 63,018 2.5<br />
Moldova<br />
Croatia 66,206 77,859 61,758 2.4<br />
Germany 74,399 80,844 55,444 2.2<br />
France 57,610 64,183 42,545 1.7<br />
Singapore 33,121 34,536 42,066 1.6<br />
Benelux 58,027 62,588 39,380 1.5<br />
Monaco 35,154 37,365 38,335 1.5<br />
Italy 57,683 60,700 38,257 1.5<br />
Liechtenstein 30,562 35,757 36,875 1.4<br />
Montenegro 24,556 28,945 34,337 1.3<br />
T F Y R<br />
25,075 30,436 32,751 1.3<br />
Macedonia<br />
Others 357,470 407,703 406,867 15.8<br />
Total 2,328,092 2,394,931 2,569,667 100.0<br />
Source: WIPO Statistics Database, March 2014<br />
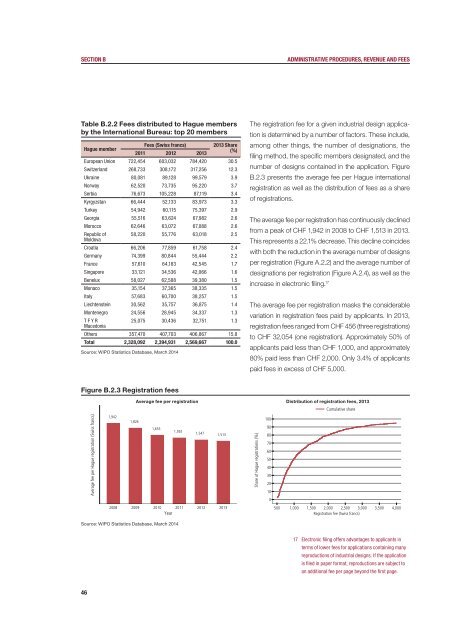
The registration fee for a given industrial design application<br />
is determined by a number of factors. These include,<br />
among other things, the number of designations, the<br />
filing method, the specific members designated, and the<br />
number of designs contained in the application. Figure<br />
B.2.3 presents the average fee per Hague international<br />
registration as well as the distribution of fees as a share<br />
of registrations.<br />
The average fee per registration has continuously declined<br />
from a peak of CHF 1,942 in 2008 to CHF 1,513 in 2013.<br />
This represents a 22.1% decrease. This decline coincides<br />
with both the reduction in the average number of designs<br />
per registration (Figure A.2.2) and the average number of<br />
designations per registration (Figure A.2.4), as well as the<br />
increase in electronic filing. 17<br />
The average fee per registration masks the considerable<br />
variation in registration fees paid by applicants. In 2013,<br />
registration fees ranged from CHF 456 (three registrations)<br />
to CHF 32,054 (one registration). Approximately 50% of<br />
applicants paid less than CHF 1,000, and approximately<br />
80% paid less than CHF 2,000. Only 3.4% of applicants<br />
paid fees in excess of CHF 5,000.<br />
Figure B.2.3 Registration fees<br />
Average fee per Hague registration (Swiss francs)<br />
1,942<br />
Average fee per registration Distribution of registration fees, 2013<br />
Cumulative share<br />
1,826<br />
1,655<br />
1,592<br />
1,547 1,513<br />
2008 2009 2010 2011 2012 2013<br />
Year<br />
Share of Hague registrations (%)<br />
100<br />
90<br />
80<br />
70<br />
60<br />
50<br />
40<br />
30<br />
20<br />
10<br />
0<br />
500 1,000 1,500 2,000 2,500 3,000 3,500 4,000<br />
Registration fee (Swiss francs)<br />
Source: WIPO Statistics Database, March 2014<br />
17 Electronic filing offers advantages to applicants in<br />
terms of lower fees for applications containing many<br />
reproductions of industrial designs. If the application<br />
is filed in paper format, reproductions are subject to<br />
an additional fee per page beyond the first page.<br />
46