

wEyG1
wEyG1
wEyG1

Create successful ePaper yourself
Turn your PDF publications into a flip-book with our unique Google optimized e-Paper software.
SECTION A<br />
USE OF THE HAGUE SYSTEM<br />
A.9<br />
Hague international<br />
registrations in force<br />
Industrial designs can be maintained for up to 15 years,<br />
with the law in some countries/regions providing for longer<br />
protection. By examining the number of international<br />
registrations in force (i.e., active registrations), one can<br />
better understand the volume of industrial designs that<br />
currently benefit from protection.<br />
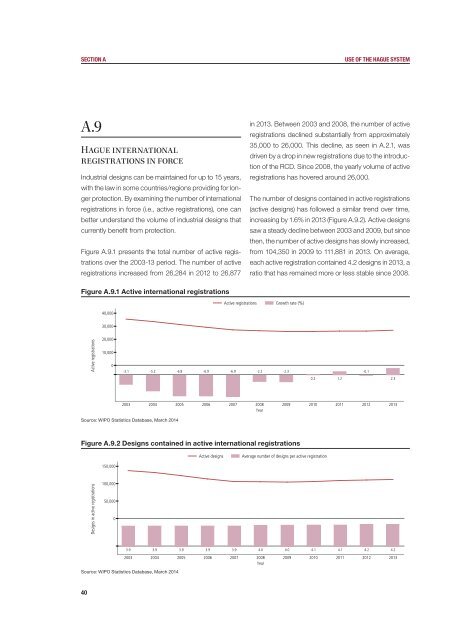
Figure A.9.1 presents the total number of active registrations<br />
over the 2003-13 period. The number of active<br />
registrations increased from 26,284 in 2012 to 26,877<br />
in 2013. Between 2003 and 2008, the number of active<br />
registrations declined substantially from approximately<br />
35,000 to 26,000. This decline, as seen in A.2.1, was<br />
driven by a drop in new registrations due to the introduction<br />
of the RCD. Since 2008, the yearly volume of active<br />
registrations has hovered around 26,000.<br />
The number of designs contained in active registrations<br />
(active designs) has followed a similar trend over time,<br />
increasing by 1.6% in 2013 (Figure A.9.2). Active designs<br />
saw a steady decline between 2003 and 2009, but since<br />
then, the number of active designs has slowly increased,<br />
from 104,350 in 2009 to 111,881 in 2013. On average,<br />
each active registration contained 4.2 designs in 2013, a<br />
ratio that has remained more or less stable since 2008.<br />
Figure A.9.1 Active international registrations<br />
40,000<br />
Active registrations Growth rate (%)<br />
30,000<br />
Active registrations<br />
20,000<br />
10,000<br />
0<br />
-3.1 -5.2 -6.8 -6.9 -6.9 -2.2 -2.3<br />
-0.1<br />
0.2 1.2<br />
2.3<br />
2003 2004 2005 2006 2007 2008 2009 2010 2011 2012 2013<br />
Year<br />
Source: WIPO Statistics Database, March 2014<br />
Figure A.9.2 Designs contained in active international registrations<br />
Active designs<br />
Average number of designs per active registration<br />
150,000<br />
Designs in active registrations<br />
100,000<br />
50,000<br />
0<br />
3.9 3.9 3.9 3.9 3.9 4.0 4.0 4.1 4.1 4.2 4.2<br />
2003 2004 2005 2006 2007 2008 2009 2010 2011 2012 2013<br />
Year<br />
Source: WIPO Statistics Database, March 2014<br />
40