(Blue Diamond Road) Corridor Study - Regional Transportation ...
(Blue Diamond Road) Corridor Study - Regional Transportation ...
(Blue Diamond Road) Corridor Study - Regional Transportation ...

Create successful ePaper yourself
Turn your PDF publications into a flip-book with our unique Google optimized e-Paper software.
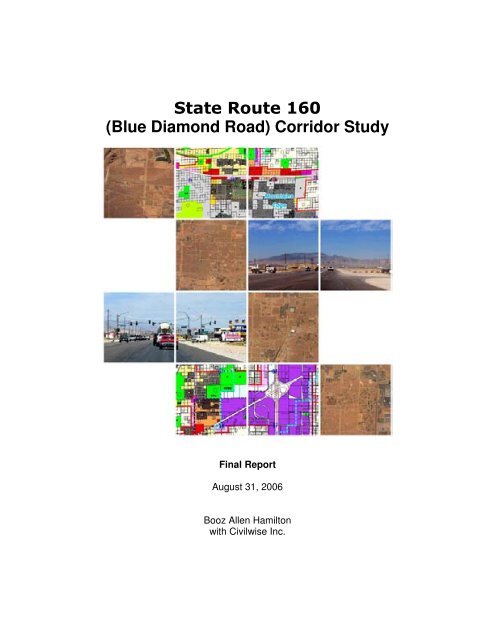
State Route 160<br />
(<strong>Blue</strong> <strong>Diamond</strong> <strong>Road</strong>) <strong>Corridor</strong> <strong>Study</strong><br />
Final Report<br />
August 31, 2006<br />
Booz Allen Hamilton<br />
with Civilwise Inc.
Table of Contents<br />
RTC SR-160 <strong>Corridor</strong> <strong>Study</strong><br />
TABLE OF CONTENTS<br />
1.0 EXECUTIVE SUMMARY ............................................................................... 1-1<br />
2.0 CURRENT CONDITIONS OF STUDY AREA ................................................... 2-1<br />
2.1 Description of SR-160 ....................................................................................2-1<br />
2.2 Geographic Boundaries ..................................................................................2-1<br />
2.3 Communities Served......................................................................................2-1<br />
2.4 Current Zoning and Community Plans ..............................................................2-3<br />
2.4.1 Clark County ......................................................................................2-3<br />
2.4.2 2004 Land Use Plan for Enterprise.........................................................2-3<br />
2.5 Current Land Use ..........................................................................................2-4<br />
2.5.1 Public Facilities Needs Assessment ........................................................2-5<br />
2.6 Future Growth ..............................................................................................2-6<br />
2.6.1 Transit-Supportive Land-Use Actions .....................................................2-7<br />
2.6.2 Recent Growth Management Activities .................................................2-13<br />
2.6.3 Potential for Future Growth ................................................................2-13<br />
2.7 <strong>Study</strong> Area Demographics ............................................................................2-14<br />
2.7.1 Population ........................................................................................2-15<br />
2.7.2 Employment .....................................................................................2-16<br />
2.8 <strong>Study</strong> Area <strong>Transportation</strong> System ................................................................2-17<br />
2.8.1 Daily Volumes...................................................................................2-18<br />
2.8.2 Congestion Index ..............................................................................2-19<br />
2.8.3 Level of Service (LOS) .......................................................................2-19<br />
2.9 Highways and Major Arterials........................................................................2-22<br />
2.9.1 Major Highways ................................................................................2-24<br />
2.9.2 Major Arterials ..................................................................................2-25<br />
2.10 Transit Services ..........................................................................................2-27<br />
2.10.1 Route Descriptions, Service Levels, and Ridership .................................2-27<br />
3.0 OVERVIEW OF TRANSIT MODES ................................................................ 3-1<br />
3.1 Conventional Bus Transit................................................................................3-1<br />
3.1.1 Overview............................................................................................3-1<br />
3.1.2 Vehicle Characteristics .........................................................................3-2<br />
3.1.3 Infrastructure Elements .......................................................................3-4<br />
3.1.4 Service Characteristics.........................................................................3-5<br />
3.1.5 Costs .................................................................................................3-5<br />
i
Table of Contents<br />
RTC SR-160 <strong>Corridor</strong> <strong>Study</strong><br />
3.2 Bus Rapid Transit ..........................................................................................3-6<br />
3.2.1 Overview............................................................................................3-6<br />
3.2.2 Vehicle Characteristics .........................................................................3-7<br />
3.2.3 Infrastructure Elements .......................................................................3-8<br />
3.2.4 Service Characteristics.......................................................................3-10<br />
3.2.5 Costs ...............................................................................................3-10<br />
3.3 Light Rail Transit / Diesel Multiple Unit Transit ................................................3-12<br />
3.3.1 Overview..........................................................................................3-12<br />
3.3.2 Vehicle Characteristics .......................................................................3-13<br />
3.3.3 Infrastructure Elements .....................................................................3-14<br />
3.3.4 Service Characteristics.......................................................................3-15<br />
3.3.5 Capital Costs ....................................................................................3-15<br />
4.0 EVALUATION METHODOLOGY .................................................................... 4-1<br />
4.1 Factors Guiding Transit Expansion ...................................................................4-1<br />
4.2 Screening Methodology ..................................................................................4-3<br />
5.0 ALTERNATIVE DEVELOPMENT.................................................................... 5-1<br />
5.1 Radial and Cross Town Alignments ..................................................................5-1<br />
5.2 Physical Characteristics of Specific Alignments ..................................................5-2<br />
5.2.1 Radial Alignments ...............................................................................5-3<br />
5.2.2 Cross-Town Alignments........................................................................5-8<br />
5.3 Modal Options.............................................................................................5-10<br />
5.3.1 Light Rail/DMU..................................................................................5-11<br />
5.3.2 Bus Rapid Transit (BRT) .....................................................................5-12<br />
5.3.3 Conventional Bus Transit....................................................................5-12<br />
5.4 Alternative Refinement ................................................................................5-13<br />
6.0 SR-160 CORRIDOR IMPROVEMENT PLAN .................................................. 6-1<br />
6.1 Current conditions and SR-160 expansion project..............................................6-1<br />
6.2 Future Highway Lane Configuration .................................................................6-3<br />
6.3 Signaled Intersection Configuration .................................................................6-3<br />
6.4 Optimizing movement of transit vehicles ..........................................................6-4<br />
6.4.1 Queue-Jumping Intersections ...............................................................6-4<br />
6.4.2 Left Turn Lanes...................................................................................6-6<br />
6.4.3 Bus Signal Priority...............................................................................6-7<br />
6.5 Congestion Management Strategies.................................................................6-8<br />
6.5.1 <strong>Transportation</strong> System Management......................................................6-8<br />
6.5.2 Future <strong>Road</strong>way System Performance ....................................................6-8<br />
ii
Table of Contents<br />
RTC SR-160 <strong>Corridor</strong> <strong>Study</strong><br />
6.6 Representative Intersection Diagram ...............................................................6-9<br />
6.7 Union Pacific Railroad Right-of-Way ...............................................................6-11<br />
6.7.1 Overview..........................................................................................6-11<br />
6.7.2 Analysis by Segment .........................................................................6-12<br />
6.7.3 Conclusions ......................................................................................6-15<br />
7.0 PROPOSED PARK AND RIDE FACILITIES ................................................... 7-1<br />
7.1 Park & Ride Site and Design Criteria ................................................................7-1<br />
7.1.1 Location .............................................................................................7-1<br />
7.1.2 Configuration......................................................................................7-1<br />
7.1.3 Other Factors......................................................................................7-2<br />
7.2 Candidate Park & Ride Sites ...........................................................................7-2<br />
7.3 Recommended Park & Ride Sites.....................................................................7-4<br />
7.3.1 SR-160 east of S. Hualapai Way............................................................7-6<br />
7.3.2 SR-160 west of S. Durango Drive ........................................................7-11<br />
7.3.3 SR-160 between Rainbow and Torrey Pines ..........................................7-15<br />
7.4 Land Acquisition Options ..............................................................................7-19<br />
7.5 Bus Stops...................................................................................................7-20<br />
7.5.1 SR-160 at S. Buffalo Drive .................................................................7-21<br />
7.5.2 SR-160 at Arville Street .....................................................................7-21<br />
7.5.3 S. Decatur Boulevard near W. Robindale <strong>Road</strong> and W. Windmill Lane.......7-22<br />
8.0 COST ESTIMATES FOR TRANSIT ALTERNATIVES........................................ 8-1<br />
8.1 Capital Cost Estimates ...................................................................................8-1<br />
8.1.1 Overview of Capital Cost Benchmarks ....................................................8-1<br />
8.1.2 Alternative 1 –High Growth ..................................................................8-3<br />
8.1.3 Alternative 2 – Moderate Growth...........................................................8-5<br />
8.1.4 Summary/Conclusions .........................................................................8-6<br />
8.2 Operating Cost Estimates ...............................................................................8-7<br />
8.2.1 Estimation Methodology .......................................................................8-7<br />
8.2.2 Alternative 1 – High Growth .................................................................8-8<br />
8.2.3 Alternative 2 – moderate growth.........................................................8-10<br />
8.2.4 Summary/Conclusions .......................................................................8-11<br />
APPENDIX A Aerial Photographs of <strong>Blue</strong> <strong>Diamond</strong> <strong>Corridor</strong> ............................ A-1<br />
APPENDIX B Candidate Park & Ride Site Data ................................................ B-1<br />
APPENDIX C SR-160 Major Intersections ....................................................... C-1<br />
APPENDIX D RTC Policies and Procedures ...................................................... D-1<br />
iii
Table of Contents<br />
RTC SR-160 <strong>Corridor</strong> <strong>Study</strong><br />
LIST OF EXHIBITS<br />
EXHIBIT 2-1: Map of Clark County’s Comprehensive Land Use Plan ..............................2-2<br />
EXHIBIT 2-2: Percentage of Land Use in Enterprise by Type ........................................2-4<br />
EXHIBIT 2-3: 2003 LAND USE .................................................................................2-5<br />
EXHIBIT 2-4: FUTURE LAND USE 2005 – 2030...........................................................2-6<br />
EXHIBIT 2-5: Major Projects in SR-160 Area..............................................................2-7<br />
EXHIBIT 2-6: Mixed Use Overlay District .................................................................2-12<br />
EXHIBIT 2-7: Enterprise Annual Population and Growth Rates 1990-2003 ...................2-15<br />
EXHIBIT 2-8: 2025 Employment Density.................................................................2-16<br />
EXHIBIT 2-9: SR-160 East at Jones Blvd .................................................................2-17<br />
EXHIBIT 2-10: SR-160 at Decatur Blvd ...................................................................2-18<br />
EXHIBIT 2-11: Level of Service (LOS).....................................................................2-20<br />
EXHIBIT 2-12: Level of Service (LOS) along SR-160 .................................................2-21<br />
EXHIBIT 2-13: <strong>Road</strong>way System Classes.................................................................2-22<br />
EXHIBIT 2-14: 10-year Trend in Average Daily Traffic...............................................2-23<br />
EXHIBIT 2-15: Current and 2025 Traffic and LOS on Major Arterials ...........................2-25<br />
EXHIBIT 3-1: CAT Conventional Bus Service..............................................................3-2<br />
EXHIBIT 3-2: Conventional Bus Size and Capacity......................................................3-2<br />
EXHIBIT 3-3: Conventional Bus Transit Capital Costs..................................................3-6<br />
EXHIBIT 3-4: Body Design Types .............................................................................3-7<br />
EXHIBIT 3-5: Specialized BRT Vehicles .....................................................................3-7<br />
EXHIBIT 3-6: MAX Station at Las Vegas Blvd and Carey..............................................3-9<br />
EXHIBIT 3-7: Bus Rapid Transit (BRT) Capital Costs by Element ................................3-10<br />
EXHIBIT 3-8: Opening Dates for LRT Systems .........................................................3-12<br />
EXHIBIT 3-9: Light Rail Project Costs Over Time ($2003)...........................................3-16<br />
EXHIBIT 4-1: Carrying Capacity of Mass Transit Alternatives ........................................4-4<br />
EXHIBIT 5-1: Summary Assessment of Potential Alignments ........................................5-1<br />
EXHIBIT 5-2: Major Radial Alignments .......................................................................5-3<br />
EXHIBIT 5-3: Durango Drive Radial Alignment ............................................................5-4<br />
EXHIBIT 5-4: Rainbow Boulevard Radial Alignment .....................................................5-5<br />
EXHIBIT 5-5: Decatur Boulevard Radial Alignment ......................................................5-6<br />
EXHIBIT 5-6: Las Vegas Boulevard South Radial Alignment ..........................................5-7<br />
EXHIBIT 5-7: Major Cross-town Alignments................................................................5-8<br />
EXHIBIT 5-8: Warm Springs <strong>Road</strong> Cross-Town Alignment.............................................5-9<br />
EXHIBIT 5-9: Summary of Alignments and Modes .....................................................5-10<br />
iv
Table of Contents<br />
RTC SR-160 <strong>Corridor</strong> <strong>Study</strong><br />
EXHIBIT 5-10: Alternative 1 – High Growth (2008) ...................................................5-15<br />
EXHIBIT 5-11: Alternative 1 – High Growth (2015) ...................................................5-16<br />
EXHIBIT 5-12: Alternative 1 – High Growth (2025) ...................................................5-17<br />
EXHIBIT 5-13: Alternative 2 – High Growth (2008) ...................................................5-18<br />
EXHIBIT 5-14: Alternative 2 – Moderate Growth (2015).............................................5-19<br />
EXHIBIT 5-15: Alternative 2 – Moderate Growth (2025).............................................5-20<br />
EXHIBIT 6-1: Dedicated Bus Lanes...........................................................................6-3<br />
EXHIBIT 6-2: Signaled Intersections.........................................................................6-3<br />
EXHIBIT 6-3: Possible Right-Turn / Queue-Jump Lane Configurations ...........................6-5<br />
EXHIBIT 6-4: Right-Turn Island ...............................................................................6-6<br />
EXHIBIT 6-5: SR-160 at Arville ..............................................................................6-10<br />
EXHIBIT 6-6: Overview of <strong>Blue</strong> <strong>Diamond</strong> Right-of-Way .............................................6-11<br />
EXHIBIT 6-7: Right-of-Way from UPRR Mainline to SR-160, and Land with Structures .6-12<br />
EXHIBIT 6-8: UPRR ROW Looking NW.....................................................................6-13<br />
EXHIBIT 6-9: UPRR ROW Looking SE ......................................................................6-13<br />
EXHIBIT 6-10: Right-of-Way from Crossing of SR-160 to Durango Dr. ........................6-13<br />
EXHIBIT 6-11: Railroad Right-of-Way Within SR-160 <strong>Corridor</strong>....................................6-14<br />
EXHIBIT 6-12: Right-of-Way Between Durango Dr. and Ft. Apache Rd........................6-14<br />
EXHIBIT 6-13: Right-of-Way with Westchester Hills Behind .......................................6-15<br />
EXHIBIT 6-14: Parcel Owners along Union Pacific Right-of-Way .................................6-16<br />
EXHIBIT 7-1: Candidate Park & Ride Sites.................................................................7-3<br />
EXHIBIT 7-2: S. Hualapai Way to S. Rainbow Blvd. ....................................................7-3<br />
EXHIBIT 7-3: S. Rainbow Blvd. to I-15 .....................................................................7-4<br />
EXHIBIT 7-4: S. Hualapai Way to S. Rainbow Blvd. ....................................................7-5<br />
EXHIBIT 7-5: S. Rainbow Blvd. to I-15 .....................................................................7-5<br />
EXHIBIT 7-6: Park & Ride Site 1-1 ...........................................................................7-7<br />
EXHIBIT 7-7: Aerial Photo, with Parcels, of P&R Site 1-1 .............................................7-8<br />
EXHIBIT 7-8: P&R Site 1-1 Facing Southeast .............................................................7-8<br />
EXHIBIT 7-9: Park & Ride 1-1 Configuration ............................................................7-10<br />
EXHIBIT 7-10: Residential Density at SR-160 / Durango ...........................................7-11<br />
EXHIBIT 7-11: Park & Ride Site 1-2/2-2..................................................................7-11<br />
EXHIBIT 7-12: Aerial Photo, with Parcels, of P&R Site 1-2/2-2 ...................................7-12<br />
EXHIBIT 7-13: P&R Site 1-2 Facing West ................................................................7-12<br />
EXHIBIT 7-14: Park & Ride 1-2/2-2 Configuration ....................................................7-14<br />
EXHIBIT 7-15: Park & Ride Site 1-4........................................................................7-15<br />
EXHIBIT 7-16: Aerial Photo, with Parcels, of P&R Site 1-4 .........................................7-16<br />
EXHIBIT 7-17: P&R Site 1-4 Facing Northwest .........................................................7-16<br />
v
Table of Contents<br />
RTC SR-160 <strong>Corridor</strong> <strong>Study</strong><br />
EXHIBIT 7-18: Bus Route Through P&R Site 1-4.......................................................7-17<br />
EXHIBIT 7-19: Park & Ride 1-4 Configuration ..........................................................7-18<br />
EXHIBIT 7-20: BLM Rights-of-Way and Reservations for Park & Ride Facilities .............7-19<br />
EXHIBIT 7-21: Facing West From SR-160 at Buffalo .................................................7-21<br />
EXHIBIT 7-22: Facing North on Decatur Boulevard at Windmill Lane...........................7-22<br />
EXHIBIT 8-1: Summary of MAX Project Costs ............................................................8-2<br />
EXHIBIT 8-2: Alternative 1 – High Growth, Capital Costs.............................................8-4<br />
EXHIBIT 8-3: Alternative 2 – Moderate Growth Capital Costs .......................................8-5<br />
EXHIBIT 8-4: Hourly Marginal Costs for CAT Services .................................................8-7<br />
EXHIBIT 8-5: Segment Lengths ...............................................................................8-8<br />
EXHIBIT 8-6: Alternative 1 – Operating Costs............................................................8-9<br />
EXHIBIT 8-7: Alternative 2 – Moderate Growth Operating Costs.................................8-10<br />
EXHIBIT 8-8: Comparison of Vehicle Service Hours ..................................................8-11<br />
EXHIBIT A-1: Aerial View 1 .................................................................................... A-2<br />
EXHIBIT A-2: Aerial View 2 .................................................................................... A-3<br />
EXHIBIT A-2: Aerial View 2 .................................................................................... A-3<br />
EXHIBIT A-3: Aerial View 3 .................................................................................... A-4<br />
EXHIBIT A-4: Aerial View 4 .................................................................................... A-5<br />
EXHIBIT A-5: Aerial View 5 .................................................................................... A-6<br />
EXHIBIT A-6: Aerial View 6 .................................................................................... A-7<br />
EXHIBIT A-7: Aerial View 7 .................................................................................... A-8<br />
EXHIBIT A-8: Aerial View 8 .................................................................................... A-9<br />
EXHIBIT A-9: Aerial View 9 ...................................................................................A-10<br />
EXHIBIT A-10: Aerial View 10 ................................................................................A-11<br />
EXHIBIT A-11: Aerial View 11 ................................................................................A-12<br />
EXHIBIT A-12: Aerial View 12 ................................................................................A-13<br />
EXHIBIT A-13: Aerial View 13 ................................................................................A-14<br />
EXHIBIT A-14: Aerial View 14 ................................................................................A-15<br />
EXHIBIT A-15: Aerial View 15 ................................................................................A-16<br />
EXHIBIT B-1: Potential Park & Ride Sites That Are Owned By the Government or Long-Time<br />
Private Owners................................................................................................ B-2<br />
EXHIBIT C-1: SR-160 at Las Vegas Blvd. ................................................................. C-2<br />
EXHIBIT C-2: SR-160 at I-15.................................................................................. C-3<br />
EXHIBIT C-3: SR-160 at Industrial .......................................................................... C-4<br />
EXHIBIT C-4: SR-160 at Valley View Blvd................................................................. C-5<br />
EXHIBIT C-5: SR-160 at Arville............................................................................... C-6<br />
EXHIBIT C-6: SR-160 at Decatur............................................................................. C-7<br />
vi
Table of Contents<br />
RTC SR-160 <strong>Corridor</strong> <strong>Study</strong><br />
EXHIBIT C-7: SR-160 at Jones................................................................................ C-8<br />
EXHIBIT C-8: SR-160 at Rainbow............................................................................ C-9<br />
vii
1. Executive Summary RTC SR-160 <strong>Corridor</strong> <strong>Study</strong><br />
1.0 EXECUTIVE SUMMARY<br />
Background<br />
Nevada State Route 160 (SR-160), also known as <strong>Blue</strong> <strong>Diamond</strong> <strong>Road</strong>, traverses the<br />
Enterprise Planning District in southwest Clark County, one of the fastest growing areas in<br />
the Las Vegas region. The study area includes several major residential developments,<br />
including Mountain’s Edge, Rhodes Ranch, Westchester Hills, Pinnacle Peaks, Arlington<br />
Ranch, and Southern Highlands. Combined, these major projects will result in the addition<br />
of over 10,000 new dwelling units by 2025. With so much growth anticipated over the next<br />
two decades, Clark County is faced with the challenge of addressing the growing<br />
infrastructure gap, particularly as it relates to water, public services and transportation. In<br />
its current configuration, SR-160 is unable to accommodate the recent increase in traffic<br />
levels resulting directly from population growth in Enterprise.<br />
<strong>Blue</strong> <strong>Diamond</strong> <strong>Road</strong> (SR-160) <strong>Corridor</strong> –<br />
S. Hualapai Way to S. Las Vegas Boulevard<br />
North<br />
The <strong>Regional</strong> <strong>Transportation</strong> Commission (RTC), which is responsible for providing transit<br />
service in the greater Las Vegas area, commissioned this study to develop a transit plan for<br />
SR-160. This study area includes SR-160 from S. Las Vegas Blvd. to S. Hualapai Way, a<br />
distance of approximately 8.5 miles, in addition to major arterial approaches within this<br />
corridor segment. Growth, travel patterns, and transit recommendations were examined for<br />
the years 2008, 2015, and 2025.<br />
Current Highway Configuration<br />
SR-160 is currently a two-lane road throughout the study corridor, with extra lanes at<br />
several major intersections. Several intersections along SR-160 are signalized, with an atgrade<br />
crossing at the Union Pacific Railroad (UPRR) mainline track. In 2004, NDOT<br />
developed a major corridor improvement plan that widens SR-160 through most of the<br />
study area, with several capacity improvements:<br />
<br />
A divided highway with turn lanes and signaling at all major intersections,<br />
1-1
1. Executive Summary RTC SR-160 <strong>Corridor</strong> <strong>Study</strong><br />
<br />
<br />
<br />
Eight lanes (four in each direction) from S. Las Vegas Blvd. to S. Rainbow Blvd.,<br />
Six lanes from S. Rainbow Blvd. to S. Durango Dr.,<br />
A new bridge and alignment over I-15 and connection to S. Las Vegas Blvd. at<br />
Windmill, and<br />
– A grade separation over the UPRR mainline.<br />
In the future, it is anticipated that additional widening will occur on the western end of the<br />
corridor. The highway right-of-way is 150 feet wide from I-15 to Decatur, and 200 feet<br />
wide west of Decatur Boulevard.<br />
Transit Technologies<br />
Both bus and rail technologies were studied for their suitability in the SR-160 study area.<br />
The major factors for determining the viability of each technology are as follows:<br />
Mode Infrastructure Requirements Ridership Implementation Issues<br />
Conventional<br />
Bus Transit<br />
Bus Rapid<br />
Transit (BRT)<br />
Light Rail /<br />
Diesel<br />
Multiple Unit<br />
(DMU)<br />
<strong>Road</strong>way with pedestrianaccessible<br />
stop location; bus<br />
stop signs with route info<br />
Protective bus shelters for<br />
high-volume stops<br />
Mixed traffic streets,<br />
dedicated/reserved lanes or<br />
grade-separated transitways<br />
Stations with shelters<br />
integrated into<br />
medians/sideways; ticket<br />
machines<br />
Trackway, vehicles, stations<br />
Storage yards<br />
Fixed equipment<br />
30,000 to<br />
100,000<br />
passengers<br />
per month<br />
4,000 to<br />
40,000<br />
passengers<br />
per day<br />
10,000 to<br />
90,000<br />
passengers<br />
per day<br />
CAT does not currently operate<br />
local routes in study area (no<br />
limited stop routes in study area)<br />
Crosstown service – local or<br />
limited stop<br />
Station spacing (3/4 to 1 mile<br />
apart)<br />
Stations should include shelters,<br />
Ticket Vending Machines (TVMs),<br />
seating and schedule information<br />
14-inch high platforms for level<br />
boarding<br />
Light Rail or DMU<br />
Securing ROW<br />
Station design<br />
Access to employment centers<br />
Rail alternatives were not studied in depth for three primary reasons.<br />
<br />
<br />
<br />
The anticipated ridership levels were insufficient to justify light rail or DMU<br />
technology.<br />
The narrow configuration of SR-160 east of Decatur Blvd. would have required use of<br />
a different corridor (such as the former UPRR SR-160 branch line).<br />
The UPRR stated that their mainline right-of-way was at capacity and would not be<br />
available for passenger rail service.<br />
Evaluation Methodology<br />
When assessing the applicability of potential transit investments to specific corridor<br />
segments and developing route structure alternatives, planners consider both potential<br />
transit demand and the physical characteristics of the corridor. In developing new transit<br />
services, the basic route network structure is typically influenced by the spatial distribution<br />
1-2
1. Executive Summary RTC SR-160 <strong>Corridor</strong> <strong>Study</strong><br />
of trip generators and attractors, and the movement of these trips throughout the<br />
transportation network. Service levels – defined by peak and non-peak frequencies, span of<br />
service, and total vehicle service hours – for these new routes should correspond with<br />
observable transit demand. These criteria are applied to the SR-160 study area to develop<br />
and evaluate transit alternatives.<br />
Variables that capture transit demand are:<br />
<br />
<br />
<br />
<br />
Type and intensity of existing transit service,<br />
Existing transit ridership on services operating along the alignment,<br />
Traffic volumes and levels of congestion, and<br />
Number and type of activity centers.<br />
Variables that represent the physical characteristics of the alignment are:<br />
<br />
<br />
Right-of-way availability, and<br />
Pedestrian accessibility.<br />
Transit Alternatives<br />
In addition to SR-160<br />
itself, the study<br />
evaluates two potential<br />
east/west corridors<br />
(all of which are<br />
shown in blue to the<br />
right) and five north/<br />
south corridors (in<br />
red) for transit use.<br />
These connect with<br />
CC-215 to the north<br />
and S. Las Vegas<br />
Blvd. to the east, and<br />
provide transit<br />
service to the major<br />
residential and employment areas.<br />
Based on the analysis of travel patterns and anticipated transit ridership potential, the study<br />
team developed two sets of transit alignments for 2008, 2015, and 2025. The proposed<br />
2025 bus routes for high growth and medium growth scenarios are shown in the two<br />
exhibits below. The different colors represent different bus services:<br />
<br />
<br />
<br />
<strong>Blue</strong>: Bus Rapid Transit<br />
Green: Express<br />
Other: Local<br />
1-3
1. Executive Summary RTC SR-160 <strong>Corridor</strong> <strong>Study</strong><br />
Buses would operate on 15-30 minute headways, depending on route and time of day. The<br />
routes would be integrated into the RTC’s existing route network.<br />
2025 High Growth 2025 Medium Growth<br />
Transit-Supportive Highway Features<br />
The study also investigates the feasibility of transit-supportive treatments along SR-160<br />
such as bus-only lanes. In addition to bus-only lanes, it may be feasible to implement<br />
priority passage through signalized intersections, using a so-called “queue-jumping”<br />
technique whereby buses avoid queues of automobiles at intersections via either a<br />
dedicated lane or shared use of a right-turn lane. Once the bus reaches the “head of the<br />
queue,” the signal system “sees” the bus and gives it a green signal prior to the signal for<br />
automobiles, allowing the bus to proceed through the intersection first. Even without a<br />
queue-jumping lane, signal systems can be programmed to recognize an approaching bus<br />
and provide a green signal in that direction.<br />
SR-160 Park & Ride Plan<br />
The study initially evaluated fourteen potential Park & Ride sites, based on specific selection<br />
criteria. These sites were land parcels along the corridor that were possibly available<br />
because they either belong to the government or have not been recently sold for<br />
development purposes. A further filtering revealed three primary sites along SR-160 that<br />
meet the selection criteria and are the best spaced and positioned:<br />
<br />
<br />
<br />
Hualapai Way (the extreme west end of the study corridor),<br />
Durango <strong>Road</strong>. (near Mountain’s Edge, Arlington Ranch, and Pinnacle Peaks), and<br />
Torrey Pines (at the east end of Mountain’s Edge).<br />
1-4
1. Executive Summary RTC SR-160 <strong>Corridor</strong> <strong>Study</strong><br />
Each of the proposed sites would contain parking for up to several hundred cars, a kiss-andride<br />
area, bike lockers, lighting, and patron amenities. They could be ideal sites for joint<br />
development, in conjunction with retail and housing. No Park & Ride sites have been<br />
recommended on the corridor east of Jones, because of lower housing densities and more<br />
commercial facilities. On-street bus stops are also recommended along the corridor, with<br />
parking available at commercial sites.<br />
Costs<br />
The costs to construct and operate transit service along SR-160 vary greatly depending<br />
primarily on the cost to obtain the land for Park & Ride facilities, which could vary from $0<br />
to $28 million, as well as on the ultimate amount of growth, which drives the level of transit<br />
service provided.<br />
Costs in 2006 $ 2008 2015 2025<br />
Capital Costs<br />
High Growth $28,600 - $6,643,600<br />
$35,012,250 -<br />
$35,043,800 -<br />
$70,896,200<br />
$74,014,000<br />
Moderate Growth<br />
$8,800 –<br />
$28,600 –<br />
$35,013,000 -<br />
$4,506,300<br />
$7,525,600<br />
$71,778,200<br />
Annual Operations and Maintenance Costs<br />
High Growth $3,280,000 $4,840,000 $7,090,000<br />
Moderate Growth $2,020,000 $3,770,000 $5,310,000<br />
Land Acquisition Options<br />
The Bureau of Land Management (BLM) stated that land for Park & Ride or other necessary<br />
facilities could be obtained in three different ways:<br />
Right-of-Way (ROW): Obtaining land for P&R facilities through an ROW is the<br />
preferred method as process can begin immediately. No application, monitoring, or<br />
rental fee is required because RTC is a regional government agency<br />
<br />
The Recreation and Public Purposes Act (R&PP): Authorizes lease or sale of public<br />
land for recreational or public purposes to State and local governments and to<br />
qualified nonprofit organizations. The RTC is not eligible for purchasing land under<br />
the R&PP; however, the land could be purchased by Clark County.<br />
Direct Sales: It would be difficult for the RTC to obtain BLM land under a noncompetitive<br />
bid. Under 43 CFR 11 Part 27113-3, direct sales without competition<br />
may be utilized, when “the public interest would best be served by a direct sale.”<br />
Speedy discussion and negotiations with BLM is recommended to reserve any land that RTC<br />
wishes to use in the future.<br />
Recommendations<br />
It is recommended that the RTC undertake the following as quickly as possible:<br />
1-5
1. Executive Summary RTC SR-160 <strong>Corridor</strong> <strong>Study</strong><br />
<br />
<br />
<br />
<br />
<br />
<br />
Adopt a <strong>Blue</strong> <strong>Diamond</strong> <strong>Corridor</strong> Transit Plan, either per this report or with<br />
modifications;<br />
Incorporate the <strong>Blue</strong> <strong>Diamond</strong> <strong>Corridor</strong> Transit Plan into RTC’s overall transit<br />
planning, and seek to obtain funding to implement the Plan;<br />
Work with BLM to:<br />
– reserve access to Federally-owned land for Park & Ride facilities, and<br />
– find the most cost-effective means of acquiring rights to the land;<br />
Work with NDOT to:<br />
– incorporate prescribed transit features in the upgrade of SR-160,<br />
– ensure that future transit-supportive features on SR-160 are not precluded by<br />
the design of the highway upgrade projects, and<br />
– provide bus stops on SR-160 per existing RTC policies;<br />
Ensure that commercial developments along the corridor are required to support<br />
transit user parking at bus stops that are adjacent to their facilities;<br />
Continue to monitor growth and usage of the <strong>Blue</strong> <strong>Diamond</strong> <strong>Corridor</strong> and adjust the<br />
Transit Plan as necessary.<br />
1-6
2. Current Conditions of <strong>Study</strong> Area RTC SR-160 <strong>Corridor</strong> <strong>Study</strong><br />
2.0 CURRENT CONDITIONS OF STUDY AREA<br />
2.1 DESCRIPTION OF SR-160<br />
Between Las Vegas Boulevard South and Hualapai <strong>Road</strong>, SR-160 is an 8.5 mile two-lane<br />
limited express state road that bisects a largely rural planning district in Clark County<br />
known as Enterprise. SR-160 connects to I-15 at a major freeway interchange a mile south<br />
of the CC-215/I-15 interchange, with a connector to Las Vegas Boulevard South just east of<br />
I-15. SR-160 runs west by southwest from I-15 through a local street network with several<br />
major north-south arterials, including Durango Drive, Rainbow Blvd, Jones Blvd, Buffalo<br />
Drive and Decatur Blvd. Much of the street network between I-15 and SR-160 is<br />
incomplete, with plans in place under the County’s Major Projects program and the Capital<br />
Improvement Program (CIP) to expand major arterials to better serve the communities<br />
along the SR-160 corridor.<br />
Between the I-15 interchange and Valley View, SR-160 is a four lane limited access state<br />
highway, with two lanes in each direction. East of Valley View, SR-160 is a limited access<br />
two lane facility, with one lane in each direction. Proposed 2025 right of way (ROW) width<br />
is 200 feet. The Union Pacific Railroad intersects SR-160 just west of Jones Boulevard, and<br />
runs north by northeast through the heart of the Las Vegas Valley. Currently, there is no<br />
passenger rail service along the corridor.<br />
2.2 GEOGRAPHIC BOUNDARIES<br />
The SR-160 corridor is located in the southern part of the Las Vegas Valley, just south of<br />
the east-west segment of CC-215 (Exhibit 2-1). The corridor study area is bounded by the<br />
SR-160/I-15 interchange to the east and Hualapai <strong>Road</strong>. The area encompasses a large<br />
portion of unincorporated Clark County, with the communities of Pinnacle Peaks, Rhodes<br />
Ranch and Summerlin South to the north and Mountains Edge and Southern Highlands to<br />
the south.<br />
The purpose of the study is to develop a multimodal transportation system management<br />
strategy for SR-160 that addresses the mobility and accessibility needs of this area. The<br />
corridor study area, approximately an 8.5-mile segment, is bounded by the SR-160/I-15<br />
interchange to the east and Hualapai <strong>Road</strong> to the west.<br />
2.3 COMMUNITIES SERVED<br />
The SR-160 corridor bisects a largely rural area of unincorporated southwest Clark County<br />
experiencing tremendous residential subdivision growth. The community of Mountains Edge<br />
is located south of SR-160 in the western portion of the study area. Directly north of SR-160<br />
2-1
2. Current Conditions of <strong>Study</strong> Area RTC SR-160 <strong>Corridor</strong> <strong>Study</strong><br />
is the community of Rhodes Ranch, a large residential subdivision adjacent to Bureau of<br />
Land Management lands and undeveloped rural parcels. Further to the east are the<br />
communities of Pinnacle Peaks and Southern Highlands. The majority of the land in the<br />
study area is part of Enterprise Planning Area, Clark County’s fourth largest Planning Area<br />
behind Sunrise Manor, Spring Valley and Paradise.<br />
Clark County has developed a Comprehensive Land Use Plan that designates land use plans<br />
for specific areas, both in and out of the study area. One of the unique aspects of the plan is<br />
the establishment of Rural Neighborhood Preservation Districts throughout southwest Clark<br />
County, including seven zones along the SR-160 corridor within the study area. The<br />
residential zones within the study area range between Residential Low (up to 3.5 dwelling<br />
units per acre) to Residential High (from 8 dwelling units to 18 dwelling units per acre). In<br />
addition to residential and rural neighborhood preservation, the corridor also includes<br />
Commercial General Zones.<br />
EXHIBIT 2-1: Map of Clark County’s Comprehensive Land Use Plan<br />
Source: Clark County, Department of Comprehensive Planning<br />
2-2
2. Current Conditions of <strong>Study</strong> Area RTC SR-160 <strong>Corridor</strong> <strong>Study</strong><br />
2.4 CURRENT ZONING AND COMMUNITY PLANS<br />
The purpose of this section is to summarize the comprehensive plans from Clark County as<br />
they relate to this study area.<br />
2.4.1 Clark County<br />
State law enables Clark County to prepare a master plan “for the physical development of<br />
the city, county or region. . . .” (N.R.S. §278.150). In December 1983, the Board of County<br />
Commissioners (BCC) adopted the Clark County Comprehensive Plan, which established a<br />
policy for separate town plans. In 2004, the Clark County Department of Comprehensive<br />
Planning updated detailed land use plans for the Town of Enterprise outlining goals, policies<br />
and maps.<br />
2.4.2 2004 Land Use Plan for Enterprise<br />
The Enterprise planning area is in unincorporated Clark County and covers more than 66<br />
square miles in the southwest part of the Las Vegas Valley. The planning area is bisected<br />
by I-15 north to south and SR-160 east to west. Along with CC-215, these three highways<br />
serve as the major transportation corridors for Enterprise.<br />
One of the biggest challenges facing Clark County is the ability to provide the full range of<br />
public services and facilities to accommodate new development in largely rural and<br />
undeveloped sections of Enterprise. Goal 1 of the Enterprise Land Use Plan states:<br />
“Implement a comprehensive land use plan by promoting development that is<br />
compatible with adjacent land uses, the natural environment, and that is well<br />
integrated with an appropriate circulation system, services, and facilities.”<br />
The Enterprise Land Use Plan also emphasizes policies and plans that support mixed use<br />
development to guide the location, density, intensity and development standards for mixed<br />
use development. To support this goal, Clark County has adopted a Mixed Use Overlay<br />
District, which designates the locations where increased intensity of land use are allowed<br />
and considered conforming to the land use plan. The Mixed Use Overlay District designates<br />
the most of the SR-160 corridor for MUD 3 (Moderately Intense Suburban Form) and MUD 4<br />
(Least Intense Suburban Form), allowing for exemptions to maximum density restrictions<br />
on development within the SR-160 corridor.<br />
2-3
2. Current Conditions of <strong>Study</strong> Area RTC SR-160 <strong>Corridor</strong> <strong>Study</strong><br />
2.5 CURRENT LAND USE<br />
The Enterprise Planning Area consists of 66.5 square miles, or roughly 45,533 acres. Of the<br />
total developable land, approximately 39,384 acres, Clark County reported at about 16<br />
percent is developed.<br />
Current land use, from Clark County, is shown in Exhibit 2-2 and is summarized below. Per<br />
Clark County’s Land Use Plan, the 16.3 percent share of land use in Enterprise dedicated to<br />
Rural Neighborhood Preservation is unlikely to decrease. Enterprise today can be<br />
characterized as largely rural, with an increasing share of land devoted to medium density<br />
residential subdivisions consisting mostly of single family and multifamily housing and some<br />
supporting commercial and retail uses. As an outlying area of the Las Vegas Valley with<br />
large undeveloped parcels adjacent to BLM lands, the Enterprise Planning Area has recently<br />
been the focus of intense development.<br />
EXHIBIT 2-2: Percentage of Land Use in Enterprise by Type<br />
Source: 2004 Enterprise Land Use<br />
Plan, Clark County Department of<br />
Comprehensive Planning<br />
Figure 2-3 provides a visual depiction of 2003 land uses in the Enterprise planning area.<br />
Land uses in the SR-160 corridor fall in the following categories: single family residential,<br />
multi-family residential, industrial, mineral extraction, other commercial, public facility, and<br />
2-4
2. Current Conditions of <strong>Study</strong> Area RTC SR-160 <strong>Corridor</strong> <strong>Study</strong><br />
vacant land. Rural and estate properties on large lots (1/2 acre or greater) have developed<br />
in pockets throughout the SR-160 area and are shown by the light tan (Rural Residential).<br />
Protected by Rural Neighborhood Preservation zoning, these areas are likely to maintain<br />
their character. 1 This rural development pattern evolved amid large, privately owned,<br />
undeveloped parcels that sit vacant as future investments. Many of these privately held<br />
parcels are now being developed into large suburban residential subdivisions.<br />
EXHIBIT 2-3: 2003 LAND USE<br />
2.5.1 Public Facilities Needs Assessment<br />
In 2001, the Board of County Commissioners approved the Public Facilities Needs<br />
Assessment, which identifies several major projects in Pinnacle Peaks, Mountains Edge and<br />
Southern Highlands. The purpose of the Public Facilities Needs Assessment is to estimate<br />
the infrastructure needs required to accommodate new development and to determine the<br />
appropriate share burden for developers. Future approval of development permits will be<br />
contingent on the infrastructure needs identified through the Public Facilities Needs<br />
Assessment process.<br />
1 The white areas outlined in red in Exhibit 1-1 map indicate the areas within the SR-160 study area that have been<br />
designated as Rural Preservation Districts.<br />
2-5
2. Current Conditions of <strong>Study</strong> Area RTC SR-160 <strong>Corridor</strong> <strong>Study</strong><br />
2.6 FUTURE GROWTH<br />
There are significant developments currently in the planning phase or under consideration<br />
within and immediately adjacent to the study area, as shown on Exhibit 2-4, Future Land<br />
Use 2005 – 2030.<br />
Clark County and local developers have collaborated on the creation of integrated<br />
communities that incorporate multiple land uses, including residential, commercial, resort,<br />
industrial, public and semi-public. The Major Projects process is intended to allow for<br />
comprehensive consideration of projects and supporting infrastructure, consistent with the<br />
goals of smart growth and environmental sustainability. The following are some of the<br />
major development projects currently underway:<br />
<br />
<br />
<br />
<br />
<br />
<br />
Southern Highlands<br />
Pinnacle Peaks<br />
Mountain’s Edge<br />
Rhodes Ranch<br />
Southwest Ranch<br />
Summerlin South<br />
EXHIBIT 2-4: FUTURE LAND USE 2005 – 2030<br />
2-6
2. Current Conditions of <strong>Study</strong> Area RTC SR-160 <strong>Corridor</strong> <strong>Study</strong><br />
Exhibit 2-5 provides a summary of the Major Projects in the southwest area of Clark County.<br />
At buildout, these Major Projects will result in the conversion of 10,858 acres of<br />
undeveloped land into traditional suburban subdivisions of medium density (between 3 and<br />
18 dwelling units per acre). Of the Major Projects currently approved, Clark County has<br />
issued development permits for 21,914 dwelling units, with substantially more dwelling<br />
units likely to be approved once Clark County negotiates future development agreements<br />
relating to street and other infrastructure improvements.<br />
EXHIBIT 2-5: Major Projects in SR-160 Area<br />
2.6.1 Transit-Supportive Land-Use Actions<br />
Establishing a successful multi-modal transportation system and maximizing transit use<br />
along SR-160 will require transit-supportive land use actions along with capital<br />
transportation improvements. This section explores the nexus between transportation<br />
generally, and more specifically transit, and land use decisions as they apply to the <strong>Blue</strong><br />
<strong>Diamond</strong> study area.<br />
2-7
2. Current Conditions of <strong>Study</strong> Area RTC SR-160 <strong>Corridor</strong> <strong>Study</strong><br />
Over the past decade, transit-oriented development (TOD) has gained increasing popularity<br />
as a planning tool to promote sustainable, smart growth. Since the 1990s, an<br />
understanding of TOD has become intertwined with new urbanism, a concept emphasizing<br />
livable, environmentally sustainable communities. In Southern Nevada, consumers have<br />
expressed a growing desire for high-amenity housing in compact neighborhoods where retail<br />
services and commercial activity centers are located within walking distance, and where<br />
transit service is an option. Because RTC is introducing new mass transit systems<br />
throughout Clark County, TOD, if designed well, can create a pocket of mixed uses within<br />
walking distance of stations in a way that encourages walking and promotes transit usage.<br />
Unfortunately, successful examples of TOD are relatively few. Where they have been<br />
implemented successfully, such projects require persistent advocacy and dedicated public<br />
involvement, all based around a clear definition of TOD. Successful TOD projects share<br />
several common attributes, the most important of which is a rich mix of land uses capable<br />
of supporting the needs of the immediate neighborhood. Such mixed use developments<br />
generally go against the grain of more traditional suburban development patterns, which<br />
typically segregate land uses and impose circulation systems based exclusively around the<br />
use of the automobile. Most of the Major Projects in the Enterprise Planning District fit this<br />
general profile.<br />
Recently, Clark County Comprehensive Planning introduced land uses ordinances designed<br />
to encourage mixed use developments. The Mixed Use Overlay ordinance acknowledges the<br />
interaction between land use decisions and travel behavior and the unintended<br />
consequences of auto-centric development patterns that result in traffic problems. The<br />
purpose of this section is to identify key principles of community building designed to be<br />
more sustainable, productive, and environmentally responsible than traditional suburban<br />
communities developed over the past half century. The section concludes with an<br />
assessment of Clark County’s Mixed Use Overlay Ordinance and offers recommendations for<br />
modification to the ordinance to encourage more sustainable development patterns.<br />
In Making Smart Growth Work 2 , Porter describes six key principles of smart growth:<br />
1. Compact, multiuse development,<br />
2. Open-space conservation,<br />
3. Expanded mobility,<br />
4. Enhanced livability,<br />
5. Efficient management and expansion of infrastructure, and<br />
6. In-fill, redevelopment, and adaptive reuse in built-up areas.<br />
2 Porter, Douglas. 2002. Making Smart Growth Work. Washington: Urban Land Institute<br />
2-8
2. Current Conditions of <strong>Study</strong> Area RTC SR-160 <strong>Corridor</strong> <strong>Study</strong><br />
While there are many definitions of TOD, the underlying essence of TOD is reflected in the<br />
definition adopted by the State of California:<br />
Moderate to higher density development, located within<br />
an easy walk (approximately ½ mile) of a major transit<br />
stop, generally with a mix of residential, employment, and<br />
shopping opportunities designed for pedestrians without<br />
excluding the auto. TOD can be new construction or<br />
redevelopment of one or more buildings whose design and<br />
orientation facilitate transit use.<br />
- California Department of <strong>Transportation</strong>, 2002<br />
In several states, TOD Initiatives have been adopted at the state level to encourage local<br />
growth patterns that incorporate principles of smart growth. The state of New Jersey, for<br />
example, has adopted a statewide New Jersey Transit Village Initiative program designed to<br />
promote TOD throughout the state. Individual locations are selected as a Transit Village<br />
and receive special treatment from the state with the goal of promoting smart growth.<br />
Municipalities must apply to the Transit Village Task Force (composed of representatives<br />
from each of the state agencies) and demonstrate that planning ordinances support the<br />
principles of the Transit Village Initiative, including compact development, transit-supportive<br />
land uses, and a high-quality pedestrian environment. While Clark County has introduced<br />
some TOD concepts to its Mixed Use Overlay Ordinance, the state of Nevada has not<br />
formally commissioned a study of a Mixed Use Village Initiative program comparable to<br />
what has been approved in New Jersey.<br />
Recent research of TOD suggests that certain underlying conditions must exist for transit<br />
ridership to increase. A study of rail stations in the San Francisco Bay Area showed a strong<br />
positive link between residential density, numbers of retail and service jobs (land use<br />
diversity), and the city block patterns (urban design) with transit use. In this study, two<br />
ridership growth scenarios are presented, based on a reasonable expectation of future land<br />
use growth patterns. Alternative 1 – High Growth assumes increased developmental<br />
densities and transit-oriented, mixed use development within Clark County’s Mixed Use<br />
Overlay District. Alternative 2 – Moderate Growth assumes more limited developmental<br />
densities and mixed use developments within the Overlay District. Details for the 2030<br />
forecast ridership estimates are provided in Technical Memorandum 2.1.<br />
Clark County’s Mixed Use Overlay District<br />
In Clark County, there appear to be several locations – particularly within the downtown<br />
area – that meet the underlying conditions needed for TOD to encourage transit ridership<br />
growth. Nevertheless, Clark County, in partnership with the cities of Las Vegas and North<br />
2-9
2. Current Conditions of <strong>Study</strong> Area RTC SR-160 <strong>Corridor</strong> <strong>Study</strong><br />
Las Vegas, has recently developed land use policies – both through the Town Planning<br />
process and more innovative land use tools – that reflect many of the basic principles of<br />
smart growth. The city of Las Vegas has designated North 5 th Street as a high density,<br />
mixed use corridor focused around station catchment areas of the planning fixed guideway<br />
system.<br />
Clark County has established Ordinance 30. 48 Part J, which sets forth the basic provisions<br />
of the Mixed Use Overlay District. According to Section 30.48.700, the purpose of the Mixed<br />
Use Overlay District is to:<br />
Encourage a diversity of compatible land uses, including a<br />
mixture of residential with at least one or more of the following:<br />
commercial, office, educational, institutional, and other<br />
appropriate urban uses. The Overlay provides a mechanism to<br />
encourage new housing and innovative urban design that is less<br />
dependent on automobile transit and can be used to revitalize<br />
older commercial corridors and increase opportunities for infill<br />
housing.<br />
The Mixed Use Overlay District consists of four distinct subdistricts, as shown in the Mixed<br />
Use Overlay District map (Exhibit 2-6). Each district has specific development standards<br />
and design criteria consistent with community goals, including intensity and density<br />
considerations for the appropriate urban form. The four districts include:<br />
<br />
<br />
<br />
MUD-1 – Most intense urban form. The MUD-1 subdistrict is intended to permit a<br />
highly concentrated and intense development of mixed residential, commercial,<br />
employment, and recreational uses typical of high intensity central business districts<br />
where existing high-rise, mid-rise, and high density uses already exist. MUD-1 is<br />
characterized by a highly developed pedestrian network and access to a combination<br />
of transportation modes, such as high frequency bus service, light rail, monorail,<br />
freeway, and other rapid transit modes of transportation.<br />
MUD-2 – Most intense suburban form. The MUD-2 subdistrict is designed to be<br />
nodal, permits a highly concentrated mixture of low-rise to high-rise (up to 100 feet)<br />
residential, commercial, employment and recreational uses typical of high density<br />
suburban areas, and may be used to transition between MUD-1 and less intense land<br />
uses.<br />
MUD-3 – Moderately intense suburban form. The MUD-3 subdistrict is intended<br />
to permit a moderately concentrated mixture of low-rise and mid-rise residential,<br />
commercial, employment, and recreational uses within suburban areas and is<br />
designed for areas transitioning from higher intensity to lower intensity mixed uses.<br />
MUD-3 may also be established at freeway interchanges, the intersections of<br />
2-10
2. Current Conditions of <strong>Study</strong> Area RTC SR-160 <strong>Corridor</strong> <strong>Study</strong><br />
<br />
arterials, and along high frequency transit corridors where a higher intensity mixed<br />
use may not be appropriate due to adjoining planned land uses<br />
MUD-4 – Least intense suburban form. The MUD-4 subdistrict is intended to<br />
permit a less concentrated mixture of low-rise residential, commercial, employment,<br />
and recreational uses typical of medium to low density areas and is designed for<br />
areas transitioning from higher intensity mixed uses to suburban and single-family<br />
development. MUD-4 may also be established at the intersection of arterial streets<br />
and along transit corridors where a higher intensity mixed use may not be<br />
appropriate due to adjoining planned land uses.<br />
In addition to satisfying the MUD subdivision expectations, all proposed developments are<br />
also evaluated in terms of several additional criteria, including:<br />
<br />
<br />
<br />
Transitioning Considerations – All mixed use developments shall incorporate<br />
appropriate bulk and use transitioning measures along the development’s perimeter<br />
to achieve compatibility with existing development on adjacent properties.<br />
Pedestrian Orientation – Proposed developments are also encouraged to<br />
incorporate pedestrian orientation on the project’s overall design.<br />
Design and Development Standards – Applications for mixed use projects must<br />
meet development standards, including the residential proximity standards. Density<br />
bonuses require special use permit approval with public hearings before the<br />
Commission and the Board. The provision also includes a Mixed Use Development<br />
Incentive, which includes a list of incentives and density bonuses to encourage uses<br />
capable of producing a sustainable community and addressing community housing<br />
needs.<br />
The boundary of Clark County’s Mixed Use Overlay District includes the <strong>Blue</strong> <strong>Diamond</strong><br />
corridor along SR-160. Between Hualapai Way and Durango Drive, the Overlay District is<br />
designated MUD-3 and MUD-4, which reflect Moderately intense suburban form and Least<br />
intense suburban form, respectively. Between Durango and Rainbow Boulevard, the<br />
Overlay District is designated MUD-4, Moderately intense suburban form.<br />
2-11
2. Current Conditions of <strong>Study</strong> Area RTC SR-160 <strong>Corridor</strong> <strong>Study</strong><br />
EXHIBIT 2-6: Mixed Use Overlay District<br />
Source: Clark County, Department of Comprehensive Planning<br />
Since the introduction of<br />
the Mixed Use Overlay<br />
District ordinance, Clark<br />
County has not yet<br />
received<br />
any<br />
development<br />
applications in the <strong>Blue</strong><br />
<strong>Diamond</strong> area that<br />
exercise density<br />
allowances. Part of the<br />
problem may stem from<br />
the lack of<br />
compatibility between<br />
SR-160 – which<br />
currently functions as<br />
a high-speed limited<br />
Cities like Englewood, CO have turned to Transit-oriented<br />
Development (TOD) as a way to promote sustainable communities,<br />
curb urban sprawl, and offer viable alternatives to the automobile.<br />
Englewood’s City Hall and public center were built adjacent to a<br />
light rail line on the site of a vacant suburban mall.<br />
expressway – and the circulation requirements for a mixed use master plan, which are<br />
typically located adjacent to major thoroughfares like SR-160. The other disadvantage is the<br />
absence of a regional fixed guideway system and associated station nodes around which to<br />
2-12
2. Current Conditions of <strong>Study</strong> Area RTC SR-160 <strong>Corridor</strong> <strong>Study</strong><br />
plan compact, mixed use developments that enable alternative modes of travel beyond the<br />
automobile.<br />
Within the study area, it is recommended that Clark County consider modifying the<br />
boundaries of the Mixed Use Overlay District to cover an undeveloped portion of Enterprise<br />
that is away from SR-160, which is not a suitable spine for a mixed use master plan given<br />
high traffic volumes. Segregating through traffic via SR-160 from a mixed use development<br />
is critical in creating a balanced transportation network, and assuring the sense of livability<br />
associated with TOD communities like Englewood, CO.<br />
A more suitable area for the Mixed Use Overlay District would be a 50-80 acre site south of<br />
SR-160 that is comparable in size to Major Project developments currently underway. By<br />
master planning a mixed use district in an undeveloped parcel with no street yet in place, it<br />
is possible to superimpose a circulation system that simultaneously integrates auto, transit,<br />
bicycles, and pedestrian access without compromising traffic on existing commuter sheds<br />
like SR-160 that carry too many pass through vehicles.<br />
2.6.2 Recent Growth Management Activities<br />
At the Enterprise Town Advisory Board meeting on May 10, 2006, Town Commissioners<br />
Woodbury and Boggs-McDonald introduced Clark County Ordinance ORD-0419-06. This<br />
proposed ordinance would extend the moratorium on nonconforming zone changes on<br />
properties within the Enterprise Land Use Plan, through December 2008. The moratorium<br />
extension was approved by the Clark County Commission on June 7, 2006.<br />
The Commissioners stated that development in the Enterprise area was moving faster than<br />
the county, RTC, and NDOT could keep up. They did not expect this ordinance to solve all<br />
the challenges, but indicated it will provide “breathing room” to reassess strategies for<br />
closing the infrastructure gap for Enterprise. Several members of the public spoke after the<br />
ordinance was introduced and they were all very supportive of it, as were members of the<br />
Advisory Board.<br />
2.6.3 Potential for Future Growth<br />
Although the boundaries of this study do not extend east of I-15 or west of Hualapai Way,<br />
the analysis of the <strong>Blue</strong> <strong>Diamond</strong> study area considered plans to accommodate residential<br />
growth to east and west of SR-160. Planned residential development in west Henderson,<br />
southeast of SR-160, has accelerated efforts to construct interchanges at I-15 and Silverado<br />
Ranch Boulevard, Cactus, and Starr and to improve the interchange at St. Rose Parkway, all<br />
to the south of the study area. These projects will load additional trips onto SR-160, as<br />
there are not yet any major east-west corridors to the south.<br />
2-13
2. Current Conditions of <strong>Study</strong> Area RTC SR-160 <strong>Corridor</strong> <strong>Study</strong><br />
Large housing developments are being planned and constructed in the Pahrump area, and<br />
Clark County planning staff have heard discussion of desires to expand the southwest<br />
SNPLMA disposal (potential land sale) boundary (Rod Allison, personal communiqué, April,<br />
2006). 3<br />
2.7 STUDY AREA DEMOGRAPHICS<br />
The purpose of this study is to develop a multimode transportation improvement strategy<br />
for the SR-160 corridor that builds on the capacity improvement efforts currently underway<br />
by NDOT. There has been significant growth in this region, creating more need for a<br />
balanced transportation system that improves regional mobility and enhances accessibility<br />
to activity centers. One of the big challenges facing this subregion is the high rate of<br />
automobile ownership and the pressure to focus capacity improvements on vehicular<br />
throughput.<br />
Southwest Las Vegas has a uniquely rural character, with a diverse community of long-time<br />
absentee property owners and residents who have worked with Clark County officials to<br />
preserve a distinctly rural community. Within the last five years, however, the conversion of<br />
large undeveloped parcels into major suburban subdivisions has sparked debate about how<br />
best to manage growth and preserve the subregion’s rural character. With the influx of new<br />
residents to the area, the population in the SR-160 corridor has grown younger. The<br />
percentage of population 55 and older has decreased from 35 percent in 1996 to 24 percent<br />
in 2004. In terms of income, the population is largely middle class, with a very small<br />
population of low income households. Not surprisingly, the rate of automobile ownership<br />
per household is among the highest in the Las Vegas Valley, with the percentage of<br />
households without an automobile at less than 4 percent.<br />
As derived from the SNRPC Workgroup, the estimated 2003 population of Enterprise was<br />
62,796 and had almost doubled to 110,594 by 2008. 4 The population is anticipated to reach<br />
649,000 by the year 2025. Total employment in the study area follows a similar pattern<br />
increasing from a current estimate of 137,000 to over 280,000 by the year 2025. The next<br />
3 The Southern Nevada Public Land Management Act (SNPLMA) became law in October, 1998. It allows the Bureau<br />
of Land Management to sell public land within a specific boundary around Las Vegas, Nevada. Proceeds from those<br />
sales are then made available for certain types of projects. In November 2003, the Act was amended to direct $300<br />
million, or $37.5 million each year over the next eight years, to Lake Tahoe for implementation of the Federal<br />
Environmental Improvement Program. Projects that are funded by SNPLMA are submitted each year to the Secretary<br />
of Interior for approval. The Secretary has approved five years of funding (five rounds) since 1998.<br />
4 The Southern Nevada <strong>Regional</strong> Planning Coalition coordinates regional planning by bringing together public<br />
jurisdictions in the discussion and prioritization of issues related to conservation, open space, land use,<br />
transportation, public facilities, air quality and infill development. Member agencies include the <strong>Regional</strong><br />
<strong>Transportation</strong> Commission, the Southern Nevada Water Authority, the <strong>Regional</strong> Flood Control District, the Clark<br />
County School District, Clark County Air Quality, and the Clark County Airport Commission.<br />
2-14
2. Current Conditions of <strong>Study</strong> Area RTC SR-160 <strong>Corridor</strong> <strong>Study</strong><br />
section documents population and employment densities for the study area, both for 2004<br />
conditions and as forecasted for 2025.<br />
EXHIBIT 2-7: Enterprise Annual Population and Growth Rates 1990-2003<br />
2.7.1 Population<br />
Population density is measured in persons per square mile. This density typically varies<br />
from a low of zero persons per acre in rural areas to much higher concentrations in<br />
urbanized areas. As the population becomes denser, more and more land is used for<br />
transportation, commercial, institutional, and industrial uses as well as housing. Based on<br />
the 2004 Las Vegas Valley Long Range Transit Plan, the population density of the SR-160<br />
corridor is 381 persons per square mile, which ranks SR-160 among the least dense<br />
communities in southwest Las Vegas. With several Major Projects currently in the<br />
development phase, however, subdivision growth along the SR-160 corridor is expected to<br />
result in among the highest rates of population growth and population density in the Las<br />
Vegas Valley.<br />
The current land use variables project a population density of 1,782, more than four times<br />
the 2003 population density. Much of that population density is expected to be focused<br />
within the Major Project areas such as Mountains Edge, Rhodes Ranch, Pinnacle Peaks and<br />
Southern Highlands. With the rezoning of the area served by Durango Drive and CC-215 to<br />
allow for greater mixed use development opportunities, residential densities are likely to be<br />
higher than predicted by the current regional travel demand model. The update to the land<br />
use variables in the regional model is currently underway, and RTC Southern Nevada<br />
expects to have more robust projections of 2025 population densities by Spring 2006.<br />
2-15
2. Current Conditions of <strong>Study</strong> Area RTC SR-160 <strong>Corridor</strong> <strong>Study</strong><br />
2.7.2 Employment<br />
Employment density is measured in jobs per square mile. Current employment densities in<br />
the study area generally follow a similar pattern as the population densities, with some<br />
exceptions. Employment is presently centered on the area of the Las Vegas strip, the<br />
central portion of the corridor, and some of the northwestern area. Overall, the northern<br />
portion of the corridor, beginning at the CC-215 beltway, exhibits low concentrations of<br />
employment.<br />
In the SR-160 corridor, current employment per square mile is 235. As depicted in Exhibit<br />
2-8, employment density is expected to increase to 753 jobs per square mile in 2025, with<br />
much of the employment density clustered along CC-215 west of I-15. The expansion of the<br />
employment base along the areas near CC-215 currently zoned for commercial and<br />
industrial uses will likely induce a sustainable share of automobile trips along major northsouth<br />
arterials such as Decatur Boulevard, Rainbow Blvd and Buffalo Drive that serve the<br />
Major Project residential subdivisions throughout the <strong>Blue</strong> <strong>Diamond</strong> subregion.<br />
EXHIBIT 2-8: 2025 Employment Density<br />
2-16
2. Current Conditions of <strong>Study</strong> Area RTC SR-160 <strong>Corridor</strong> <strong>Study</strong><br />
2.8 STUDY AREA TRANSPORTATION SYSTEM<br />
This section contains both a description of the roadway and existing and planned transit<br />
systems in the SR-160 corridor, as well as a high level assessment of the performance of<br />
those transportation systems. Performance evaluation of the transportation system is<br />
accomplished through the use of three commonly accepted performance measures, which<br />
are: Daily Volumes, Congestion Index, and Level of Service (LOS). In addition, these<br />
measures are supplemented by qualitative observations of traffic patterns on SR-160.<br />
EXHIBIT 2-9: SR-160 East at Jones Blvd<br />
SR-160 experiences heavy traffic in the weekday peak period in both the westbound and<br />
eastbound directions, with the most severe traffic congestion concentrated between Valley<br />
View and Las Vegas Boulevard. Within this segment, the majority of traffic fed onto SR-160<br />
arrives from I-15, where westbound traffic bottlenecks at the Industrial <strong>Road</strong> and Valley<br />
View intersections. This segment of SR-160 is two-lanes, one in each direction. Because<br />
the storage capacity behind the Industrial and Valley View intersections is limited, traffic<br />
backs up into the I-15 onramp.<br />
South of SR-160 just west of I-15 is a casino resort, with access to the parking facility<br />
available via an unprotected left turn pocket. North of SR-160 just east of Dean Martin<br />
Drive is a major truck depot with fueling, restaurant and convenience retail services. The<br />
2-17
2. Current Conditions of <strong>Study</strong> Area RTC SR-160 <strong>Corridor</strong> <strong>Study</strong><br />
volume of truck traffic diverting from SR-160 to the truck depot creates some traffic<br />
impedances that contribute to the low level of service between the I-15 onramp and the<br />
Dean Martin Drive connector. Overall, the share of truck traffic on SR-160 is very high,<br />
which also contributes to a reduction in the carrying capacity of SR-160.<br />
West of Valley View Blvd, the level of service improves significantly. Part of the reason is<br />
that SR-160 functions much more like a limited access highway, with only two signalized<br />
intersections at Rainbow Blvd and Decatur Blvd. The remainder of the roads that connect to<br />
SR-160 are minor access roads.<br />
2.8.1 Daily Volumes<br />
The number of vehicles utilizing the transportation infrastructure represents the most basic<br />
measurement of demand. The two most common units of measure are peak hour volumes<br />
and average daily volumes. For this analysis, volume is calculated as “vehicles per day”<br />
(VPD): a count of vehicles made on a single day (not an average count over time), traveling<br />
in both directions.<br />
EXHIBIT 2-10: SR-160 at Decatur Blvd<br />
2-18
2. Current Conditions of <strong>Study</strong> Area RTC SR-160 <strong>Corridor</strong> <strong>Study</strong><br />
2.8.2 Congestion Index<br />
The noted transportation engineer, Morris J. Rothenberg, defines urban highway congestion<br />
as "a condition in which the number of vehicles attempting to use a roadway at any given<br />
time exceeds the ability of the roadway to carry the load at generally acceptable service<br />
levels.”5<br />
There are two types of congestion: recurring and non-recurring. Typically, recurring<br />
congestion occurs during the morning and afternoon rush hours as commuters travel to and<br />
from work. Nonrecurring congestion is caused by random incidents, most often disabled<br />
vehicles and accidents.<br />
Different methods are used to determine a service level for each component of a<br />
transportation network. In general, the capacity of a street is a measure of its ability to<br />
accommodate a certain volume of moving vehicles. Typically, street capacity refers to the<br />
maximum number of vehicles that a street element (e.g. an intersection) can be expected<br />
to accommodate in a given time period under the prevailing roadway and traffic conditions.<br />
On a typical county road like SR-160, lane capacities are normally in the range of 1,400 to<br />
1,600 vehicles per hour.<br />
One important deficiency related to congestion and the overall level of service provided to<br />
roadway users is the Volume to Capacity Ratio (V/C). As the volume of traffic increases,<br />
the density of vehicles increases as well as throughput, reaching a maximum flow rate when<br />
volume equals capacity (V/C ratio equal to one). Past that point conditions break down<br />
rapidly and delays increase (V/C ratio of over one).<br />
The methodology for determining congested corridors for this study was to compare the<br />
corridor's V/C ratio to a V/C ratio threshold. The impact of volume is different for different<br />
roadway types (minor arterials, major arterials, highways, freeways, etc.), so thresholds<br />
were established to account for these differences. The thresholds were determined by a<br />
technical working group of the Congestion Management System project and differ by<br />
functional class and area type types.<br />
2.8.3 Level of Service (LOS)<br />
The concept of levels of service (LOS) is well established in highway capacity analysis. LOS<br />
is a quantitative measure that compares the vehicle flow of traffic with the vehicle capacity<br />
available. The resulting volume to capacity ratio (VCR) is then classified in one of six levels<br />
of service. A LOS is an “A, B, C D, E, or F” grading system that rates the quality of<br />
5 Rothenberg, Morris J., "Urban Congestion in the United States: What Does the Future Hold", ITE Journal,<br />
Volume 55, Number 7, July 1985, pp. 22-39.<br />
2-19
2. Current Conditions of <strong>Study</strong> Area RTC SR-160 <strong>Corridor</strong> <strong>Study</strong><br />
operation on a street system. As shown in Exhibit 2-11, Level of service ranges from an<br />
“A”, the best traffic operation rating, to an “F”, the poorest. Urban roadways are typically<br />
considered satisfactory if operating at LOS D, which represents a high-density but stable<br />
flow. Small increases in traffic at this level will often cause operational problems. The<br />
relationships between vehicle volumes, density, throughput, volume to capacity ratio, and<br />
LOS are summarized below.<br />
EXHIBIT 2-11: Level of Service (LOS)<br />
LOS A LOS B LOS C<br />
LOS D LOS E LOS F<br />
LEVEL OF<br />
SERVICE<br />
MAXIMUM DENSITY<br />
(PC/MI/LN)<br />
MAX SERVICE FLOW<br />
RATE<br />
MAXIMUM<br />
VCR<br />
(PCPHPL)<br />
A 10 650 0.295 - 0.283<br />
B 16 1,040 0.473 - 0.452<br />
C 24 1,548 0.704 - 0.673<br />
D 32 1,952 0.887- 0.849<br />
E 39-43 2,200 - 2,300 1.000<br />
F Variable Variable Variable<br />
For our purposes, we will focus on LOS to determine baseline and future conditions at<br />
several locations along SR-160. 6 Based on 2003 traffic count data collected by NDOT, SR-<br />
6 LOS is a function of traffic density (passenger cars per lane-mile) and the service flow rate (passenger cars per<br />
hour per lane).<br />
2-20
2. Current Conditions of <strong>Study</strong> Area RTC SR-160 <strong>Corridor</strong> <strong>Study</strong><br />
160 experiences recurring peak hour traffic congestion, with the highest percentage of<br />
failing service occurring between I-15 and Valley View Blvd. Exhibit 2-12 summarizes the<br />
level of service (LOS) at five locations along the eastern segment of SR-160 between Valley<br />
View Blvd and Las Vegas Boulevard South. The analysis shows LOS for 2003 and<br />
projections LOS for 2023, based on 20-year traffic projections.<br />
Similar to state roads in most urban areas, SR-160 suffers from traffic congestion as it fills<br />
up with commuters traveling to and from work in the morning and afternoon rush hours. In<br />
addition, a high volume of heavy duty trucks carrying building materials to construction<br />
sites east of Valley View contributes to traffic problems. Additionally, SR-160 has become<br />
an increasingly popular travel shed for a growing share of commute trips originating from<br />
Pahrump into the heart of Las Vegas. The I-15 interchange and Las Vegas Boulevard during<br />
the peak period were at LOS D, indicating a high density of traffic and intermittent<br />
breakdowns. As mentioned previously, most of the breakdowns occur between Dean Martin<br />
Drive and Valley View Blvd, where insufficient storage capacity on the intersection<br />
approaches leads to excessive queuing. In the “no build” alternative, these intersections<br />
are projected to operate at or below LOS F or ‘traffic gridlock’ in 2023.<br />
The “build” scenario involves reconstruction of the SR-160/I-15 interchange with capacity<br />
improvements on the approaches, consistent with the Phase 2A and 2B construction designs<br />
shown in Exhibit A. Under the 2030 Build scenario, the capacity improvements planned by<br />
NDOT are projected to result in LOS ranging between C and D. With the Flyover alternative,<br />
LOS on the southbound ramp of SR-160 improves from a D to a C.<br />
EXHIBIT 2-12: Level of Service (LOS) along SR-160<br />
2003 NB 2023 NB* 2003 Build 2023 Build* 2023 Build**<br />
Las Vegas Blvd D 1 F D C C<br />
NB Ramp Terminal D 2 F C C C<br />
SB Ramp Terminal D 3 F C D C<br />
Industrial <strong>Road</strong> C 4 F C D D<br />
Valley View B 5 F B D D<br />
LOS E or worse for the following locations:<br />
* analyzed without flyer<br />
1. NB left, NB thru, SB left, EB left, WB left ** analyzed with flyover<br />
2. NB left, WB thru<br />
3. EB thru, WB left, WB thru<br />
4. NB thru, SB left, EB left, WB left<br />
5. SB left, EB left<br />
Source: Nevada Department of <strong>Transportation</strong> (NDOT)<br />
Traffic Operations Analysis Division<br />
2-21
2. Current Conditions of <strong>Study</strong> Area RTC SR-160 <strong>Corridor</strong> <strong>Study</strong><br />
2.9 HIGHWAYS AND MAJOR ARTERIALS<br />
SR-160 provides a critical link between the communities of the southwest Las Vegas Valley<br />
and major freeways that connect these communities to the rest of the Valley. One of the<br />
challenges facing SR-160 is the amount of truck movement and vehicular traffic fed onto<br />
SR-160 because the street network serving Enterprise is not completed. The current<br />
roadway network in the study area is comprised of five major arterials and an expanding<br />
number of collector streets, as shown in Exhibit 2-13. With the completion of several Major<br />
Projects in the study area, the number of collector roads between SR-160 and these new<br />
subdivisions is expanding.<br />
EXHIBIT 2-13: <strong>Road</strong>way System Classes<br />
Highways Major Arterials Collector Streets<br />
Interstate 15 Las Vegas Blvd El Capitan (planned)<br />
SR-160 Dean Martin Drive Grand Canyon (planned)<br />
Clark County 215 Decatur Blvd Fort Apache (planned)<br />
Rainbow Blvd<br />
Cimmaron <strong>Road</strong><br />
Buffalo Blvd (planned) Fort Apache <strong>Road</strong><br />
Valley View Blvd<br />
Arville Street<br />
Lindell <strong>Road</strong><br />
Arden <strong>Road</strong><br />
Quarterhorse Lane<br />
Monte Cristo Way<br />
Fort Apache <strong>Road</strong><br />
Arlington Ranch <strong>Road</strong><br />
Because of the absence of viable east-west alternatives parallel to SR-160, much of the<br />
east-west traffic through Enterprise is forced onto SR-160 through many of the collector<br />
streets and major arterials shown above. Similarly, the north-south arterial network is not<br />
completed, with major gaps on Fort Apache, Durango, Buffalo and Jones. As a result, trips<br />
destined for location northeast of State SR-160 are fed eastbound on State SR-160 and<br />
northbound on I-15.<br />
Exhibit 2-14 shows the trend in average daily traffic on several major arterials connecting to<br />
the SR-160 corridor. Overall, the upward trend in average daily traffic is a function of<br />
increased population in the Enterprise area of Clark County, where residential subdivision<br />
growth has increased dramatically over the past three years. Over a ten year period, traffic<br />
volumes have more than doubled along Decatur, Rainbow and Pahrump Valley <strong>Road</strong>. One<br />
of the big challenges facing this subregion is the ability to upgrade the transportation<br />
infrastructure to keep pace with increased traffic volumes.<br />
2-22
2. Current Conditions of <strong>Study</strong> Area RTC SR-160 <strong>Corridor</strong> <strong>Study</strong><br />
EXHIBIT 2-14: 10-year Trend in Average Daily Traffic<br />
30,000<br />
Average Daily Traffic<br />
25,000<br />
20,000<br />
15,000<br />
10,000<br />
5,000<br />
0<br />
Decatur<br />
Rainbow<br />
Pahrump Valley<br />
Rd<br />
1995<br />
1996<br />
1997<br />
1998<br />
1999<br />
2000<br />
2001<br />
2002<br />
2003<br />
2004<br />
YEAR<br />
Source: Nevada Department of <strong>Transportation</strong> (NDOT),<br />
2003 Traffic Counts for the Southern Nevada Area<br />
Major arterial streets and highways carry the largest share of through or long-distance<br />
travel. Along the SR-160 corridor, one of the biggest factors contributing to peak traffic<br />
congestion cause by heavy volumes on SR-160 is the incomplete nature of the major<br />
arterial network in the southwest Clark County area.<br />
Because of gaps in several major<br />
north-south arterials approaching SR-160, traffic that would otherwise circulate through a<br />
more integrated street network is funneled onto SR-160. Currently, there are critical gaps<br />
in several major north-south arterials, including Durango, Fort Apache, Buffalo, Jones and<br />
Valley View.<br />
substitutes to SR-160.<br />
In addition, there are no viable east-west arterials that can serve as<br />
Collector streets provide direct service to residential areas, local parks, churches, etc. To<br />
preserve the amenities of neighborhoods, they are usually spaced at about half-mile<br />
intervals to collect traffic from local access streets and convey it to major and minor arterial<br />
streets and highways. The collector streets within the SR-160 corridor provide access to SR-<br />
160 and other major arterials. Again, because of the disconnected nature of the circulation<br />
system, traffic is funneled to SR-160 with few viable alternatives.<br />
Local access streets are the smallest class of roadway and those not selected for inclusion in<br />
the arterial or collector classes. They allow access to individual homes, shops, and similar<br />
traffic destinations. Through traffic should be discouraged by using appropriate geometric<br />
2-23
2. Current Conditions of <strong>Study</strong> Area RTC SR-160 <strong>Corridor</strong> <strong>Study</strong><br />
designs and traffic control devices. Obviously, there are many local access streets within<br />
the SR-160 corridor, which can adversely impact traffic flow during peak hours with a heavy<br />
platoon of vehicles, especially in cases where there are no protected left turn storage lanes<br />
on SR-160. The street network has been planned using a grid system to ensure that the<br />
local street network flows properly into the collector and major streets and eventually into<br />
SR-160.<br />
The following sections describe the major highways, arterials and streets in the SR-160<br />
corridor study area. These roadways are described in terms of the capacity and their<br />
operating characteristics. The functional classification of streets described below for the<br />
study area includes:<br />
<br />
<br />
<br />
Major highways,<br />
Major arterials,<br />
Collector streets.<br />
This differentiation is generally based on through traffic movement and access to adjacent<br />
land. Local roads and collector roads provide greater access to adjacent land or individual<br />
properties as compared to highways or arterials, which provide greater mobility.<br />
2.9.1 Major Highways<br />
Descriptions of I-15, the Northern Beltway, and several major arterials within the SR-160<br />
study area are included in this section.<br />
Interstate 15<br />
I-15 runs along the south-eastern boundary of the SR-160 corridor study area. For the<br />
purposes of this study, the portion of I-15 that is considered part of the study area is the<br />
segment south of CC-215 and north of Wigwam Avenue. Along this stretch of the highway,<br />
there are six lanes (three in each direction), although there is a small portion of the<br />
highway at the northeast point where it meets the corridor boundary where it becomes four<br />
lanes.<br />
The 2003 average vpd volumes on this segment of I-15 are 114,500. The percentage of<br />
this segment that is congested, based on these counts, is 14 percent. Seven percent of the<br />
southern segment of I-15 operates at LOS F. Forecasts for 2025 reveal a traffic volume<br />
increase to 260,100 for the southern portion. This means that seven to 38 percent of this<br />
route will be congested in 2025 and up to 25 percent of the roadway will operate at LOS F.<br />
2-24
2. Current Conditions of <strong>Study</strong> Area RTC SR-160 <strong>Corridor</strong> <strong>Study</strong><br />
2.9.2 Major Arterials<br />
There are several major arterials in the SR-160 corridor study area that provide travel<br />
routes between activity districts. The geometric and operational characteristics of these<br />
roadways are described below. Exhibit 2-15 provides a summary of 2003 and 2025<br />
projections of daily traffic volumes and level-of-service on major arterials serving SR-160.<br />
The column entitled “% Congested” represents the percentage of the total corridor length<br />
that experiences LOS D or worse.<br />
By 2025, it is anticipated that traffic congestion along these major arterials will increase<br />
dramatically, with corresponding increases in travel times. Much of the work-related traffic<br />
funneled through these arterials will originate from the SR-160 area and be destined for<br />
employment sites along the commercial districts near CC-215. The largest increase in<br />
traffic is expected on north-south arterials serving the eastern portion of the SR-160 study<br />
area, specifically Durango Drive and Hualapai Way.<br />
EXHIBIT 2-15: Current and 2025 Traffic and LOS on Major Arterials<br />
Avg<br />
Daily<br />
Volume<br />
(2003)<br />
Avg<br />
Daily<br />
Volume<br />
(2025)<br />
%<br />
Congested<br />
(2003)<br />
%<br />
Congested<br />
(2025)<br />
%<br />
Increase<br />
in Travel<br />
Times<br />
Las Vegas Boulevard South 11,900 16,900 3% 31% 26%<br />
Valley View Blvd 16,900 31,900 18% 71% 119%<br />
Decatur Blvd 15,000 35,800 4% 53% 59%<br />
Rainbow Blvd 27,800 44,100 23% 69% 55%<br />
Buffalo Drive 21,500 36,700 15% 81% 62%<br />
South Durango Drive 7,900 31,700 4% 97% 95%<br />
Fort Apache <strong>Road</strong>/Durango 21,600 39,200 4% 53% 59%<br />
Hualapai Way 12,500 26,500 0% 85% 174%<br />
Source: 2004 Las Vegas Valley Long Range Transit Plan<br />
Las Vegas Boulevard South<br />
Las Vegas Boulevard South runs from Fremont in downtown Las Vegas south to Sloan, and<br />
includes the Las Vegas Strip. The portion of Las Vegas Boulevard South serving SR-160 is a<br />
7.3 mile segment between Sunset and St. Rose. This portion of Las Vegas Boulevard South<br />
is just south of the Las Vegas Strip corridor. Much of the eastbound traffic on SR-160 heads<br />
northbound on Las Vegas Boulevard South to the employment base along the Las Vegas<br />
Strip. From 2003 to 2025, travel times on Las Vegas Boulevard are expected to increase 26<br />
percent.<br />
2-25
2. Current Conditions of <strong>Study</strong> Area RTC SR-160 <strong>Corridor</strong> <strong>Study</strong><br />
Decatur Boulevard<br />
Decatur Boulevard is one of the Las Vegas Valley’s major north-south arterials, with<br />
connections to CC-215 and SR-160. At SR-160 and Decatur Blvd, there is a signalized<br />
intersection, with a major housing subdivision under construction at the northwest corner.<br />
South of CC-215, Decatur Blvd discontinues at Baudra, where a small access road connects<br />
to Jones Blvd to the west. From 2003 to 2025, travel times on Decatur Boulevard are<br />
expected to increase 59 percent.<br />
Rainbow Boulevard<br />
Rainbow Boulevard is an 18.1 mile north-south major arterial with a ROW width of 100 feet<br />
that runs from Ann <strong>Road</strong> in northwest Las Vegas to Starr <strong>Road</strong>. Rainbow is one of the few<br />
arterials that provides a continuous connection between SR-160 and locations in Northwest<br />
Las Vegas. South of CC-215, Rainbow serves as the western edge of the Pinnacle Peak<br />
Major Project area. The intersection at SR-160 and Rainbow is a signalized intersection.<br />
From 2003 to 2025, travel times on Rainbow Boulevard are expected to increase 55<br />
percent.<br />
Durango Drive<br />
Durango Drive is a major north-south arterial west of I-15 bisecting the Summerlin area<br />
that runs from Summerlin Parkway to State SR-160. The intersection at SR-160 and<br />
Durango was signalized in July 2006, due to increased traffic and safety concerns at that<br />
intersection. Durango Drive is under construction, is being expanded to a six-lane roadway<br />
between Windmill to Hacienda, and serves as the eastern edge of the Rhodes Ranch<br />
subdivision just north of SR-160. The expected increase in congested conditions results<br />
directly from increased trips generated to and from these major residential subdivisions.<br />
From 2003 to 2025, travel times on Durango Drive are expected to increase 95 percent.<br />
Fort Apache <strong>Road</strong><br />
Fort Apache <strong>Road</strong> is a 19.9 mile north-south major arterial segment running through the<br />
Summerlin area that terminates at SR-160. Currently, the intersection at Fort Apache and<br />
SR-160 is unsignalized, with a two-way stop north and south at Fort Apache. Fort Apache<br />
<strong>Road</strong> is currently under reconstruction, with six through lanes, left turn lanes, storm drain<br />
improvements, and traffic signals at Fort Apache/Twain and Fort Apache/Spring Mountain<br />
intersections. From 2003 to 2025, travel times on Fort Apache <strong>Road</strong> are expected to<br />
increase 59 percent.<br />
2-26
2. Current Conditions of <strong>Study</strong> Area RTC SR-160 <strong>Corridor</strong> <strong>Study</strong><br />
2.10 TRANSIT SERVICES<br />
2.10.1 Route Descriptions, Service Levels, and Ridership<br />
Public transportation in the Las Vegas Valley is provided by the Citizens Area Transit (CAT).<br />
The system consists of 49 routes served by 305 buses, carrying close to 150,000<br />
passengers everyday in the greater Las Vegas Valley. CAT provides standard fixed-route bus<br />
service to parts of southwest Las Vegas Valley. Most routes operate 5:30 a.m. to 1:30 a.m.<br />
seven days a week, while some routes operate 24 hours a day. Weekend service is usually<br />
the same, however, some headways may be extended.<br />
The Downtown <strong>Transportation</strong> Center (DTC) and the South Strip Transfer Terminal (SSTT)<br />
are major transfer points for CAT routes. The DTC is operated by the City of Las Vegas and<br />
the SSTT is operated by the RTC. For the purposes of this study, the SSTT is not within the<br />
study boundaries and will not be discussed further. The DTC will soon be replaced by the<br />
Central City Intermodal <strong>Transportation</strong> Terminal (CCITT), as previously mentioned. Routes<br />
are categorized based on route type:<br />
<br />
<br />
<br />
100-series routes operate in a north-south direction.<br />
200-series routes operate in an east-west direction.<br />
400-series routes serve as connectors and circulators.<br />
Currently, there is no transit service along the SR-160 corridor. Route 117 operates along<br />
Las Vegas Boulevard South between the South Strip Transfer Terminal and several casino<br />
and resort locations to the south.<br />
CAT service along the SR-160 corridor has not been established largely because this area of<br />
southwest Las Vegas has consisted of low-density, rural neighborhoods where the rate of<br />
automobile ownership per household is among the highest in Clark County. Additionally,<br />
the fragmented street network between SR-160 and I-215 does not allow for the extension<br />
of 100-series routes south into the SR-160 area.<br />
With several Major Projects currently underway, such as Mountains Edge, Rhodes Ranch,<br />
Pinnacle Peaks and Southern Highlands, the demand for transit services is beginning to<br />
materialize.<br />
2-27
3. Overview of Transit Modes RTC SR-160 <strong>Corridor</strong> <strong>Study</strong><br />
3.0 OVERVIEW OF TRANSIT MODES<br />
A key objective of a transit planning study is to determine the most appropriate transit<br />
mode to serve the activity centers and trip patterns of the study area. For the purposes of<br />
this study, a mode is defined here as a combination of vehicle and service design. This<br />
section articulates the characteristics of the most appropriate modes to consider for<br />
implementation in the SR-160 study area.<br />
This section discusses the modes in a systematic manner.<br />
overview of several mode characteristics, including:<br />
This discussion includes an<br />
<br />
<br />
<br />
Vehicle characteristics<br />
Infrastructure requirements, and<br />
Service and operational characteristics<br />
In all, three modes will be discussed:<br />
<br />
<br />
<br />
Conventional Bus Transit<br />
Bus Rapid Transit (BRT)<br />
Light Rail Transit/Diesel Multiple Unit (LRT/DMU)<br />
3.1 CONVENTIONAL BUS TRANSIT<br />
3.1.1 Overview<br />
Bus transit represents the basic building block of transit service in the United States. In<br />
fact, as of 2002 over 58.5 percent of all trips and 54.3 percent of all service is operated<br />
using buses. 7 Until the implementation of the MAX Bus Rapid Transit (BRT) system in<br />
2004, 100 percent of the transit service operated by Citizens Area Transit was operated with<br />
conventional bus transit on local, express, and circulator routes.<br />
7 National Transit Database, National Transit Summaries and Trends for the 2002 Report Year, Federal Transit<br />
Administration<br />
3-1
3. Overview of Transit Modes RTC SR-160 <strong>Corridor</strong> <strong>Study</strong><br />
EXHIBIT 3-1: CAT Conventional Bus Service<br />
3.1.2 Vehicle Characteristics<br />
Because buses operate on rubber tires, they can travel flexibly on many different types of<br />
right-of-way. For this reason, buses are used in a wide variety of operating contexts. This<br />
section describes various characteristics of buses.<br />
Vehicle Configuration<br />
Size<br />
Buses come in a variety of sizes and shapes, but the majority of buses operated in<br />
conventional service fall between 40 and 60 feet. The 40-foot bus is the standard length<br />
for bus transit in the United States, comprising approximately three-fourths of the vehicle<br />
purchases for fixed-route transit service. Recently, manufacturers have developed<br />
elongated versions of the standard-length bus. The 45-foot bus brings added seating and<br />
standing capacity. For services with significant demand, the 60-foot articulated buses are<br />
available. 60-foot buses feature an articulated hinge in the middle of the bus, enabling it to<br />
turn and maneuver in street traffic.<br />
EXHIBIT 3-2: Conventional Bus Size and Capacity<br />
Configuration<br />
Length<br />
(Feet)<br />
Standard 40 (12.2 m)<br />
Width<br />
(inches)<br />
96-102 in<br />
(2.5- 2.6m)<br />
# Door<br />
Channels<br />
# Seats,<br />
including seats<br />
in wheel chair<br />
tie-down areas)<br />
Maximum<br />
Capacity*<br />
(seated plus<br />
standing)<br />
2-3 35-44 50-60<br />
Double-Decker<br />
(14 ft height)<br />
30 - 40<br />
(9.1 - 12.2 m)<br />
96-102 in<br />
(2.5- 2.6m)<br />
2-3 65-74 70 - 88<br />
Extended 45 (13.8 m)<br />
96-102 in<br />
(2.45-2.6m)<br />
2-3 35-52 60-70<br />
3-2
3. Overview of Transit Modes RTC SR-160 <strong>Corridor</strong> <strong>Study</strong><br />
Configuration<br />
Length<br />
(Feet)<br />
Articulated 60 (18 m)<br />
Width<br />
(inches)<br />
98-102 in<br />
(2.5-2.6m)<br />
# Door<br />
Channels<br />
# Seats,<br />
including seats<br />
in wheel chair<br />
tie-down areas)<br />
Maximum<br />
Capacity*<br />
(seated plus<br />
standing)<br />
4-7 31-65 80-90<br />
Floor Height<br />
Traditionally, buses were built at a floor height that required passengers to climb a few<br />
steps to the floor of the vehicle. Passengers in wheelchairs were accommodated using lifts,<br />
which were cumbersome to operate and caused significant delays. In order to respond to<br />
the need for mobility-impaired groups, transit agencies have begun employing buses with<br />
low floors at the entry. Low-floor buses enable all passengers to enter the vehicle with just<br />
one short step up to the floor of the vehicle. Wheelchair passengers can board using a<br />
quick-deploying ramp. Low-floor buses are becoming the norm for bus transit in the United<br />
States, representing 64.7 percent of bus orders by transit agencies in the United States as<br />
of 2001.<br />
Propulsion Systems<br />
Buses can be powered by a number of different propulsion system configurations, each with<br />
a different profile of performance and emissions profile. The major choices currently<br />
available for vehicle propulsion are described below.<br />
Internal Combustion Engine – The most common propulsion system is the<br />
internal combustion engine. Typically, internal combustion engines for bus<br />
operations have used diesel fuel. Several transit agencies use alternative fuels such<br />
as Compressed Natural Gas (CNG) or Liquefied Natural Gas (LNG) in order to reduce<br />
emissions. In response to diesel bus regulations set by the United States<br />
Environmental Protection Agency (EPA), recent innovations in diesel fuel emissions<br />
control and the introduction of Ultra-Low Sulfur Diesel (ULSD) fuel potentially reduce<br />
emissions of diesel fuel to be comparable to CNG and LNG, leading to minimal<br />
differentiation in emissions of oxides of nitrogen and particulate matter among<br />
different fuels.<br />
Trolley Buses / Dual-Mode Buses – Trolley buses are powered by electricity<br />
delivered through overhead catenary cables. Trolley buses have significant<br />
advantages over internal combustion engines in the smoothness of acceleration, the<br />
ability to navigate hills, and the ability to operate with zero local emissions for<br />
operation in tunnels or sensitive urban environments. A trolley bus can also carry an<br />
internal combustion engine in a dual-mode configuration, enabling buses to travel in<br />
areas where no catenary is installed.<br />
3-3
3. Overview of Transit Modes RTC SR-160 <strong>Corridor</strong> <strong>Study</strong><br />
<br />
Hybrid-electric – Like dual-mode propulsion systems, hybrid-electric propulsion<br />
systems combine internal combustion engines with electric drive systems. Hybridelectric<br />
propulsion systems incorporate an on-board energy storage device (e.g.,<br />
batteries or ultra capacitors), allowing the power to shift from one propulsion system<br />
to another, contributing to improved performance and fuel economy with reduced<br />
emissions. Hybrid buses operate in a limited number of places, most notably New<br />
York and Seattle.<br />
Other technologies such as fuel cell and electric batteries are still not developed enough to<br />
be commercially viable.<br />
3.1.3 Infrastructure Elements<br />
Running Ways<br />
Conventional bus transit is versatile. Since rubber-tired buses allow them to travel along<br />
any road, including local streets, major arterials, and highways and freeways, conventional<br />
bus transit has no special running way requirements. Conventional transit typically has no<br />
provision for dedication of lanes and most often travels in mixed flow lanes.<br />
Stations / Stops<br />
A minimum requirement for stations or stops for conventional bus transit is a sign indicating<br />
the location of the bus stop. The sign often conveys information about the route and<br />
direction of the route serving that location. Typically, stops served by conventional bus<br />
transit lines with significant ridership are also provided with a protective shelter with seating<br />
and more transit information.<br />
Fare Collection<br />
Fare collection for conventional bus transit is typically a farebox at the entrance to the<br />
vehicle. Electronic fareboxes with smart card readers are slowly being integrated into urban<br />
transit systems to speed up the process of fare collection.<br />
Intelligent <strong>Transportation</strong> Systems (ITS)<br />
Conventional bus transit systems are also integrating intelligent transportation systems.<br />
Most prominently, transit systems are integrating automated vehicle location (AVL)<br />
systems. AVL systems can either use transponders with detectors placed along the route or<br />
can be based on Global-Positioning System (GPS) technology. These systems enable<br />
managers to monitor and dispatch vehicles and respond to passenger demand more<br />
interactively.<br />
3-4
3. Overview of Transit Modes RTC SR-160 <strong>Corridor</strong> <strong>Study</strong><br />
3.1.4 Service Characteristics<br />
Service characteristics, such as stop spacing, frequency, service span and route length for<br />
Conventional Bus Transit routes are largely determined by the type of route operated.<br />
<strong>Corridor</strong>-based Conventional Bus Transit operates in three primary route configurations:<br />
<br />
<br />
<br />
Local Service,<br />
Limited Service, and<br />
Express Service.<br />
Local Service<br />
Most fixed-route transit service operated with buses can be classified as local service. Local<br />
service operates along a given corridor, serving stops that are spaced close together, often<br />
every block or every other block. Because of the frequency of stops, average speeds on<br />
local service tend to be low, falling between 10 and 13 miles per hour.<br />
Limited Service<br />
Like local service, limited service serves a given corridor, picking up and dropping off<br />
passengers along the route. Just as the name suggests, limited services serve a limited<br />
number of stops, stopping less frequently than local service. Station spacing is often every<br />
half-mile to every mile. Speeds for limited service are generally faster than for express<br />
service.<br />
Express Service<br />
Express bus service generally operates between neighborhoods and a major destination<br />
such as a central business district, shopping mall, employment center, or airport. Express<br />
service typically combines a local segment in a neighborhood, where buses collect<br />
passengers; a line-haul express segment, where buses make no stops or only a few stops at<br />
major destinations; and a final segment where buses distribute passengers locally around a<br />
major trip generator. Also, most express service operates only during the peak hours and<br />
only in the direction of the predominant flow of travel, generally toward employment<br />
centers in the morning commute period and returning toward residential areas during the<br />
evening commute period.<br />
3.1.5 Costs<br />
General capital costs associated with conventional bus transit are presented in the table<br />
below. 8<br />
8 Characteristics of Bus Rapid Transit for Decision-Making, Federal Transit Administration, October 2004.<br />
3-5
3. Overview of Transit Modes RTC SR-160 <strong>Corridor</strong> <strong>Study</strong><br />
EXHIBIT 3-3: Conventional Bus Transit Capital Costs<br />
Capital Cost per Unit<br />
Stations<br />
Simple Stop $15,000 - $20,000 Station / Shelter<br />
Enhanced Stop $25,000 - $35,000 Station / Shelter<br />
Vehicles<br />
Vehicle Type<br />
Conventional Standard (40-foot) $300,000 to $350,000 Vehicle<br />
Conventional Articulated (60-foot) $500,000 to $645,000 Vehicle<br />
Propulsion System<br />
Trolley, Dual Mode +$200 to $400K increment Vehicle<br />
Hybrid Electric $100 to $250K increment Vehicle<br />
Fare Collection<br />
Electronic Farebox $4,000 to $12,000 Farebox<br />
Electronic Farebox with Smart Card Reader $5,000 to $14,000 Unit<br />
ITS<br />
Vehicle Prioritization – Signal Controller Hardware $4,000 to $10,000 Intersection<br />
Operations Mgmt. – Vehicle Location System $5,000 to $35,000 Vehicle<br />
Unit<br />
3.2 BUS RAPID TRANSIT<br />
3.2.1 Overview<br />
Bus rapid transit (BRT) represents an improvement upon conventional bus transit. RTC’s<br />
MAX system is one form of BRT. What differentiates BRT from conventional forms of bus<br />
transit is that BRT represents a fully integrated system designed to achieve higher<br />
performance. More specifically, BRT is an integrated system of physical elements and<br />
infrastructure, service design elements, and customer interface elements to provide a<br />
flexible, high-performance rapid transit mode with a unified quality image and a unique<br />
identity. The high level of design granted to bus rapid transit systems allows them to<br />
achieve many of the same performance objectives and benefits that some rail systems do.<br />
BRT systems have evolved as more attention has been paid to improving the performance<br />
of conventional bus services. Bus rapid transit systems have been in development all<br />
around the world with applications in Asia, Australia, Europe, and North and South America.<br />
In response to these developments, transit agencies in the United States are learning from<br />
the best examples around the world to develop BRT systems of their own. So far, at least<br />
10 regions in the United States have completed BRT systems and many more are under<br />
development. The RTC in Las Vegas has implemented MAX, one of the most technologically<br />
advanced BRT systems, in the North Las Vegas Boulevard corridor heading in a<br />
northeasterly direction from the Downtown Transit Center (DTC).<br />
3-6
3. Overview of Transit Modes RTC SR-160 <strong>Corridor</strong> <strong>Study</strong><br />
3.2.2 Vehicle Characteristics<br />
As with conventional bus transit, BRT employs rubber-tired vehicles that can flexibly operate<br />
on many different types of right-of-way. BRT systems can incorporate many of the same<br />
vehicles that are used for conventional bus service. Often, however, transit agencies use<br />
the implementation of BRT as an opportunity to introduce more advanced vehicle types and<br />
vehicle features.<br />
Vehicle Configuration<br />
Like conventional bus transit, BRT systems can employ both conventional and standard<br />
vehicles of all sizes, standard 40-foot and articulated 60-foot. In addition, the level of<br />
investment in BRT systems often justifies implementation of specialized BRT vehicles.<br />
Specialized BRT vehicles employ a modern, aerodynamic body to provide a look similar to<br />
rail vehicles. Specialized BRT vehicles also often integrate into one package many<br />
characteristics that are considered options for more conventional vehicle types – advanced<br />
communication systems, ITS features, precision docking, high quality interior design and<br />
finishes, and advanced propulsion systems.<br />
EXHIBIT 3-4: Body Design Types<br />
Body Design<br />
Conventional Stylized Specialized<br />
Capacity Standard X X<br />
Articulated X X X<br />
Given the desire to differentiate BRT from more conventional services, transit agencies are<br />
increasingly opting for configurations of vehicles that indicate greater attention to design,<br />
for both the exterior and the interior.<br />
EXHIBIT 3-5: Specialized BRT Vehicles<br />
Stylized<br />
Standard Vehicle<br />
Stylized<br />
Articulated Vehicle<br />
Specialized<br />
BRT Vehicle<br />
3-7
3. Overview of Transit Modes RTC SR-160 <strong>Corridor</strong> <strong>Study</strong><br />
Propulsion Systems<br />
Propulsion systems for BRT vehicles are undergoing the same evolution in propulsion<br />
systems as vehicles for conventional bus transit. The primary choices of propulsion<br />
systems are:<br />
<br />
<br />
<br />
Internal Combustion Engine – Vehicles with internal combustion engines derive<br />
their power from the combustion of a fossil fuel. Buses typically use diesel (now<br />
available in ultra low sulfur form) or natural gas (compressed or liquefied). Internal<br />
combustion engines are the most common vehicle propulsion systems.<br />
Trolley Buses / Dual-Mode Buses – Trolley buses have vehicle drives that are<br />
powered by electricity from overhead wires (catenary). Typically, trolley buses are<br />
used in tunnels (where zero pollutant emissions are required) or corridors with high<br />
bus volumes (where the amount of power delivered justifies the need to maintain<br />
infrastructure). Dual-mode buses can switch between electric power and power from<br />
an internal combustion engine.<br />
Hybrid-electric – Hybrid-electric drives combine internal combustion engines with<br />
an on-board energy storage device, such as a battery. The advantages of hybridelectric<br />
drives over conventional buses include smoother and quicker acceleration,<br />
more efficient braking, improved fuel economy, and reduced emissions.<br />
Other technologies such as fuel cell and electric batteries are still not developed enough to<br />
be commercially viable.<br />
3.2.3 Infrastructure Elements<br />
Running Ways<br />
BRT systems often include running ways that are<br />
specially designed for the exclusive use of BRT<br />
vehicles during part or all of a service day.<br />
Running ways for BRT can include any of the<br />
following running way types:<br />
<br />
<br />
<br />
Designated or reserved lanes – lanes on<br />
arterial lanes that provide a fast, reliable<br />
alternative to mixed flow lanes<br />
At-grade transitways – exclusive lanes<br />
operating in a separate right-of-way with<br />
occasional intersections with cross-streets<br />
Fully Grade-Separated Exclusive Transitways – Exclusive lanes operating in a<br />
separate right-of-way with no crossings, enabling maximum speed between stations<br />
3-8
3. Overview of Transit Modes RTC SR-160 <strong>Corridor</strong> <strong>Study</strong><br />
BRT running ways often also include distinctive markings such as special signage or<br />
differentiated pavement color or texture.<br />
Stations<br />
BRT stations typically are designed with differentiated treatments to highlight the<br />
improvement in service that BRT offers. Stations use more elaborate off-the-shelf shelter<br />
designs or custom designs that are tailored to the site and the environment. BRT stations<br />
also often include amenities such as more elaborate lighting, security systems, vendors,<br />
more detailed transit information, and communications devices such as customer service<br />
telephones, and emergency alarms.<br />
EXHIBIT 3-6: MAX Station at Las Vegas Blvd and Carey<br />
Fare Collection<br />
Fare collection for BRT can often be structured similar to<br />
fare collection on rail systems, including alternate fare<br />
collection processes such as pre-paid fare collection.<br />
Depending on the fare collection process, BRT fare collection<br />
equipment can include either electronic fareboxes with<br />
smart card readers installed on the bus or ticket vending<br />
machines and smart card readers at stations. Typically,<br />
these advanced systems are installed as part of agencywide<br />
procurements.<br />
ITS<br />
BRT systems typically involve more complex intelligent transportation systems (ITS) than<br />
conventional bus transit, such as advanced communication systems and automated vehicle<br />
location systems that enable managers to monitor and dispatch vehicles and respond to<br />
passenger demand more interactively. BRT systems tend to install more active real-time<br />
information systems at stations and more interactive security systems at stations, enabling<br />
quicker responses to incidents and threats to passenger safety and security.<br />
3-9
3. Overview of Transit Modes RTC SR-160 <strong>Corridor</strong> <strong>Study</strong><br />
3.2.4 Service Characteristics<br />
Service characteristics, such as stop spacing, frequency, service span, and route length for<br />
BRT services can vary based on the demand for transit service in respective BRT corridors.<br />
The structure of BRT route systems can also vary. BRT systems operate in three primary<br />
types of route structures:<br />
<br />
Single Route – One route pattern serving a route<br />
from end to end.<br />
<br />
<br />
<br />
Overlapping Route with Variations – A trunk route<br />
is served by two or more routes. Each route<br />
serves a different set of stops or serves a<br />
different alignment beyond that route.<br />
Integrated or Network System – Multiple routes<br />
serve some portion of a dedicated right of way.<br />
Some routes serve the entire trunk line from endto-end.<br />
Other routes serve commute markets<br />
with express/feeder service or local markets with<br />
local service.<br />
Typically, trunkline frequencies can vary between<br />
one bus every 30 seconds to one bus every 20<br />
minutes.<br />
3.2.5 Costs<br />
Capital costs for major BRT Elements are presented in the table below. 9<br />
EXHIBIT 3-7: Bus Rapid Transit (BRT) Capital Costs by Element<br />
Capital Cost per Unit<br />
Running Way<br />
Mixed Flow Lanes --<br />
Designated Lanes $2.5 - $2.9 million Lane mile<br />
At-Grade Exclusive Lanes $6.5 – 10.2 million Lane mile<br />
Grade-Separated Exclusive Lanes – Aerial<br />
Grade-Separated Exclusive Lanes – Below<br />
Grade<br />
$12 – 30 million<br />
$60 – 105 million<br />
Unit<br />
Lane mile<br />
Stations<br />
Simple Stop $15,000 - $20,000 Station / Shelter<br />
9 Characteristics of Bus Rapid Transit for Decision-Making, Federal Transit Administration, October 2004.<br />
3-10
3. Overview of Transit Modes RTC SR-160 <strong>Corridor</strong> <strong>Study</strong><br />
Capital Cost per Unit<br />
Enhanced Stop $25,000 - $35,000 Station / Shelter<br />
Designated Station $150,000 - $2.5 million Station<br />
Intermodal Terminal or Transit Center $5 million to $20 million Station<br />
Unit<br />
Capital Cost per Unit<br />
Vehicles<br />
Vehicle Type<br />
Conventional Standard (40-foot) $300,000 to $350,000 Vehicle<br />
Conventional Articulated (60-foot) $500,000 to $645,000 Vehicle<br />
Stylized Standard $300,000 to $370,000 Vehicle<br />
Stylized Articulated $630,000 to $950,000 Vehicle<br />
Specialized BRT Vehicles $950,000 to $1,600,000 Vehicle<br />
Propulsion System<br />
Trolley, Dual Mode +$200 to $400K increment * Vehicle<br />
Hybrid Electric +$100 to $250K increment * Vehicle<br />
* An addition to base vehicle costs<br />
Capital Cost per Unit<br />
Fare Collection<br />
Electronic Farebox $4,000 to $12,000 Farebox<br />
Electronic Farebox with Smart Card Reader $5,000 to $14,000 Unit<br />
Smart Card Reader $1,000 to $7,000 Unit<br />
Ticket Vending Machine $30,000 to $60,000 Unit<br />
ITS<br />
Vehicle Prioritization – Signal Controller Hardware $4,000 to $10,000 Intersection<br />
Driver Assist and Automation – Electronic Precision<br />
Vehicle<br />
$50,000<br />
Docking Hardware<br />
Operations Mgmt. – Vehicle Location System $5,000 to $35,000 Vehicle<br />
Source: Characteristics of Bus Rapid Transit for Decision-Making, Federal Transit Administration,<br />
August 2004<br />
Unit<br />
Unit<br />
3-11
3. Overview of Transit Modes RTC SR-160 <strong>Corridor</strong> <strong>Study</strong><br />
3.3 LIGHT RAIL TRANSIT / DIESEL MULTIPLE UNIT TRANSIT<br />
3.3.1 Overview<br />
The <strong>Transportation</strong> Research Board’s Urban <strong>Transportation</strong> Glossary defines light rail transit<br />
(LRT) as “a metropolitan electric railway system characterized by its ability to operate single<br />
cars or short trains along exclusive rights-of-way at ground level, on aerial structures, in<br />
subways, or occasionally, in streets to board and discharge passengers at track or car floor<br />
level." LRT can operate in a variety of operating environments, including local streets,<br />
freeway medians, railroad rights-of-way and aerial structures. Compared to conventional<br />
buses that operated on shared local roads, LRT is more expensive to construct. However,<br />
because of LRT’s design flexibility it is generally less costly to build and operate than other<br />
fixed guideway modes. Over the past quarter century, several major metropolitan regions<br />
have introduced LRT. The addition of LRT trunk lines and the coordination of regional bus<br />
service can result in the emergence of a robust multimodal transit system that encourages<br />
growth in transit ridership.<br />
EXHIBIT 3-8: Opening Dates for LRT Systems<br />
CITY<br />
OPENING DATE<br />
Edmonton April 1978<br />
Calgary May 1981<br />
San Diego July 1981<br />
Buffalo October 1984<br />
Portland September 1986<br />
Sacramento March 1987<br />
San Jose December 1987<br />
Los Angeles July 1990<br />
Baltimore April 1992<br />
St. Louis July 1993<br />
Denver October 1994<br />
Dallas June 1996<br />
Salt Lake City December 1999<br />
Jersey City April 2000<br />
LRT vehicles collect electrical power from an overhead wire and can operate in both mixed<br />
traffic and grade separated guideway. LRT can also be operated as Diesel Multiple Unit<br />
(DMU) steel-wheel vehicles on grooved steel tracks embedded along major urban arterial<br />
streets. DMU is a self-propelled passenger rail car capable of pulling additional coaches.<br />
With DMU technology, overhead wires and catenary equipment are not required. The DMU is<br />
designed and approved to operate in mixed freight traffic, subject to FRA’s newest 49 CFR<br />
3-12
3. Overview of Transit Modes RTC SR-160 <strong>Corridor</strong> <strong>Study</strong><br />
Part 238 specifications. The first and only DMU that is fully FRA compliant is the Colorado<br />
Railcar.<br />
DMU systems have become increasingly popular. Over the last ten years, DMU systems<br />
have been built in Trenton, New Jersey (South New Jersey Light Rail Transit), San Diego,<br />
California (North County Transit District’s Sprinter Line) and Ottawa, Canada. Several<br />
others are currently being planned (Denver RTD, Portland, Oregon, Chicago, Illinois, and<br />
Orange County, California).<br />
3.3.2 Vehicle Characteristics<br />
Light rail vehicles (LRVs) and DMUs vary in shape and size, but one-piece cars typically<br />
range from 50 feet to 67 feet in length. Bodies that exceed that length are split into two or<br />
more sections that are hinged so that the articulated vehicle can negotiate tight curves. A<br />
three-car train operated by a single driver can transport more than 400 passengers.<br />
Depending on the number of car sections and the track configuration, LRT / DMU can<br />
accommodate between 2,000 and 20,000 passengers per hour in urban cities with<br />
populations between 500,000 and one million and densely developed corridors.<br />
LRT/DMU trains have modern electric propulsion and braking control systems that enable<br />
vehicles to operate safely in differing neighborhood and street environments. The<br />
maximum speed of an LRV/DMU is 55 miles per hour, and in mixed flow traffic the average<br />
operating speed is typically adjusted to the general traffic safety speeds of the local street.<br />
The DMU vehicle, which can be a single- or double-level vehicle, can pull two or three<br />
additional single level coaches depending on the track‘s elevation and ruling grade. The<br />
DMU gets 2 miles per gallon (mpg) carrying 90 passengers and 1.5 mpg carrying two<br />
additional coaches. The DMU has seating for 92 and a maximum passenger capacity of over<br />
200 including standees. A DMU costs approximately $2.9 million.<br />
3-13
3. Overview of Transit Modes RTC SR-160 <strong>Corridor</strong> <strong>Study</strong><br />
3.3.3 Infrastructure Elements<br />
All LRT/DMU systems have the following basic elements:<br />
Running Way Infrastructure<br />
Wherever LRT/DMU systems operate, running way<br />
infrastructure must be installed. These include track<br />
and a power supply system. The number of tracks<br />
affects the capacity of the system. Tracks are either<br />
single-tracked (for low frequency systems) or double<br />
tracked (for high frequency systems). Track can be<br />
placed in at-grade, elevated, or subterranean<br />
alignment. Grade-separated alignments reduce<br />
potential traffic and safety conflicts with other types<br />
of vehicles. On electric-powered light rail system, an overhead catenary system (OCS)<br />
must be installed to deliver power to the light rail train. On DMU systems, no OCS<br />
installation is required because vehicles are individually propelled by diesel engines,<br />
simplifying the system design somewhat and reducing systems costs.<br />
Stations<br />
A station for light rail can be as simple as a curb on<br />
a street. Typical application of LRT / DMU in the<br />
United States involves a more elaborate design with<br />
specially designed platform designs, canopies, and<br />
architectural features. Pedestrian linkages to the<br />
adjacent community are also a part of rail station<br />
designs.<br />
Fare Collection<br />
LRT/DMU Fare collection systems often involve pre-paid fare collection. This is most often<br />
accomplished through the installation of ticket vending machines and smart card readers at<br />
stations.<br />
Systems<br />
LRT/DMU systems typically involve complex systems such as signaling and control system,<br />
communications infrastructure, and safety and security systems.<br />
3-14
3. Overview of Transit Modes RTC SR-160 <strong>Corridor</strong> <strong>Study</strong><br />
3.3.4 Service Characteristics<br />
LRT/DMU systems typically operate 10 to 15 minute peak headways during weekday service<br />
and accommodate relatively tightly spaced stations, allowing for short and moderate length<br />
trips. LRT/DMU systems allow for more efficient high-volume boarding than conventional<br />
buses because they can accommodate level boarding from a station platform and typically<br />
require fare pre-payment. Most properties operate LRT/DMU service between 18-20 hours<br />
per weekday. Most of the new LRT/DMU systems built in the United States over the past<br />
quarter century range between 8 and 26 miles in route length.<br />
Research on transit ridership in cities with new LRT/DMU systems suggests that these<br />
systems, when implemented appropriately, have the potential to enhance transit efficiency.<br />
A <strong>Transportation</strong> Research Board (TRB) report published in November 2000 found that new<br />
LRT systems accounted for 22 percent of total system boardings and carried 30 percent of<br />
systemwide passenger miles but consumed only 17 percent of the operating and<br />
maintenance costs.<br />
While LRT/DMU has the potential to achieve significant efficiencies, it is worth noting that<br />
the cost of wayside maintenance, stations, electrification, signals and other fixed facilities<br />
are quite substantial. Achieving scale economies for LRT/DMU requires high ridership, and<br />
the presence of high-density transit friendly corridors that can anchor radial lines and<br />
crosstown bus feeder routes.<br />
3.3.5 Capital Costs<br />
FTA’s Light Rail Transit Capital Cost <strong>Study</strong> subdivides LRT capital costs into eight individual<br />
cost components.<br />
<br />
<br />
<br />
<br />
<br />
<br />
<br />
<br />
<br />
<br />
Guideway<br />
Trackwork<br />
Systems<br />
Stations<br />
Facilities<br />
Vehicles<br />
Special Conditions<br />
Right-of-Way<br />
Soft Costs: Engineering/Design/Project & Construction Management and Insurance<br />
Contingency<br />
3-15
3. Overview of Transit Modes RTC SR-160 <strong>Corridor</strong> <strong>Study</strong><br />
The table below provides recent unit cost estimates for a sample of pre-1991 and post-1991<br />
LRT systems. For the sample of LRT projects completed after 1991, the average capital cost<br />
per linear foot of guideway was $8,489.<br />
The average capital cost per linear mile of<br />
guideway is $44.8M.<br />
EXHIBIT 3-9: Light Rail Project Costs Over Time ($2003)<br />
Actuals<br />
Quantity<br />
Adjusted<br />
Standard<br />
Model LRT<br />
Average Unit Cost (per L.F. Guideway)<br />
Pre 1991 Sample $ 6,566 $ 6,694 $ 6,532<br />
Post 1991 Sample $ 10,386 $ 10,369 $ 8,489<br />
$ Change $ 3,820 $ 3,676 $ 1,957<br />
% Change 58% 55% 30%<br />
Source: Light Rail Transit Capital Cost <strong>Study</strong>, FTA Office of Program Management<br />
The sample does not include any LRT systems that employ DMU technology, which until<br />
recently has been typically implemented largely on interurban passenger rail service.<br />
Because DMU technology does not require overhead electrification, the unit costs for<br />
systems are slightly lower. For all other elements, the unit costs are relatively comparable.<br />
It should be noted that new DMU systems operating on shared tracks must be Federal<br />
Railroad Administration (FRA) compliant. Because the engineering and project management<br />
oversight required to meet FRA compliance is extensive, no savings in the area of soft costs<br />
and vehicle costs is anticipated.<br />
3-16
4. Evaluation Methodology RTC SR-160 <strong>Corridor</strong> <strong>Study</strong><br />
4.0 EVALUATION METHODOLOGY<br />
When assessing the applicability of potential transit investments to specific corridor<br />
segments and developing route structure alternatives, it is important to consider both<br />
potential transit demand and the physical characteristics of the corridor. In developing new<br />
transit services, the basic route network structure is typically influenced by the spatial<br />
distribution of trip generators and attractors and the movement of these trips throughout<br />
the transportation network.<br />
To the extent possible, the route structure should maximize service to identifiable and<br />
predictable commuter and non-work-related trip sheds. Service levels – defined by peak<br />
and non-peak frequencies, span of service, and total vehicle service hours – for these new<br />
routes should correspond with observable transit demand. In the following section, several<br />
key planning variables that help determine the suitability of new transit service to<br />
expanding areas of a regional transportation system are presented.<br />
4.1 FACTORS GUIDING TRANSIT EXPANSION<br />
Planning for transit improvements along the <strong>Blue</strong> <strong>Diamond</strong> corridor merits unique<br />
consideration because the intense pace of new residential development in the Enterprise<br />
area is unprecedented even for the Las Vegas Valley. With so much Major Project<br />
subdivision development currently underway and subsequent phases planned for future<br />
years, the character of the Enterprise community is being transformed from a quiet rural<br />
district to a sprawling suburban area vulnerable to a widening infrastructure gap.<br />
With respect to transportation infrastructure, a multimodal plan for SR-160 and connecting<br />
major arterials that includes a mass transit element must be developed before the window<br />
of opportunity closes – even though there is no transit service there today. The potential to<br />
attract transit ridership is a function of several variables.<br />
<br />
The type and intensity of existing transit service – The type of transit service<br />
already operating in a corridor gives an indication of the relative level of transit<br />
service that a corridor can support. The <strong>Blue</strong> <strong>Diamond</strong> study area does not currently<br />
benefit from any transit service. Given the breakneck pace of subdivision expansion<br />
south of SR-160 and between SR-160 and CC-215, mass transit improvements are<br />
needed, based on future population and development growth estimates and the<br />
changing nature of the community from rural to growing suburban.<br />
<br />
Traffic Volumes and Level of Congestion – High traffic volumes indicate high<br />
demand for travel in specific sections of the transportation network. As Enterprise’s<br />
only east-west connector to I-15, SR-160 is among the region’s most heavily<br />
4-1
4. Evaluation Methodology RTC SR-160 <strong>Corridor</strong> <strong>Study</strong><br />
congested routes. The increasing share of trips between the Pahrump Valley and Las<br />
Vegas is also contributing to the growth in average daily traffic along SR-160. As<br />
described in the prior section, NDOT has completed capacity improvements for<br />
SR-160 which are to be completed in two separate phases.<br />
<br />
The number and type of activity centers – Activity centers represent nodes that<br />
can serve as station sites for any high-capacity transportation system. They also<br />
represent locations where bus service may converge, facilitating transfers between<br />
regional transit and local transit and community shuttle services.<br />
Variables that represent the physical characteristics of the alignment include:<br />
<br />
Right-of-way availability – <strong>Corridor</strong>s may more easily have a dedicated track of<br />
running way when extra right-of-way (beyond what is required for already planned<br />
roadway expansions) is available. <strong>Corridor</strong>s that have wide medians or extra rightof-way<br />
on the sides of roadways for potential queue jumpers or dedicated lanes have<br />
a higher likelihood of accommodating high-end BRT systems or LRT/DMU. The<br />
planned expansion of SR-160 does provide sufficient space for a dedicated transit<br />
running way in some areas An assessment of the feasibility of implementing a<br />
dedicated transit running way is presented in Section 4.<br />
<br />
Pedestrian accessibility – Research on the link between transportation and land<br />
development suggests that the presence of high concentrations of population,<br />
employment sites, and activity centers within walking distance of transit stations<br />
promotes ridership. Alignments are assessed for the design of the pedestrian<br />
network around them and the likelihood that adjacent population clusters and<br />
activity centers will have pedestrian-friendly connections to potential stations. Since<br />
much of the study area has until recently been sparsely developed, with key gaps in<br />
the street network, issues related to pedestrian accessibility have not been central in<br />
the improvement of transportation infrastructure. Pedestrian accessibility is a design<br />
consideration in the conceptual drawings of two Park & Ride facilities (1-1 and 1-4).<br />
The factors described above are evaluated to ensure development of a transit plan for the<br />
<strong>Blue</strong> <strong>Diamond</strong> study area that captures future transit market shares without risking<br />
premature system overcapitalization. To the extent possible, operational considerations<br />
have been woven into the selection of potential station locations, Park & Ride facilities, and<br />
running way treatments. Because of the manner in which development in the study area is<br />
being phased in, a phasing strategy that ramps up service levels based on observed<br />
increases in the transit market is recommended.<br />
To plan for future growth, attention must also be given today to opportunities to reserve<br />
space for future transit-supportive features. Because of the tremendous demand for Bureau<br />
4-2
4. Evaluation Methodology RTC SR-160 <strong>Corridor</strong> <strong>Study</strong><br />
of Land Management (BLM) land in Enterprise, the window of opportunity to secure land<br />
needed for transit is quickly closing. In the following section, current ownership of desirable<br />
parcels is described. Methods available for acquiring federally owned right-of-way needed<br />
to construct transit-supportive amenities like Park & Ride facilities, transfer stations and<br />
intermediate transit stations, shelters and bus stops are also presented.<br />
4.2 SCREENING METHODOLOGY<br />
This subsection presents a screening methodology to the corridor alternatives based on<br />
formal planning criteria and it establishs a framework for applying this screening<br />
methodology to each corridor alternative and recommending an alternative or set of<br />
alternatives that best suits the characteristics of the corridor.<br />
By design, the methodology to assess the corridor alternatives is taken from the evaluation<br />
criteria established for the Las Vegas Valley Long Range Transit Plan, which outlines a<br />
strategic vision for long-term transit investments for the Las Vegas Valley. The screening<br />
criteria include the following.<br />
<br />
Mobility Improvements – How well do the proposed transit alternatives improve<br />
travel times and options How does the proposed modal solution improve ridership<br />
and operational efficiency To what extent will new transit services impact vehicular<br />
safety on existing roads where transit routes will be introduced<br />
<br />
Presence of Transit Supportive Land Use – Is the candidate corridor included in<br />
existing land use policies that emphasize smart growth and transit-oriented<br />
development<br />
<br />
Engineering Feasibility – How difficult is the build option to implement What are<br />
the estimated capital and operating costs What are the impacts to traffic<br />
circulation<br />
<br />
Supportive Demographics – Are there population and employment densities<br />
sufficient to justify the introduction of new transit services Assuming the share of<br />
transit-dependent population in the study area is low, how many jobs are within a<br />
½-mile of the corridor<br />
<br />
Environmental Constraints – How much right-of-way is available to construct<br />
facilities required to introduce local, express and bus rapid transit (BRT) services<br />
How much relocation of utilities and other assets will be required<br />
4-3
4. Evaluation Methodology RTC SR-160 <strong>Corridor</strong> <strong>Study</strong><br />
<br />
Community Support – How much community support is there for new mass transit<br />
services<br />
System ridership is an especially important measure of how effectively new transit service<br />
improves both mobility and accessibility. Ridership is related to several factors, including<br />
the baseline demographics of the residential population in proximity to transit stations and<br />
the transit supportive attributes of land uses within the corridor. In addition, the<br />
concentration of major trip attractors along the corridor, such as commercial, retail, tourist,<br />
and education, also plays an important role in the potential for new transit service to<br />
capture market shares.<br />
Generally, sufficiently high residential and commercial densities clustered tightly within a<br />
major transportation corridor are required to produce sufficient ridership levels to justify the<br />
investment in a fixed guideway mass transit system. This corridor profile is common in<br />
major cities with central business districts (CBDs) that represent a significant share of the<br />
region’s employment and commercial activity. Where the prevailing transit mode share is<br />
high and land acquisition is prohibitively expensive, fixed guideway systems serving urban<br />
corridors do not typically require Park & Ride lots as a precondition for attracting ridership.<br />
In a lower density environment that may be characterized as suburban, Park & Ride<br />
facilities have been adopted as a transit-supportive strategy needed to attract choice riders<br />
in areas where the existing automobile mode share is very high. For our purposes, the land<br />
use characteristics of the <strong>Blue</strong> <strong>Diamond</strong> study area are defined as suburban/rural, with the<br />
area between Durango Drive and Decatur Boulevard transitioning from rural to largely<br />
suburban.<br />
EXHIBIT 4-1: Carrying Capacity of Mass Transit Alternatives<br />
50<br />
Average Speed (mph)<br />
40<br />
30<br />
20<br />
10<br />
BRT<br />
LRT<br />
AGT<br />
Heavy Rail<br />
0<br />
5,000<br />
10,000 15,000 20,000 25,000<br />
Capacity (passengers/hour)<br />
4-4
4. Evaluation Methodology RTC SR-160 <strong>Corridor</strong> <strong>Study</strong><br />
Exhibit 4-1 provides a conceptual overview of the carrying capacity of major mass transit<br />
alternatives. Because of its high per mile capital costs, heavy rail (subway) and elevated<br />
rail systems are considered feasible only in central business districts (CBDs) in dense<br />
populated metropolitan regions where a substantial share of commute trips are bound for<br />
the central city. Generally, subways are considered only for regions where transit demand<br />
exceeds 15,000 passengers per hour. In regions where heavy rail is not considered a<br />
feasible alternative, transit agencies have invested in Light Rail Transit (LRT) systems which<br />
operate largely at-grade on city streets.<br />
Like heavy rail, LRT systems are typically retrofitted into high-density urban corridors where<br />
high transit demand cannot be sufficiently met by existing fixed route bus services and the<br />
expected benefit in new ridership justifies the economic costs of the fixed investment. Light<br />
rail system typically carry anywhere between 5,000 and 12,000 passengers per hour. Rarely<br />
are LRT systems considered suitable for corridors that currently possess daily ridership<br />
below 3,000 passengers per day, unless enough commercial development is anticipated.<br />
Where anticipated ridership levels are not high enough to justify a fixed guideway rail<br />
investment, transit planners have turned to an array of rubber-tire bus rapid transit (BRT)<br />
technologies. BRT systems have increased in popularity because they offer flexible options<br />
that can be scaled upward at comparatively lower marginal fixed costs to meet growing<br />
demand.<br />
4-5
5. Alternative Development RTC SR-160 <strong>Corridor</strong> <strong>Study</strong><br />
5.0 ALTERNATIVE DEVELOPMENT<br />
The development of transit alternatives along SR-160 has been an iterative process<br />
throughout the project. In the second phase of the work, the consultant assessed proposed<br />
alternatives both through the planning framework summarized above, as well as the<br />
screening methodology for best modal treatment. Stakeholder input influenced the process<br />
on a regular basis through bi-monthly Technical Working Group meetings.<br />
This section summarizes the development of multi-modal alternatives for SR-160. First the<br />
potential alignments are presented. Second, the mode screening methodology is presented.<br />
Finally, the section presents the preferred modal options for each corridor (i.e., radial and<br />
cross-town corridor), within the <strong>Blue</strong> <strong>Diamond</strong> <strong>Study</strong> Area.<br />
5.1 RADIAL AND CROSS TOWN ALIGNMENTS<br />
The consultant presented a series of Alternative proposals to the Technical Working Group<br />
in October 2005 and again in March 2006. Each proposal was subject to considerable<br />
debate, and gradually fine-tuned with respect to alignment, modal treatment, and<br />
applicability of Park & Ride locations.<br />
Exhibit 5-1 presents a summary of sketch planning variables used to assess the suitability<br />
of potential corridors for transit investment. Building on the analysis performed in the prior<br />
section, this section presents both qualitative and quantitative data related to the variables<br />
discussed above.<br />
Alignments<br />
EXHIBIT 5-1: Summary Assessment of Potential Alignments<br />
Radial Alignments<br />
Existing<br />
Transit<br />
Estimated<br />
2030 Daily<br />
Traffic<br />
Volumes<br />
Extra Rightof-Way<br />
Available<br />
Pedestrian<br />
Accessibility<br />
1. Durango Drive None 12,893 Yes 0<br />
2. Rainbow Boulevard None 15,253 Yes 2<br />
3. UPRR ROW None -- Yes 0<br />
4. Decatur Boulevard None 28,729 Yes 2<br />
5. Las Vegas Boulevard South None 17,912 Yes 2<br />
Cross-Town Alignments<br />
1. Warm Springs <strong>Road</strong> None 11,958 No 0<br />
2. SR-160 None 37,044 No 0<br />
3. Silverado Ranch <strong>Road</strong> None 17,389 Yes 0<br />
4 = Excellent 2 = Limited 0 = Poor<br />
5-1
5. Alternative Development RTC SR-160 <strong>Corridor</strong> <strong>Study</strong><br />
One of the challenges in developing a transit plan for the <strong>Blue</strong> <strong>Diamond</strong> study area is the<br />
automobile-based orientation of businesses and residential areas throughout the study area.<br />
This prevailing development pattern contributes directly to the high private automobile<br />
mode share and the traffic problems that now recur at several key locations along SR-160<br />
and approaching arterials. Use of alternative modes of transportation are severely limited<br />
by the absence of transit, pedestrian, and bicycling circulation systems that connect <strong>Blue</strong><br />
<strong>Diamond</strong> to the rest of the Valley. RTC is currently working with Clark County to address<br />
these system gaps by amending the Mixed Used District (MUD) ordinance. For all the<br />
potential alignments described in Exhibit 2-1, pedestrian supportive amenities are virtually<br />
non-existent.<br />
5.2 PHYSICAL CHARACTERISTICS OF SPECIFIC ALIGNMENTS<br />
Based on a review of the study area, including geographic analysis and field review, a<br />
number of potential alignments are identified as worthy of investigation for transit service<br />
improvements. This discussion considers two types of alignments.<br />
<br />
<br />
Radial alignments – generally demonstrate heavy travel demand since they connect<br />
downtown Las Vegas with activity centers and residential neighborhoods.<br />
Cross-town alignments – serve as connectors between suburban activity centers and<br />
residential neighborhoods, and to connect radials with each other.<br />
According to the <strong>Regional</strong> <strong>Transportation</strong> Plan for FY 2006-2030, Clark County is planning<br />
major street improvements to all arterials and streets on the ½-mile grid over the next 25<br />
years, with many of the improvements planned within the <strong>Blue</strong> <strong>Diamond</strong> study area to be<br />
completed within the next five years. At a minimum, the major north-south arterials<br />
presented in this section will be four to six lanes.<br />
5-2
5. Alternative Development RTC SR-160 <strong>Corridor</strong> <strong>Study</strong><br />
5.2.1 Radial Alignments<br />
The radial alignments shown in Exhibit 5-2 are major arterials connecting locations north of<br />
CC-215 to the SR-160 corridor. Other than the Union Pacific Railroad (UPRR) right-of-way,<br />
all radial alignments travel in a north to south alignment along major arterials. Since all<br />
major north-south arterials are planned for street widening improvements (the majority of<br />
which in the next five years), these radial alignments are considered potential transit<br />
corridors that can extend CAT service south to SR-160. Also, unless identified otherwise,<br />
most radial alignments considered are 6-lane corridors, with 3-lanes in each direction plus<br />
left-turn pockets/lanes at intersections.<br />
EXHIBIT 5-2: Major Radial Alignments<br />
CC-215<br />
Warm Springs <strong>Road</strong><br />
Durango Durango Drive<br />
Buffalo Drive<br />
Rainbow Blvd<br />
Jones Jones Blvd Blvd<br />
In general, initial development of the roadways to the South of SR-160 will be performed by<br />
the developers themselves. Clark County will handle Rainbow, Jones, Decatur, and Valley<br />
View. With the possible exception of an Eastwards connection to I-15 south of SR-160, all<br />
alignments proposed in this section connect SR-160 to points North and North East towards<br />
downtown Las Vegas and employment points along CC-215.<br />
5-3
5. Alternative Development RTC SR-160 <strong>Corridor</strong> <strong>Study</strong><br />
Durango Drive – Durango Drive extends south of CC-215 into the <strong>Blue</strong> <strong>Diamond</strong> study<br />
area and represents the major arterial connector serving the Rhodes Ranch and, ultimately,<br />
the Mountains Edge residential subdivisions. Durango is the western-most radial alignment<br />
identified for SR-160. South of CC-215, Durango Drive is a two-lane road that provides<br />
access to SR-160, albeit on a largely unpaved road. The high degree of construction<br />
activity occurring in the area renders it a challenging route for through drivers. In the most<br />
recent Capital Improvement Plan (CIP) from 2006, Clark County is planning to widen<br />
Durango Drive and connect it with SR-160; it should be built out to four lanes to Windmill<br />
by the end of 2006.<br />
EXHIBIT 5-3: Durango Drive Radial Alignment<br />
CC-215<br />
Aerial view of Durango Drive looking north of SR-160<br />
5-4
5. Alternative Development RTC SR-160 <strong>Corridor</strong> <strong>Study</strong><br />
Rainbow Boulevard – The second radial alignment is Rainbow Boulevard, which extends<br />
south of CC-215 and provides a direct connection to SR-160. Rainbow Boulevard is the<br />
major arterial serving the Pinnacle Peaks residential subdivision. Between SR-160 and CC-<br />
215, it will be widened to four lanes by 2007 (i.e., two lanes in each direction) and to six<br />
lanes within ten years and it will be extended south to Jean and Sloan as part of the 25 year<br />
capital improvement plan. Access will be controlled with medians at stop lights. Rainbow<br />
Boulevard also serves several local retail and commercial strip malls between SR-160 and<br />
CC-215.<br />
EXHIBIT 5-4: Rainbow Boulevard Radial Alignment<br />
CC-215<br />
Jones Blvd<br />
Rainbow Rainbow Blvd<br />
UPRR UPRR ROW<br />
SR-160<br />
Aerial view of Rainbow Blvd looking north of SR-160<br />
Union Pacific Railroad (UPRR) – The Union Pacific Railroad mainline bisects SR-160 at<br />
Jones Boulevard. There has been discussion about introducing passenger rail service on the<br />
UPRR, but no definite decisions or commitments have been made.<br />
5-5
5. Alternative Development RTC SR-160 <strong>Corridor</strong> <strong>Study</strong><br />
Decatur Boulevard – The fourth major radial alignment goes along Decatur Boulevard,<br />
one of the Las Vegas Valley’s major north-south arterials, with connections to CC-215 and<br />
SR-160. At SR-160 and Decatur Blvd, there is a signalized intersection, with a major<br />
housing subdivision under construction at the northwest corner. South of CC-215, Decatur<br />
Blvd discontinues at Baudra, where a small access road connects to Jones Blvd to the west.<br />
Clark County plans to start construction in 2006 on a retained cut under the UPRR mainline<br />
to connect the two halves of Decatur, under the railroad. Upon the completion of this<br />
structure, Clark County plans to initiate improvements between Warm Springs and SR-160.<br />
EXHIBIT 5-5: Decatur Boulevard Radial Alignment<br />
Discontinuous<br />
segments on<br />
Decatur Blvd<br />
CC-215<br />
Aerial view of Decatur Blvd @ UPRR looking north<br />
5-6
5. Alternative Development RTC SR-160 <strong>Corridor</strong> <strong>Study</strong><br />
Las Vegas Boulevard South – The fifth and final radial alignment to consider is Las Vegas<br />
Boulevard South which runs from Stewart in downtown Las Vegas south to Sloan and<br />
includes the Las Vegas Strip. The portion of Las Vegas Boulevard South serving SR-160 is a<br />
7.3 mile segment between Sunset and St. Rose that represents its eastern terminus. This<br />
portion of Las Vegas Boulevard South is just south of the traditional Las Vegas Strip<br />
corridor. Much of the eastbound traffic on SR-160 heads northbound on Las Vegas<br />
Boulevard South to the employment base along the Las Vegas Strip. From 2003 to 2025,<br />
travel times on Las Vegas Boulevard are expected to increase 26 percent.<br />
EXHIBIT 5-6: Las Vegas Boulevard South Radial Alignment<br />
CC-215<br />
SR-160<br />
Las Vegas Blvd South<br />
Aerial view of Las Vegas Blvd South<br />
and SR-160 looking north<br />
5-7
5. Alternative Development RTC SR-160 <strong>Corridor</strong> <strong>Study</strong><br />
5.2.2 Cross-Town Alignments<br />
Several cross-town alignments are considered and characterized.<br />
cross-town alignments are depicted in Exhibit 5-7.<br />
The three east-west<br />
EXHIBIT 5-7: Major Cross-town Alignments<br />
CC-215<br />
Warm Springs <strong>Road</strong><br />
Durango Durango Drive<br />
Buffalo Drive<br />
Rainbow Blvd<br />
Silverado Ranch Blvd<br />
Jones Jones Blvd Blvd<br />
SR-160 (<strong>Blue</strong> <strong>Diamond</strong> <strong>Road</strong>) – The portion of SR-160 within this study is an 8.5 mile twolane<br />
limited express state road that bisects a largely rural planning district in Clark County<br />
known as Enterprise. SR-160 connects to I-15 at a major freeway interchange a mile south<br />
of the CC-215/I-15 interchange, with a connector to Las Vegas Boulevard South just east of<br />
I-15. SR-160 runs west by southwest from I-15 through a local street network with several<br />
major north-south arterials, including Industrial, Decatur, Jones, Raimbow, Buffalo,<br />
Durango. Much of the street network between I-15 and SR-160 is incomplete, with plans in<br />
place under the County’s Major Projects program and the Capital Improvement Program<br />
(CIP) to expand major arterials to better serve the communities along the SR-160 corridor.<br />
5-8
5. Alternative Development RTC SR-160 <strong>Corridor</strong> <strong>Study</strong><br />
Warm Springs <strong>Road</strong> – Warm Springs <strong>Road</strong> parallels CC-215 just south of CC-215 between<br />
Durango and Decatur Blvd. It provides an important east-west connector to the Rhodes<br />
Ranch and Pinnacle Peaks subdivisions. The UPRR intersects Warm Springs <strong>Road</strong> at<br />
Decatur Boulevard. As shown in the aerial photo to the right Warm Springs <strong>Road</strong><br />
discontinues between Decatur and Rainbow. Within the next 5-10 years, NDOT plans to<br />
grade separate the UPRR at Jones, which will enable Clark County to connect Warm Springs<br />
<strong>Road</strong> under the railroad bridge structure. The improvement for Warm Springs <strong>Road</strong><br />
assumes sufficient capacity for six lanes.<br />
EXHIBIT 5-8: Warm Springs <strong>Road</strong> Cross-Town Alignment<br />
CC-215<br />
Warm Springs <strong>Road</strong><br />
to be completed after<br />
UPRR at Decatur is<br />
fully grade separated<br />
Aerial view of Warm Springs <strong>Road</strong> facing west<br />
5-9
5. Alternative Development RTC SR-160 <strong>Corridor</strong> <strong>Study</strong><br />
Silverado Ranch Blvd –<br />
West of Las Vegas Boulevard<br />
South, Silverado Ranch<br />
Boulevard is a two-lane<br />
street that connects to<br />
Decatur Boulevard. Based<br />
on the unavailability of UPRR<br />
for regional passenger rail<br />
service, Silverado Ranch<br />
Boulevard is identified as a<br />
corridor that may be suitable<br />
for some fixed guideway<br />
treatment that connects with<br />
Silverado Silverado Ranch Ranch Blvd<br />
Blvd<br />
I-15<br />
SR-160<br />
Las Vegas Boulevard.<br />
Aerial view of Silverado Ranch Blvd looking west of I-15<br />
5.3 MODAL OPTIONS<br />
Each transit mode – local and express bus, bus rapid transit (BRT) and light rail transit/DMU<br />
– is assessed based on the suitability of that modal technology to the attributes of the<br />
corridors through which the routes are designated. This analysis does not estimate land use<br />
impacts of new transit investment. A more detailed treatment of land use impacts resulting<br />
from Clark County’s Mixed Use Overlay District is addressed in Section 2.<br />
In additional, strategic nodes for Park & Ride Sites have been identified, and the route<br />
network for the study area has been structured around the Park & Ride facilities in a manner<br />
to maximize transit ridership through incentivizing Park & Ride utilization. The modes are<br />
analyzed from the most intensive to least intensive investment – LRT/DMU, bus rapid<br />
transit, and conventional bus transit.<br />
<strong>Corridor</strong>s<br />
EXHIBIT 5-9: Summary of Alignments and Modes<br />
Conventional<br />
Bus – Local<br />
Conventional<br />
Bus – Express<br />
Bus Rapid<br />
Transit<br />
SR-160 X X<br />
Decatur Boulevard X X<br />
Rainbow Drive X X<br />
Warm Springs <strong>Road</strong> X X<br />
Light Rail<br />
Transit/DMU<br />
Las Vegas Boulevard X X X<br />
Durango Drive X X<br />
Silverado Ranch<br />
Boulevard<br />
X<br />
5-10
5. Alternative Development RTC SR-160 <strong>Corridor</strong> <strong>Study</strong><br />
Exhibit 5-9 provides a summary matrix of potential modes to alignments identified as<br />
suitable for mass transit investment. Of the seven total corridors considered (four radial<br />
corridors and three cross-town corridors), three corridors within the study area have strong<br />
potential for new transit service or transit service improvements.<br />
5.3.1 Light Rail/DMU<br />
Consistent with the previous discussion, light rail transit and DMU are suited for alignments<br />
with:<br />
<br />
<br />
<br />
<br />
Right-of-way for track,<br />
Direct access to a large parcel of land for a maintenance facility,<br />
<strong>Corridor</strong>s with high demand for transit service, and<br />
Nodes with pedestrian access to high demand.<br />
Among the radial alignments, traffic volumes for all radial corridors are moderate, with<br />
heavy volumes predicted over the next fifteen years as Major Projects reach their<br />
development cap and the population of Enterprise increases. Given this fact, differentiation<br />
among corridors will be based on the factors mentioned above.<br />
The Union Pacific Railroad (UPRR) is the only corridor with existing rail right-of-way.<br />
However, Union Pacific has recently withdrawn interest in allowing passenger rail service on<br />
this railroad subdivision. Given continued interest in a regional fixed guideway system that<br />
connects both the southern and northern part of the Valley to the heart of the Las Vegas<br />
Strip, there may be opportunities to widen streets such as Silverado Ranch to accommodate<br />
fixed guideway connecting to Las Vegas Boulevard or I-15. These roads are new, allowing<br />
for allocation of the required right-of-way for a future light rail investment.<br />
With the possible exception of Las Vegas Boulevard South, none of the radial alignments<br />
appear to have demographics and dense built environment needed to support a fixed<br />
guideway system. Rainbow Boulevard, Durango Drive, and Decatur Boulevard currently<br />
have segments that are four to six lanes wide, but none have the type of compact<br />
development associated with corridors that support fixed guideway transit. Even if such<br />
densities existed, devoting space within these corridors for a fixed guideway rail envelope<br />
cannot be accomplished without extensive right-of-way acquisition. Given the rural<br />
preservation character and the residential nature of adjacent land uses, these corridors are<br />
better suited for a more flexible mass transit treatment that will not materially impact<br />
vehicle circulation.<br />
In the study area, no cross-town alignments are deemed to be appropriate for light rail or<br />
DMU, due to generally low levels of demand, suburban residential densities, and few activity<br />
5-11
5. Alternative Development RTC SR-160 <strong>Corridor</strong> <strong>Study</strong><br />
centers. Because of traffic interference problems caused by an at-grade fixed guideway<br />
system, SR-160 is determined not to suitable for a fixed guideway system. Also due to lack<br />
of connectivity with the planned regional rail network, cross-town alignments are more<br />
appropriate for light rail only if planned in conjunction with one or more radial alignments.<br />
The cross-town alignments are, therefore, determined to be sufficiently served by enhanced<br />
conventional bus transit and are not appropriate for consideration for light rail for the<br />
planning time horizon of this study.<br />
5.3.2 Bus Rapid Transit (BRT)<br />
As described in the previous section, alignments that are appropriate for BRT are alignments<br />
that include:<br />
<br />
<br />
<br />
Right-of-way that can accommodate exclusive sections for queue jumpers or<br />
exclusive lanes,<br />
Medium to high demand for transit service, and<br />
Nodes with pedestrian access to activity centers and intense development.<br />
Radial alignments that provide access to SR-160 are appropriate for consideration for fixed<br />
route local, express, and BRT routes. Rainbow Drive, Decatur Boulevard, and Las Vegas<br />
Boulevard South serve multiple residential and retail centers and several large casinos.<br />
None of the radial alignments that connect to SR-160 have the distribution of population<br />
and activity centers to justify exclusive lanes, with the possible exception of Decatur<br />
Boulevard and, in the near term, Las Vegas Boulevard South. Over the long term, RTC<br />
considers Las Vegas Boulevard South a suitable candidate for exclusive BRT.<br />
With the exception of SR-160, the cross-town alignments have minimal demand to support<br />
frequent transit services associated with BRT. Of the cross-town alignments, only SR-160<br />
has the right-of-way space to support a BRT line, but SR-160 lacks pedestrian access to<br />
concentrations of population, employment, or activity to warrant a significant investment in<br />
transit infrastructure. The linkage between pedestrian amenities and transit ridership<br />
creates a motivation for planners to improve pedestrian infrastructure for corridors where<br />
transit investments are desired. Such improvements include revised street standards,<br />
revised urban design guidelines, landscaping, siting of building façades and entrances<br />
toward the street, and the installation of pedestrian pathways.<br />
5.3.3 Conventional Bus Transit<br />
Conventional bus transit service, both local and express service, may be appropriate<br />
solutions for certain alignments.<br />
5-12
5. Alternative Development RTC SR-160 <strong>Corridor</strong> <strong>Study</strong><br />
Local Service<br />
Because there is no transit service currently in the <strong>Blue</strong> <strong>Diamond</strong> study area, the<br />
introduction of new transit service will be in the form of local fixed route service. The<br />
introduction of local conventional bus service is appropriate as a cost-effective means of<br />
testing the potential market followed by gradually expanding service levels to accommodate<br />
observed growth in transit demand. Potential routes for conventional bus transit service will<br />
be composed of:<br />
<br />
Radial Alignments – Of the radial alignments considered, Rainbow Boulevard,<br />
Durango Drive, and Decatur Boulevard south of SR-160 will be considered for<br />
conventional bus transit service. The radial alignments will be anchored to Park &<br />
Ride facilities off SR-160, which function as critical system nodes.<br />
<br />
Cross-town Alignments – The three cross-town alignments contain largely<br />
automobile-oriented commercial activity and serve residential neighborhoods. The<br />
Warm Springs <strong>Road</strong> alignment will be considered for improvement to conventional<br />
bus transit service.<br />
Express Service<br />
In addition to local fixed-route service, conventional bus transit service also includes the<br />
operation of express bus service that operates in the peak-period. Although peak-period<br />
express service typically requires physical space for Park & Ride Sites that collect<br />
passengers and access to a highway for higher speed service to a final destination, express<br />
overlay service can operate without such fixed assets during initial operations. Of all<br />
alignments considered, SR-160, Rainbow Boulevard, and Decatur Boulevard have the<br />
physical characteristics and ridership potential to support express service. Therefore, this<br />
portion of SR-160 will be considered for implementation of express bus service.<br />
5.4 ALTERNATIVE REFINEMENT<br />
Two alternatives are presented representing three distinct phases – 2008, 2015 and 2025.<br />
The purpose of presenting the transit investment strategy in multiple phases is to provide a<br />
cost-effective and scalable approach to service expansion based on observed ridership<br />
trends. Based on the trends, it may be that ridership growth increases at a much lower rate<br />
than assumed in this study, and that it is more appropriate to implement only two of the<br />
three proposed phases by 2025.<br />
The following sections provide a detailed system description of each of the following<br />
alignment configurations:<br />
A. Alternative 1 – High Growth (2008), (2015), (2025)<br />
5-13
5. Alternative Development RTC SR-160 <strong>Corridor</strong> <strong>Study</strong><br />
B. Alternative 2 – Moderate Growth (2008), (2015), (2025)<br />
Alternative 1 – High Growth assumes substantial mixed use development within Clark<br />
County’s Mixed Use Overlay District and ridership growth that reflects development<br />
scenario. Alternative 2 – Moderate Growth assumes more limited mixed use<br />
development within Clark County’s Mixed Use Overlay District and more modest transit<br />
ridership growth. Assumptions regarding service levels for each alternative are developed<br />
as part of Sections 6 and 7, which estimates capital and operating costs.<br />
Detailed maps of the alignment configurations are provided with each alignment<br />
configuration description, with a corresponding table identifying proposed stations. These<br />
alignments are supported by three Park & Ride facilities along SR-160, which are described<br />
in detail in Section 7. Fares and fare media types are assumed to be consistent with that of<br />
the CAT system overall.<br />
5-14
5. Alternative Development RTC SR-160 <strong>Corridor</strong> <strong>Study</strong><br />
EXHIBIT 5-10: Alternative 1 – High Growth (2008)<br />
Alternative 1 – High Growth (2008) is<br />
the first of a phased transit investment<br />
strategy that expands service<br />
incrementally based observed ridership<br />
growth patterns, in addition to land use<br />
growth patterns. Alternative 1 (2008) is<br />
composed of two routes, both of which are<br />
anchored to the planned Park & Ride lot at<br />
SR-160 and Hualapai Way. The local<br />
route (shown in red) is the southern<br />
extension of Route 101 into the <strong>Blue</strong><br />
<strong>Diamond</strong> corridor via Rainbow Boulevard<br />
The express route along SR-160 (shown in<br />
green) provides service to Park & Ride lots<br />
along SR-160, extends north on Decatur<br />
Boulevard, east on Warm Springs <strong>Road</strong><br />
with a stop location at the Las Vegas<br />
Outlet Center, then north on Gilespie to<br />
the South Strip Transfer Terminal (SSTT).<br />
Park & Ride Sites 1-1 and 1-4, which are<br />
discussed in greater detail in Section 5.1,<br />
are critical nodes in the transit plan for<br />
the <strong>Blue</strong> <strong>Diamond</strong> corridor. PR 1-1, which<br />
will accommodate up to 200 vehicles, is<br />
designed to attract commuters from the<br />
Pahrump Valley, Mountain’s Edge and<br />
Rhodes Ranch; PR 1-4, which can<br />
accommodate up to 250 vehicles, is<br />
designed to attract commuters from<br />
Pinnacle Peaks, Southern Highlands and<br />
other communities near central SR-160.<br />
Not shown in these drawings is a third<br />
potential Park & Ride site, referred to as<br />
1-2/2-2, which is discussed in Section 8.<br />
This facility would be located on SR-160 at<br />
S. Durango Drive, in the heart of the<br />
Mountain’s Edge community.<br />
5-15
5. Alternative Development RTC SR-160 <strong>Corridor</strong> <strong>Study</strong><br />
EXHIBIT 5-11: Alternative 1 – High Growth (2015)<br />
Alternative 1 – High Growth (2015)<br />
introduces a bus rapid transit (BRT)<br />
overlay route along SR-160 and should be<br />
implemented based on observed increases<br />
in the demand for regional express service<br />
connecting the <strong>Blue</strong> <strong>Diamond</strong> area to the<br />
Strip and downtown Las Vegas. The BRT<br />
overlay route is designed to offer<br />
enhanced end-to-end travel times<br />
between the western terminal PR 1-1<br />
through numerous operational<br />
enhancements and service attributes,<br />
including fewer station stops, enhanced<br />
stations (with multi-entry level<br />
boardings), dedicated bus lanes along SR-<br />
160, traffic signal priority (TSP) and/or<br />
queue-jumping. This route will also have a<br />
dedicated fleet of advanced BRT vehicles<br />
similar in design and station interface to<br />
the MAX system, with an off-vehicle proofof-payment<br />
fare system. Proposed BRT<br />
stations are denoted in the map by a<br />
white square.<br />
An express route is also planned for SR-<br />
160. At Warm Springs <strong>Road</strong>, this express<br />
route continues north along Decatur<br />
Boulevard. Local route 101 is similar in<br />
alignment to the Route 101 alignment<br />
introduced in 2008, with the exception<br />
that service levels (peak and non-peak<br />
frequencies) may increase depending on<br />
growth in transit demand. Bus shelters<br />
and bus stops are denoted by a white<br />
circle (see legend).<br />
5-16
5. Alternative Development RTC SR-160 <strong>Corridor</strong> <strong>Study</strong><br />
EXHIBIT 5-12: Alternative 1 – High Growth (2025)<br />
Alternative 1 – High Growth (2025)<br />
introduces a fourth route (designated<br />
local) that connects PR 1-4 to western<br />
part of the Las Vegas Valley along<br />
Durango Drive, where the employment<br />
base is expected to expand west of<br />
Rainbow near CC-215. The local route<br />
extends north on Decatur Boulevard, west<br />
on Warm Springs <strong>Road</strong>, and continues<br />
north along Durango Drive. The final<br />
buildout is designed to provide northern<br />
connections via three primary axes:<br />
Durango, Rainbow and Las Vegas<br />
Boulevard.<br />
the South Strip Transfer Terminal (SSTT).<br />
The connection to the SSTT is designed to<br />
allow for high-volume transfers to express<br />
and local routes serving the Strip and<br />
areas north of <strong>Blue</strong> <strong>Diamond</strong>.<br />
The BRT route along SR-160 (shown in<br />
green) provides service to Park & Ride lots<br />
along SR-160, extends north on Decatur<br />
Boulevard, east on Warm Springs <strong>Road</strong><br />
with a stop location at the Las Vegas<br />
Outlet Center, then north on Gilespie to<br />
5-17
5. Alternative Development RTC SR-160 <strong>Corridor</strong> <strong>Study</strong><br />
EXHIBIT 5-13: Alternative 2 – High Growth (2008)<br />
Alternative 2 – Moderate Growth<br />
(2008) is the first of a phased transit<br />
investment strategy that expands service<br />
more conservatively based on lower<br />
transit demand and lower overall<br />
development growth than assumed in<br />
Alternative 1. The most obvious<br />
difference between this investment<br />
strategy and Phases 1 (A, B and C) is that<br />
Phase 2 is scaled up in more<br />
conservatively, with the Phase 2 (2025)<br />
representing a more modest buildout than<br />
Alternative 1. These alternatives are<br />
meant to reflect a scenario in which<br />
corridor ridership is moderate.<br />
Alternative 2 – Moderate Growth (2008) is<br />
composed of one express trunk route<br />
anchored to the planned Park & Ride lot at<br />
SR-160 and Hualapai Way. The express<br />
route along SR-160 (shown in green)<br />
provides service to both Park & Ride lots<br />
along SR-160, extends north on Las Vegas<br />
Boulevard South, east on Warm Springs<br />
<strong>Road</strong>, then north on Gilespie to the South<br />
Strip Transfer Terminal (SSTT). The<br />
express route is designed to connect<br />
western <strong>Blue</strong> <strong>Diamond</strong> area to routes<br />
serving the Las Vegas Strip and retail and<br />
employment areas north via SSTT.<br />
Park & Ride Sites 1-1 and 1-4 are critical<br />
features to the transit plan for the <strong>Blue</strong><br />
<strong>Diamond</strong> corridor. PR 1-1 is designed to<br />
attract commuters from the Pahrump<br />
Valley, Mountain’s Edge and Rhodes<br />
Ranch; PR 1-4 is designed to attract<br />
commuters from Pinnacle Peaks, Southern<br />
Highlands and other communities near<br />
central SR-160.<br />
5-18
5. Alternative Development RTC SR-160 <strong>Corridor</strong> <strong>Study</strong><br />
EXHIBIT 5-14: Alternative 2 – Moderate Growth (2015)<br />
Alternative 2 – Moderate Growth<br />
(2015) introduces a local route to serve<br />
as a north-south corridor along Rainbow<br />
Blvd and Durango Drive. The local route,<br />
which has a southern terminus at the Park<br />
& Ride Site at SR-160 and Rainbow<br />
Boulevard (PR 1-4), is designed to serve<br />
trips originating in the Pinnacle Peaks and<br />
Rhodes Ranch destined for commercial<br />
activity sites along CC-215 and in the<br />
Summerlin area. The local route extends<br />
north along Rainbow Blvd, west on Warm<br />
Springs and north on Durango Drive. Stop<br />
locations for the local route are proposed<br />
on Rainbow Blvd a ¼-mile south of Warm<br />
Springs <strong>Road</strong> and along Durango Drive<br />
one block north of Warm Springs.<br />
increase based on observed boardings and<br />
growth in Park & Ride demand. The<br />
proposed stop locations along SR-160<br />
include:<br />
SR-160 @ Hualapai Way (PR 1-1)<br />
SR-160 @ El Capitan Way<br />
SR-160 @ Buffalo Drive<br />
SR-160 @ Rainbow Blvd (PR 1-4)<br />
SR-160 @ Lindell <strong>Road</strong><br />
SR-160 @ Arville <strong>Road</strong><br />
Las Vegas Boulevard @ the Las<br />
Vegas Outlet Mall<br />
South Strip Transfer Terminal<br />
The structure of the express route does<br />
not change from the base configuration<br />
recommended for 2008, with the<br />
exception that service frequencies may<br />
5-19
2. <strong>Study</strong> Area <strong>Transportation</strong> System RTC SR-160 <strong>Corridor</strong> <strong>Study</strong><br />
EXHIBIT 5-15: Alternative 2 – Moderate Growth (2025)<br />
Alternative 2 – Moderate Growth<br />
(2025) involves the conversion of the<br />
express route along SR-160 to a bus rapid<br />
transit route. The BRT overlay route is<br />
designed to offer enhanced end-to-end<br />
travel times between the western terminal<br />
PR 1-1 through numerous operational<br />
enhancements and service attributes,<br />
including fewer station stops, enhanced<br />
stations (with multi-entry level<br />
boardings), dedicated bus lanes along SR-<br />
160, traffic signal priority (TSP) and/or<br />
queue-jumping. This route will also have a<br />
dedicated fleet of advanced BRT vehicles<br />
similar in design and station interface as<br />
the MAX system, with an off-vehicle proofof-payment<br />
fare system.<br />
The final buildout is also adds an express<br />
route service from PR 1-1 along SR-160,<br />
with service along Decatur Boulevard.<br />
Both the Decatur Express and <strong>Blue</strong><br />
<strong>Diamond</strong> BRT would operate along a<br />
dedicated busway on SR-160. This<br />
buildout scenario is designed to provide<br />
northern connections via three primary<br />
axes: Durango Drive, Decatur Blvd and<br />
Las Vegas Boulevard.<br />
5-20
6. SR-160 <strong>Corridor</strong> Improvement Plan RTC SR-160 <strong>Corridor</strong> <strong>Study</strong><br />
6.0 SR-160 CORRIDOR IMPROVEMENT PLAN<br />
6.1 CURRENT CONDITIONS AND SR-160 EXPANSION PROJECT<br />
The portion of SR-160 that was analyzed for this study extends from Las Vegas Boulevard in<br />
Las Vegas to where it intersects Hualapai Way, approximately 8.5 miles to the west. Along<br />
that stretch, there are several major street intersections, an overpass at I-15, and a grade<br />
crossing of the Union Pacific Railroad (UPRR) mainline. Most of SR-160 in this corridor is a<br />
two-lane roadway, although at some of the major intersections the highway widens and has<br />
turning lanes. The terrain gains approximately 650 feet in elevation between S. Las Vegas<br />
Blvd. and Hualapai Way in a steady ascending grade to the west. The tightest curve on the<br />
highway has a radius of 3,000 feet.<br />
The applicability of the former Union Pacific Railroad branch line right-of-way for transit<br />
purposes is discussed in Section 6.7.<br />
The SR-160 widening project, led by the Nevada Department of <strong>Transportation</strong> (NDOT), is<br />
being undertaken in phases, moving east to west from Las Vegas Boulevard South to<br />
beyond South Durango Drive. Construction has started on some of the work, while other<br />
areas are still in the design phase. When it is completed, major components of this project<br />
will include:<br />
A fully divided, multi-lane highway to Durango Drive.;<br />
Eight lanes (four in each direction) from S. Las Vegas Blvd. to Rainbow Blvd.;<br />
Six lanes from S. Rainbow Blvd. to Durango Drive.;<br />
A new bridge and alignment over I-15;<br />
A new connection to Las Vegas Blvd. South at Windmill Lane, approximately 0.4<br />
miles south of the existing intersection;<br />
Major intersections with left and right turn lanes and 4-way signals at several<br />
locations (no grade-separated intersections);<br />
An overpass over the UPRR mainline immediately west of Jones Blvd. to replace the<br />
grade crossing that currently exists;<br />
12-foot traffic lanes;<br />
8-foot bike lanes on both sides of the highway; and<br />
Either 5.5foot sidewalks or 8-foot shoulders.<br />
At this time, there are no provisions in the project for HOV or transit-only lanes.<br />
At the east end of the corridor, there will be 5½-foot sidewalks on both sides of the<br />
highway. As the highway continues westward into less developed areas, there will initially<br />
6-1
6. SR-160 <strong>Corridor</strong> Improvement Plan RTC SR-160 <strong>Corridor</strong> <strong>Study</strong><br />
be eight-foot shoulders in lieu of sidewalks. As residential and commercial development<br />
continues to the west, the shoulders will ultimately be replaced by sidewalks and driveways.<br />
For purposes of highway configuration considerations, the SR-160 study corridor can be<br />
divided into the following four segments:<br />
Segment<br />
No.<br />
From / to<br />
Length<br />
<strong>Corridor</strong><br />
width<br />
Lanes<br />
1<br />
S. Las Vegas Boulevard to<br />
S. Decatur Boulevard<br />
2 miles<br />
150 feet<br />
(W of I-15)<br />
8<br />
(varies over I-15)<br />
2<br />
S. Decatur Boulevard to<br />
S. Rainbow Boulevard<br />
2¼<br />
miles<br />
200 feet 8<br />
3<br />
S. Rainbow Boulevard to<br />
S. Durango Drive<br />
2 miles 200 feet<br />
6<br />
(narrows west of<br />
Rainbow)<br />
4<br />
S. Durango Drive to<br />
S. Hualapai Way<br />
2 miles 200 feet<br />
2<br />
(narrows west of<br />
Durango)<br />
Segment 4<br />
Segment 3<br />
Segment 1<br />
Segment 2<br />
It would be difficult to implement special provisions for transit<br />
vehicles, other than signal priority technology, in Segment 1 with<br />
its eight-lane configuration and nominal 29 foot center median<br />
within a 150 foot corridor. (Eight 12-foot lanes, one 29 foot<br />
median, two 8-foot bike lanes, and two 5½-foot sidewalks require<br />
152 feet, as shown in the diagram to the right.) The 200 foot<br />
corridor of Segments 2, 3, and 4 between Hualapai Way and<br />
Decatur Boulevard would accommodate various transit-supportive<br />
features.<br />
Where the highway width is less than the corridor width, the<br />
highway will generally be centered in the right-of-way.<br />
6-2
6. SR-160 <strong>Corridor</strong> Improvement Plan RTC SR-160 <strong>Corridor</strong> <strong>Study</strong><br />
6.2 FUTURE HIGHWAY LANE CONFIGURATION<br />
Initially, there will likely be no special transit features along SR-160 between intersections;<br />
transit vehicles would proceed with the flow of traffic in the general traffic lanes.<br />
If the level of traffic eventually warrants,<br />
however, bus-only lanes could be<br />
provided in the 200-foot wide corridor<br />
without compromising any of the general<br />
traffic lanes or the bike lanes. Transit-only<br />
lanes, as shown in EXHIBIT 6-1, would be<br />
located between the slow lanes and the 5<br />
foot bike lanes. At signaled intersections,<br />
the lanes could flow into a queue-jumping<br />
lane, a dedicated lane that enables buses<br />
to proceed through an intersection ahead<br />
of general traffic.<br />
EXHIBIT 6-1: Dedicated Bus Lanes<br />
Transit-only lanes would likely be combined with lanes used to access commercial driveways<br />
along SR-160. Due to the frequent signals and cross traffic, making the transit-only lanes<br />
available to all HOVs would not be feasible. Bus stops along the SR-160 corridor are<br />
recommended at intermediate locations between Park & Ride facilities. They would<br />
generally be located on the far (exit) side of intersections, and would be located out of the<br />
general traffic lanes except in Segment 1. This subject is addressed in greater detail in<br />
Section 7. A typical cross-section of SR-160 at an intersection is shown for Arville Drive in<br />
EXHIBIT 6- at the end of this section.<br />
6.3 SIGNALED INTERSECTION CONFIGURATION<br />
NDOT is still refining the list of intersections on SR-160 that will be signalized. The intersections<br />
that have been identified for signaling within the study corridor at this time are as<br />
shown in EXHIBIT 6-2 below 10 . Most, if not all, of the intersections on the transit corridor<br />
would include the ability to implement some form of Bus Signal Priority (TSP).<br />
EXHIBIT 6-2: Signaled Intersections<br />
No. Cross Street Bus Movement Recommended Configuration<br />
1 Las Vegas<br />
EB SR-160 to NB LV<br />
TSP for left turn from EB SR-160<br />
Boulevard<br />
Boulevard and vice versa onto NB Las Vegas Boulevard<br />
2 I-15 Straight through TSP both EB and WB<br />
10 Not all of these intersections are officially programmed to be signaled upon the initial widening of SR-160,<br />
although NDOT indicates that further traffic studies will likely result in the vast majority receiving signals.<br />
6-3
6. SR-160 <strong>Corridor</strong> Improvement Plan RTC SR-160 <strong>Corridor</strong> <strong>Study</strong><br />
No. Cross Street Bus Movement Recommended Configuration<br />
3 Dean Martin Straight through TSP and, if possible, queuejumping<br />
lanes both EB and WB<br />
4 Valley View Straight through Queue-jumping lanes and TSP<br />
both EB and WB<br />
5 Hinson Street Straight through Queue-jumping lanes and TSP<br />
both EB and WB<br />
6 Arville Straight through Queue-jumping lanes and TSP<br />
both EB and WB<br />
7 Decatur Straight through on SR-160,<br />
as well as EB SR-160 to<br />
northbound Decatur and vice<br />
versa<br />
Queue-jumping lanes and TSP<br />
both EB and WB; left turn lane<br />
and TSP from EB SR-160 to NB<br />
Decatur<br />
8 Lindell Straight through Queue-jumping lanes and TSP<br />
both EB and WB<br />
9 Jones Straight through Queue-jumping lanes and TSP<br />
both EB and WB<br />
10 Torrey Pines WB SR-160 to SB Torrey<br />
Pines and vice versa<br />
Transit-only left turn lane and<br />
TSP from WB SR-160 to SB<br />
Torrey Pines<br />
TSP for left turn from NB<br />
Rainbow to WB SR-160<br />
11 Rainbow NB Rainbow to WB SR-160<br />
and vice versa<br />
12 Buffalo Straight through Queue-jumping lanes and TSP<br />
both EB and WB<br />
13 Durango Straight through EB: queue-jumping lane and<br />
TSP; WB: queue-jumping lane,<br />
transit-only lane west of<br />
intersection until beyond P&R,<br />
and TSP<br />
The only non-signalized intersection on SR-160 which could cause delays to transit vehicles<br />
is at Hualapai Way, where westbound buses would turn south, across the eastbound lanes,<br />
to enter the Park & Ride facility. SR-160 will remain in a two-lane configuration for the<br />
immediate future, although Clark County’s current RTP calls for widening of the highway to<br />
four lanes between Mountain Springs and Ft. Apache <strong>Road</strong> by 2016 (Project #261), at which<br />
time the intersection may require signaling. There are no existing plans to widen Hualapai<br />
Way near SR-160.<br />
6.4 OPTIMIZING MOVEMENT OF TRANSIT VEHICLES<br />
Various strategies can be implemented to expedite bus movement through signalized<br />
intersections and minimize delays.<br />
6.4.1 Queue-Jumping Intersections<br />
Bus operation at many of the intersections shown in EXHIBIT 6- will simply be straight<br />
through, from east to west or vice versa. These intersections could implement queuejumping<br />
lanes and be equipped with TSP capabilities. A queue-jumping lane enables buses<br />
to “go to the head of the queue” at an intersection by use of a dedicated transit lane or right<br />
6-4
6. SR-160 <strong>Corridor</strong> Improvement Plan RTC SR-160 <strong>Corridor</strong> <strong>Study</strong><br />
turn lane approaching the intersection. The signal for this dedicated lane goes green<br />
several seconds prior to the signal for the general traffic lanes, enabling the bus to pass<br />
through the intersection ahead of other vehicles.<br />
There are two possible configurations for these intersections. As shown in EXHIBIT 6-3, the<br />
first has separate right-turn and queue-jumping lanes, which requires the bicycle and rightturn<br />
lanes to weave prior to the intersection. (This is not an uncommon configuration.) The<br />
second combines the right-turn and queue-jumping lanes, resulting in a narrower design;<br />
efficient signal timing can help ensure that the right turn lane will be clear of automobiles<br />
before the bus receives a green signal at the intersection. Both configurations fit within the<br />
200-foot SR-160 corridor.<br />
The implementation of one option over the other would be<br />
decided on a case-by-case basis, and is generally predicated on the number of vehicles<br />
expected to be making right turns at the intersection.<br />
The AASHTO Park & Ride Guide<br />
states that an exclusive bus lane should be considered when right-turn volumes are greater<br />
than 400 vehicles per hour. 11<br />
EXHIBIT 6-3: Possible Right-Turn / Queue-Jump Lane Configurations<br />
Separate right-turn<br />
and queue-jump lanes<br />
Combined right-turn<br />
and queue-jump lane<br />
BUS<br />
ONLY<br />
BUS<br />
ONLY<br />
These same lane configuration options could be used when there is a bus stop or a driveway<br />
into a Park & Ride at the far side of the intersection. Although the lane configuration would<br />
be the same, there would be no need for an early green signal since buses could enter a<br />
short transit-only lane on the far side of the intersection prior to entering the facility.<br />
11 “Guide for Park & Ride Facilities”, American Association of State Highway and <strong>Transportation</strong> Officials, November<br />
2004, p. 53<br />
6-5
6. SR-160 <strong>Corridor</strong> Improvement Plan RTC SR-160 <strong>Corridor</strong> <strong>Study</strong><br />
Preliminary NDOT intersection<br />
EXHIBIT 6-4: Right-Turn Island<br />
drawings (included in Appendix C)<br />
indicate that some right-turn lanes<br />
turn short of traffic islands, which<br />
would make it difficult to implement<br />
queue-jumping. An example of this is<br />
shown in EXHIBIT 6-4, which shows<br />
westbound SR-160 at Jones Blvd. RTC<br />
should work with NDOT to ensure that<br />
the highway design does not preclude<br />
transit-supportive features such as<br />
queue-jumping lanes.<br />
No right-turn lane is planned for eastbound SR-160 at Rainbow Blvd. A major Park & Ride<br />
facility is proposed on BLM land southeast of this intersection, which would require<br />
eastbound buses to turn south on Rainbow to access the facility. Lacking a right-turn lane<br />
onto Rainbow Blvd., eastbound buses could be unnecessarily delayed at this intersection. If<br />
a different access route to this Park & Ride is provided, or even if it is never built, the lack<br />
of a right-turn lane would preclude queue-jumping at Rainbow Blvd.<br />
6.4.2 Left Turn Lanes<br />
The median on the widened section of SR-160 will be 29 feet wide between intersections,<br />
which will narrow to five feet at each intersection, thus providing space for up to two 12 foot<br />
turn lanes. The space for these two lanes can be configured in three ways:<br />
1. Both lanes are left turn lanes for general traffic.<br />
2. There is only one left turn lane; the lane to the right is an unused buffer area.<br />
3. The left lane is the turn lane for general traffic, with the right lane being a turn lane<br />
for buses only.<br />
The main determinant of which option is used is generally based on the anticipated number<br />
of vehicles that will be turning, although the width of the receiving roadway is also a factor.<br />
The intersection at Arville Street, shown in EXHIBIT 6-5 at the end of this section, will be<br />
configured with the first two of these configurations. There will be two left turn lanes from<br />
eastbound SR-160 to northbound Arville Street, but one left turn lane and one buffer lane<br />
from westbound SR-160 onto southbound Arville Street.<br />
NDOT’s anticipated configuration is not yet available for all intersections, including Torrey<br />
Pines Boulevard, where westbound buses would be turning left from SR-160. If NDOT<br />
determines that two westbound general traffic left turn lanes are not required, consideration<br />
could be given to implementing a bus-only left turn lane in lieu of a buffer lane (Option 3<br />
above) at this location.<br />
6-6
6. SR-160 <strong>Corridor</strong> Improvement Plan RTC SR-160 <strong>Corridor</strong> <strong>Study</strong><br />
6.4.3 Bus Signal Priority<br />
AASHTO’s “Guide for Park & Ride Facilities” 12 lists eleven different types of Bus Signal<br />
Priority strategies, which are as follows.<br />
Unconditional priority: priority is given whenever a bus detector requests it from<br />
signals.<br />
Conditional priority: includes variables that may limit priority given, such as bus<br />
occupancy, queue length, and time since last priority was granted.<br />
Phase: part of the traffic signal time cycle allocated to any combination of traffic<br />
movements receiving right-of-way simultaneously during one or more intervals.<br />
Green extension: green phase is extended when bus is nearby to allow it to go<br />
through.<br />
Special phase: a special green phase is injected into the normal phase sequence<br />
while all other phases are stopped.<br />
Compensation: green time is allocated to a non-priority phase that was truncated to<br />
make up for lost time.<br />
Red truncation: if the bus arrives at an intersection during the beginning or middle<br />
of a red phase, the red phase is truncated and green phase is injected to allow the<br />
bus to go through.<br />
Early start: when bus arrives at intersection during a red, green follows quicker than<br />
usual.<br />
Green recall: a green phase is displayed each cycle whether demand exists or not.<br />
Synchronization: timing groups of traffic signals along an arterial to provide for the<br />
smooth movement of traffic with minimal stops.<br />
Phase suppression: one or more non-priority phases with low demand may be<br />
omitted from the normal phase sequence.<br />
The strategy implemented at queue-jumping lane intersections would likely include one of<br />
the TSP solutions listed above, or it could simply provide a green signal to the queuejumping<br />
lane approximately five to ten seconds prior to the green signal for the general<br />
traffic lanes, either on every cycle or only when a bus is detected. (All buses will be<br />
equipped with TSP emitters.) Such decisions would need to be made on a case-by-case<br />
basis at each intersection.<br />
TSP can be programmed to activate only in the peak direction during peak periods, or only if<br />
buses are running behind schedule (as determined by the bus operator). It is likely that<br />
12 Ibid, p. 50<br />
6-7
6. SR-160 <strong>Corridor</strong> Improvement Plan RTC SR-160 <strong>Corridor</strong> <strong>Study</strong><br />
determining the proper TSP strategies to be implemented would need to be determined<br />
once traffic flows and bus headways have been established and stabilize. Each intersection<br />
would require its own analysis of the optimum TSP solution. TSP implementation would be<br />
integrated with the Las Vegas Valley’s Freeway and Arterial System of <strong>Transportation</strong><br />
(FAST) program which optimizes traffic signal timing and coordination. The RTC 2005<br />
Annual Report indicates that FAST will address the SR-160 corridor.<br />
6.5 CONGESTION MANAGEMENT STRATEGIES<br />
6.5.1 <strong>Transportation</strong> System Management<br />
<strong>Transportation</strong> System Management (TSM) components generally include low cost<br />
improvements to manage congestion. The term TSM is used to encompass a wide range of<br />
strategies aimed at making efficient use of existing transportation facilities. Typically, these<br />
strategies are less costly than major capacity improvements and may constitute costeffective<br />
alternatives to major highway and transit projects. In some cases, TSM strategies<br />
have greater positive impacts on air quality and energy consumption when compared with<br />
more capital-intensive strategies.<br />
TSM strategies that maintain the efficiency of the existing transportation system can include<br />
the use of the following approaches or programs.<br />
<br />
<br />
<br />
Access Control – limits access to arterial facilities from abutting land uses to<br />
preserve free-flowing travel conditions and arterial capacity.<br />
Site Planning and Traffic Review – examines development density and traffic<br />
generation to mitigate any adverse impact on the roadway system.<br />
Intersection Improvements – involves improving intersections through lower cost<br />
strategies such as constructing turn lanes, realigning intersections, and adding or<br />
improving existing traffic signals.<br />
Clark County reviews all development and traffic plans to preserve free-flowing travel<br />
conditions and arterial capacity.<br />
6.5.2 Future <strong>Road</strong>way System Performance<br />
Traffic conditions in the <strong>Blue</strong> <strong>Diamond</strong> corridor are predicted to become more congested<br />
over time. Additional lane improvements, included in the 2030 RTP, will help to maintain or<br />
improve traffic service on some roadway segments. Without these improvements, traffic<br />
service would be significantly worse, resulting in longer delays and slower travel. It is clear,<br />
however, that further transportation improvements are required to provide an acceptable<br />
overall level of service.<br />
6-8
6. SR-160 <strong>Corridor</strong> Improvement Plan RTC SR-160 <strong>Corridor</strong> <strong>Study</strong><br />
<strong>Transportation</strong> management strategies are usually implemented to extend a roadway's<br />
effective design life and improve its operational characteristics. These strategies are<br />
typically designed to increase the efficiency of the existing transportation system by<br />
improving traffic flow and expanding travel options for travelers. <strong>Transportation</strong><br />
management strategies can be divided into two categories: <strong>Transportation</strong> System<br />
Management (TSM) (listed above) and Travel Demand Management (TDM). TDM actions<br />
are designed to reduce vehicle demand on the roadway system by increasing vehicle<br />
occupancy or altering the attractiveness of competing travel modes.<br />
6.6 REPRESENTATIVE INTERSECTION DIAGRAM<br />
EXHIBIT 6-5 represents a typical intersection on SR-160 after the initial phase of highway<br />
widening. The cross-section, in this case at Arville, reveals how the eight-lane highway will<br />
take up the entire width of the 150-foot right-of-way, although 48 feet of unused space is<br />
available where the corridor width is 200 feet. NDOT drawings of all major intersections on<br />
the corridor are provided in Appendix C.<br />
6-9
6. SR-160 <strong>Corridor</strong> Improvement Plan RTC SR-160 <strong>Corridor</strong> <strong>Study</strong><br />
EXHIBIT 6-5: SR-160 at Arville<br />
6-10
6. SR-160 <strong>Corridor</strong> Improvement Plan RTC SR-160 <strong>Corridor</strong> <strong>Study</strong><br />
6.7 UNION PACIFIC RAILROAD RIGHT-OF-WAY<br />
6.7.1 Overview<br />
This section evaluates whether any part of the abandoned Union Pacific Railroad’s <strong>Blue</strong><br />
<strong>Diamond</strong> branch line – including the rail line that still exists or any of the land along the<br />
remainder of the right-of-way – would be appropriate and cost-effective for fixed-guideway<br />
use. The evaluation includes the determination of property ownership and physical<br />
condition of the right-of-way.<br />
Most of the Union Pacific Railroad (UPRR) branch line that extended from their mainline at<br />
Arden to the <strong>Blue</strong> <strong>Diamond</strong> mine no longer exists and all track and structures have been<br />
removed, although a good portion of the original right-of-way (ROW) is still intact.<br />
EXHIBIT 6-6: Overview of <strong>Blue</strong> <strong>Diamond</strong> Right-of-Way<br />
Approximately 3.6 miles of the ROW is potentially viable for transit usage. This segment of<br />
the corridor starts at the UPRR mainline at Arden and heads northwest to SR-160. After<br />
crossing the highway, the right-of-way parallels SR-160 until just east of Fort Apache <strong>Road</strong>.<br />
Here, it turns in a northwesterly direction away from the highway, into the hills, and<br />
through a recently constructed detention basin, where it becomes unsuitable for transit<br />
purposes.<br />
Most of the land under the abandoned right-of-way is now privately owned, although the<br />
Federal Government owns some large parcels. There are approximately 34 parcels along<br />
the corridor, none of which includes solely the right-of-way itself, which are zoned into four<br />
categories:<br />
<br />
<br />
H-2, general highway frontage district<br />
C-2, general commercial district<br />
6-11
6. SR-160 <strong>Corridor</strong> Improvement Plan RTC SR-160 <strong>Corridor</strong> <strong>Study</strong><br />
<br />
<br />
R-E, rural estates residential district<br />
R-3, multiple-family residential district<br />
The aerial photographs with property lines, as well as the listed property owners as of<br />
November, 2005, are from the Clark County OpenWeb Info Mapper. The majority of the<br />
square parcels shown are approximately 2.5 acres in size. The photographs were taken in<br />
April, 2005. This corridor will be examined in three segments from east to west.<br />
6.7.2 Analysis by Segment<br />
Between the UPRR mainline at Arden and SR-160<br />
Two in-service tracks extend approximately one mile from the UPRR mainline at Arden to<br />
the current end of what remains of the branch line. These tracks appear to be used only to<br />
store freight cars. After passing through two privately-owned parcels at Meranto Ave<br />
(parcels 24 and 25 in EXHIBIT 6-14) where some minor buildings have been constructed,<br />
the ROW continues intact for another 0.25 mile to SR-160. At the site of the former crossing<br />
of SR-160, the tracks have been removed and there are no signs of the former railroad<br />
alignment. At this location, the highway right-of-way is 200 feet wide, and SR-160, after<br />
widening, will be a six-lane highway.<br />
EXHIBIT 6-7: Right-of-Way from UPRR Mainline to SR-160,<br />
and Land with Structures<br />
At this time there are few obstructions that would preclude a transit alignment toward the<br />
UP mainline on or parallel to the existing right-of-way. A new transit corridor could go on<br />
either the northeast or southwest side of the remaining branchline tracks; the final<br />
determination would depend on where a BRT/rail corridor is located and how it would be<br />
most easily accessed from SR-160.<br />
6-12
6. SR-160 <strong>Corridor</strong> Improvement Plan RTC SR-160 <strong>Corridor</strong> <strong>Study</strong><br />
There are currently 16 parcels of land along or adjacent to the ROW, most of which are<br />
zoned R-E (rural estates). The largest parcel by far, although it is not along a continuous<br />
corridor, is owned by the Federal Government. The rest are owned by individuals,<br />
investment firms, and developers. A transit corridor would require obtaining at least a<br />
portion of some of these parcels.<br />
EXHIBIT 6-8: UPRR ROW Looking NW<br />
EXHIBIT 6-9: UPRR ROW Looking SE<br />
Between the former crossing of SR-160 and South Durango Drive<br />
This segment of the corridor is approximately 1.25 miles in length, with the UPRR ROW just<br />
north of and parallel to SR-160.<br />
EXHIBIT 6-10: Right-of-Way from Crossing of SR-160 to Durango Dr.<br />
The widened SR-160 will have six traffic lanes where the UPRR ROW crosses it, and it will<br />
continue in this configuration to Durango Drive. The highway will easily fit within the 200-<br />
foot-wide highway corridor, and except as noted below will not require appropriation of any<br />
of the UPRR ROW that parallels the highway.<br />
6-13
6. SR-160 <strong>Corridor</strong> Improvement Plan RTC SR-160 <strong>Corridor</strong> <strong>Study</strong><br />
EXHIBIT 6-11: Railroad Right-of-Way Within SR-160 <strong>Corridor</strong><br />
UPRR ROW within SR-160 corridor<br />
After crossing SR-160, the UPRR ROW is within the 200’ wide SR-160 corridor for about 0.2<br />
mile before entering private property just before Buffalo Drive, as can be seen in EXHIBIT<br />
6-11 above. Much of this part of the ROW could be incorporated in the approximately 125-<br />
foot-wide six-lane expansion of SR-160, although the UPRR ROW would remain unaffected if<br />
the highway were constructed toward the south edge of its corridor in this area.<br />
The UPRR ROW then passes through the south end of 16 privately-owned parcels prior to<br />
Durango Drive. The parcels in this area (parcels 4-21) are almost all H-2, with two C-2 and<br />
one R-3. All are owned by trusts, investment firms, or development companies and are<br />
generally one to three acres in size. Many of these parcels have been sold within the last<br />
eighteen months.<br />
No structures appear to have been built on this stretch of the ROW.<br />
Between South Durango Drive and South Fort Apache <strong>Road</strong><br />
West of Durango Drive, the UPRR ROW continues to parallel SR-160 for another 0.8 mile, at<br />
which point the railroad alignment turns northwest, away from the highway, where it<br />
becomes unusable for transit. The highway narrows from a six-lane configuration to two<br />
lanes west of Durango, although widening to at least four lanes is expected eventually.<br />
EXHIBIT 6-12: Right-of-Way Between Durango Dr. and Ft. Apache Rd.<br />
The UPRR ROW passes through three parcels in this area, two of which are owned by the<br />
Federal Government. The 1.12 acre parcel (parcel 2), which is privately owned, sold for<br />
6-14
6. SR-160 <strong>Corridor</strong> Improvement Plan RTC SR-160 <strong>Corridor</strong> <strong>Study</strong><br />
$8.85M in March of 2005. All are zoned H-2 (general highway frontage). Immediately to<br />
the north of the 200-foot highway corridor and the Federally-owned parcel that contains the<br />
UPRR ROW is the Westchester Hills development.<br />
As of April, 2005, there were no obstructions on these parcels. The land that continues to<br />
parallel SR-160 to Fort Apache Rd. after the UPRR ROW turns north is owned by the Federal<br />
Government.<br />
EXHIBIT 6-13: Right-of-Way with Westchester Hills Behind<br />
6.7.3 Conclusions<br />
Technically, there are no “show stoppers” that would prevent usage of the Union Pacific<br />
Railroad right-of-way for transit purposes. The portion of the ROW that was studied is<br />
essentially intact, and no structures of any significance have been built along the corridor.<br />
The geometry of the ROW would allow bus or rail operation at normal speeds, except<br />
possibly just east of S. Buffalo Dr. where the ROW turns to cross SR-160. At this same<br />
location, the UPRR ROW is within the highway corridor for a short length, although this is<br />
not a significant issue.<br />
Many of the parcels have recently been sold to investment companies and developers, and<br />
will likely be developed soon. The cost of these parcels will undoubtedly continue to<br />
escalate as development flourishes in this area. The economic feasibility of acquisition of<br />
these parcels for transit purposes has not been studied.<br />
A light rail or BRT corridor along the Union Pacific Railroad mainline between Arden and<br />
downtown Las Vegas could be accessed either via the segment of the railroad right-of-way<br />
between SR-160 and Arden, or via SR-160 itself east of the right-of-way’s crossing of SR-<br />
160. SR-160 will cross the UPRR mainline on a new aerial structure 1.7 miles east of where<br />
the UPRR’s <strong>Blue</strong> <strong>Diamond</strong> ROW crosses SR-160, and the highway right-of-way is 200 feet<br />
wide for the entire distance.<br />
6-15
6. SR-160 <strong>Corridor</strong> Improvement Plan RTC SR-160 <strong>Corridor</strong> <strong>Study</strong><br />
Parcel Owners<br />
EXHIBIT 6-14 indicates the ownership and zoning (as of 11/05) for the parcels along the<br />
former Union Pacific Railroad right-of-way:<br />
EXHIBIT 6-14: Parcel Owners along Union Pacific Right-of-Way<br />
No. Owner Zoning<br />
Size<br />
(acres)<br />
Most<br />
Recent<br />
Sale<br />
Price<br />
($M)<br />
Approx.<br />
% on<br />
ROW<br />
North of SR-160, listed west to east<br />
1 USA / BLM (Bureau of Land Mgmt.) H-2 25.6 - - 50<br />
2 Albert A Flangas H-2 1.12 Mar 05 $8.85 100<br />
3 USA / BLM H-2 10.6 - - 50<br />
4 Farmanali Family Trust H-2 4.68 Oct 05 $4.93 50<br />
5 E&C Verzilli Family Trust H-2 1.16 Jun 05 $2.04 100<br />
6 E&C Verzilli Family Trust H-2 1.25 Jun 05 $2.04 100<br />
7 E&C Verzilli Family Trust H-2 1.26 Jun 05 $2.04 100<br />
8 unknown R-3 N/A N/A N/A 100<br />
9 Aries Holding LLC H-2 1.38 N/A N/A 100<br />
10 Storybook Homes LLC H-2 3.88 Aug 05 $3.15 30<br />
11 Allay Investments LLC H-2 1.49 Aug 05 $0.81 100<br />
12 Allay Investments LLC H-2 1.57 Aug 05 $0.75 80<br />
13 Allay Investments LLC H-2 1.65 Aug 05 $0.77 80<br />
14 Allay Investments LLC H-2 4.16 Aug 05 $2.23 20<br />
15 <strong>Blue</strong> <strong>Diamond</strong> BLM LLC H-2 1.79 N/A N/A 40<br />
16 Aries Holding LLC H-2 1.86 N/A N/A 40<br />
17 Lucky <strong>Blue</strong> 007 LLC & M Peyman C-2 1.93 Jul 05 $0.96 30<br />
18 Lucky <strong>Blue</strong> 007 LLC & M Peyman C-2 2.0 Aug 05 $1.9 25<br />
19 Buffalo & <strong>Blue</strong> <strong>Diamond</strong> NE H-2 6.46 N/A N/A 5<br />
South of SR-160, listed north to south<br />
20 Mountains Edge LLC H-2 3.81 N/A N/A 20 *<br />
21 Mountains Edge LLC R-E 5.0 N/A N/A 30 *<br />
22 JV Properties LLC H-2 2.5 May 05 $1.1 10<br />
23 NATO Fund Inc R-E 2.5 Aug 05 $1.22 40<br />
24 Adams Linda Williams R-E 2.06 Jun 82 $0.12 40<br />
25 Lin Hwai Yu and Lun Chan R-E 2.0 Sep 04 $0.65 5<br />
26 Michael and Suzanne Hall R-E 0.64 Apr 80 $0.025 10<br />
27 Anderson and Zook R-E 2.07 Feb 97 $0.28 10<br />
28 D. Hilbrecht R-E 2.11 N/A N/A 5<br />
29 Rosanna & Gomer Investments R-E 2.5 Jan 04 $0.35 40<br />
30 Rainbow & Gomer Investments R-E 2.5 Jul 03 $0.55 40<br />
6-16
6. SR-160 <strong>Corridor</strong> Improvement Plan RTC SR-160 <strong>Corridor</strong> <strong>Study</strong><br />
No. Owner Zoning<br />
Size<br />
(acres)<br />
Most<br />
Recent<br />
Sale<br />
Price<br />
($M)<br />
Approx.<br />
% on<br />
ROW<br />
31 Gomer & Rainbow Investments R-E 2.12 Apr 04 $0.575 5<br />
32 Robert Hixon R-E 2.5 N/A N/A 10<br />
33 Ganesh LLC R-E 2.5 Apr 05 $1.9 10<br />
34/35 USA / BLM R-E > 400 - - **<br />
* The right-of-way splits some parcels into two sections that may or may not be usable.<br />
** This USA-owned property is comprised of two separate parcels. The ROW occupies a small percentage of this<br />
land.<br />
N/A = Information is not available.<br />
6-17
7. Proposed Park and Ride Facilities RTC SR-160 <strong>Corridor</strong> <strong>Study</strong><br />
7.0 PROPOSED PARK AND RIDE FACILITIES<br />
7.1 PARK & RIDE SITE AND DESIGN CRITERIA<br />
Experience with Park & Ride (P&R) sites nationwide has led to the development of criteria<br />
for their siting and design. A leading industry source for these criteria is the Guide for Park<br />
and Ride Facilities (November, 2004), published by the American Association of State<br />
Highway and <strong>Transportation</strong> Officials (AASHTO). The most relevant criteria for sites within<br />
the SR-160 corridor study area are those for location and configuration as listed below.<br />
7.1.1 Location<br />
The following criteria help determine the proper siting of Park & Ride facilities.<br />
<br />
<br />
<br />
<br />
<br />
<br />
<br />
<br />
<br />
<br />
Wherever possible, site Park & Ride lots on the inbound side of the arterial on which<br />
they are located. This preference results from most users perceiving inbound access<br />
efficiency to be more critical than outbound and they generally time their arrival at a<br />
Park & Ride close to the scheduled arrival time of their transit connection.<br />
Select Park & Ride lot locations that minimize automobile access time and serve the<br />
greatest possible population base that would use the site.<br />
Select Site Park & Ride lots that minimize the need to backtrack, i.e., drive away<br />
from the final destination, to get to the lots.<br />
Basic Park & Ride lots require the following footprints (including driveways and bus<br />
bays):<br />
– a lot with 550 parking spaces requires approximately 6 acres<br />
– a lot with 1100 parking spaces requires approximately 11 acres<br />
– a lot with 1900 parking spaces requires approximately 21 acres<br />
Locate Park & Ride lots along primary transit corridors, minimizing the amount of<br />
time a transit vehicle is not traveling in its primary direction.<br />
Arrange Park & Ride lots to minimize the impact on existing traffic patterns.<br />
Locate Park & Ride lots upstream of congestion and choke-points.<br />
Take advantage of freeways or main radial roadways as much as possible.<br />
Where feasible, take advantage of “opportunistic” or “joint-use” lots where parking<br />
facilities are shared with other activities, such as churches, theaters, and shopping<br />
areas.<br />
Ground slopes of up to 5 percent are acceptable for Park & Ride sites.<br />
7.1.2 Configuration<br />
The following criteria help guide Park & Ride facility design.<br />
7-1
7. Proposed Park and Ride Facilities RTC SR-160 <strong>Corridor</strong> <strong>Study</strong><br />
Limite the furthest walking distance from parking spaces to transit stops within a<br />
Park & Ride to less than 500 feet.<br />
Place vehicular access and egress points to Park & Ride lots at least 300 feet from<br />
the nearest intersection.<br />
Bus-only access and egress lanes to Park & Ride lots can be considered where<br />
feasible.<br />
Include Kiss-and-Ride provisions, pedestrian (up to 0.5 miles), and bicycle (2-5<br />
miles) access.<br />
Design Park & Ride lots to be no more than 85 percent full. Beyond this level, a lot<br />
is perceived to be full and is a deterrent to usage.<br />
7.1.3 Other Factors<br />
Although there is no specific guideline for the spacing of Park & Ride facilities, industry<br />
experience has also shown that 50 percent of a Park & Ride’s users drive less than 2.5 miles<br />
to their site, although this would not apply to the first lot along a route. Ultimately, the<br />
siting and spacing of Park & Ride facilities should be done in a way that provides the best<br />
balance of efficiency, cost-effectiveness, and usability.<br />
Park & Ride usage increases substantially when bus service is no less frequent than every<br />
15 minutes, especially when users can get to their destinations without having to transfer.<br />
Midday service also tends to enhance ridership, since users do not feel that they would be<br />
stranded if they need to return home in the middle of the day.<br />
It is critical that the overall financial cost to the user – parking fee (if any) plus fares – be<br />
competitive with the cost of driving.<br />
7.2 CANDIDATE PARK & RIDE SITES<br />
Undeveloped land parcels along SR-160 that could be considered for potential Park & Ride<br />
sites were placed into two categories:<br />
1. those that have changed ownership within the last five years, likely for development<br />
purposes, and<br />
2. those that are owned by either the government or by long-time private owners.<br />
Since there were a sufficient number of parcels in Category 2, which could potentially be<br />
more readily available at less expense than those in Category 1, parcels in the latter<br />
category were evaluated based on the criteria stated above and were divided into three<br />
groups based on their compliance with the criteria. The groups are:<br />
7-2
7. Proposed Park and Ride Facilities RTC SR-160 <strong>Corridor</strong> <strong>Study</strong><br />
1. Sites that meet all the location criteria,<br />
2. Good alternate sites that meet most of the location criteria, and<br />
3. Less desirable sites that may be acceptable only if more favorable sites are not<br />
available.<br />
Of the fourteen relevant Category 2 parcels that are located along SR-160, five are in Group<br />
1, four in Group 2, and five in Group 3. They are categorized as shown in EXHIBIT 7-1<br />
below, and located as shown in EXHIBIT 7-2 and EXHIBIT 7-3 that follow. Green (sites 1-1<br />
through 1-5) represents Group 1, yellow (sites 2-1 through 2-4) represents Group 2, and<br />
red (sites 3-1 through 3-5) represents Group 3. Within groups, parcels are listed from west<br />
to east.<br />
EXHIBIT 7-1: Candidate Park & Ride Sites<br />
Group ID Acres Owned by Nearest N/S street<br />
1-1 18 USA/BLM Hualapai<br />
1-2 10 USA/BLM Arlington Ranch<br />
Group 1: meet all criteria 1-3 200 USA/BLM Buffalo<br />
1-4 57 USA/BLM Torrey Pines<br />
1-5 13 <strong>Blue</strong> <strong>Diamond</strong> Ranch Decatur<br />
2-1 11 USA/BLM Hualapai<br />
Group 2: meet most criteria<br />
2-2 11 USA/BLM Durango<br />
2-3 16 <strong>Blue</strong> <strong>Diamond</strong> Ranch Decatur<br />
2-4 40 CC Dept. of Aviation Valley View<br />
3-1 32 USA/BLM Grand Canyon<br />
3-2 26 USA/BLM Ft. Apache<br />
Group 3: less favorable sites 3-3 77 USA/BLM Belcastro<br />
3-4 28 USA/BLM Torrey Pines<br />
3-5 48 CC Dept. of Aviation Arville<br />
EXHIBIT 7-2: S. Hualapai Way to S. Rainbow Blvd.<br />
Hualapai<br />
Durango<br />
Buffalo<br />
7-3
7. Proposed Park and Ride Facilities RTC SR-160 <strong>Corridor</strong> <strong>Study</strong><br />
EXHIBIT 7-3: S. Rainbow Blvd. to I-15<br />
Jones<br />
Rainbow<br />
Decatur<br />
Dean Martin<br />
Appendix B provides detailed information on the characteristics of all fourteen potential Park<br />
& Ride parcels.<br />
Since the analysis found a sufficient number of acceptable Category 2 parcels that are<br />
owned by the government or long-term owners, an evaluation of recently-purchased parcels<br />
was not deemed necessary and was not conducted.<br />
7.3 RECOMMENDED PARK & RIDE SITES<br />
Further analysis of the availability, attributes, and benefits of the fourteen candidate sites<br />
resulted in the selection and detailed study of three recommended Park & Ride locations<br />
within the study corridor. These locations are:<br />
South of SR-160, immediately east of S. Hualapai Way (Site 1-1),<br />
Both north and south of SR-160, west of S. Durango Drive (Sites 1-2 and 2-2), and<br />
South of SR-160, at S. Torrey Pines Drive (part of Site 1-4).<br />
All three sites contain government-owned parcels that are in Group 1.<br />
distributed on the corridor, as shown in EXHIBIT 7-4 and EXHIBIT 7-5 below.<br />
They are well<br />
7-4
7. Proposed Park and Ride Facilities RTC SR-160 <strong>Corridor</strong> <strong>Study</strong><br />
EXHIBIT 7-4: S. Hualapai Way to S. Rainbow Blvd.<br />
West of S. Durango Drive<br />
(Sites 1-2, 2-2)<br />
Hualapai<br />
East of S. Hualapai Way<br />
(Site 1-1)<br />
SR-160<br />
Durango<br />
Buffalo<br />
Rainbow<br />
EXHIBIT 7-5: S. Rainbow Blvd. to I-15<br />
Decatur<br />
Dean Martin<br />
I-15<br />
SR-160<br />
Rainbow<br />
Torrey Pines<br />
Jones<br />
At S. Torrey Pines Drive<br />
(Site 1-4)<br />
On SR-160 east of S. Decatur Drive, there is a significant amount of currently undeveloped<br />
land owned by the Clark County Department of Aviation. Although some of this land could<br />
be considered for Park & Ride sites, for the foreseeable future there will be no major<br />
residential communities in the area due to the flight paths from McCarran Airport, and these<br />
parcels were thus not deemed worthwhile sites for large Park & Ride facilities at this time.<br />
They could, however, have on-street bus stops with adjacent parking, as discussed in<br />
Section 7.5.<br />
7-5
7. Proposed Park and Ride Facilities RTC SR-160 <strong>Corridor</strong> <strong>Study</strong><br />
The US Bureau of Land Management (BLM), the owner of the land at the three proposed<br />
Park & Ride sites, is under no obligation to make this land available to the RTC for Park &<br />
Ride use. In fact, according to review of BLM land parcel records, two of the sites (1-2/2-2<br />
and 1-4) are already reserved for workforce housing and/or schools. Rather than being a<br />
negative factor, this could provide an opportunity for Clark County to implement Transit<br />
Oriented Development (TOD) communities around or above the Park & Ride facilities, which<br />
could include housing, small retail outlets, day care facilities, etc. Further discussion of this<br />
subject is contained in Section 7.4, Land Acquisition Options.<br />
At some locations, privately-owned parcels adjacent to the Park & Ride facilities could<br />
become “land locked” without access to public roads. Under these circumstances, specific<br />
access or easements to nearby streets must be provided. This would be addressed on a<br />
case-by-case basis.<br />
All Park & Ride facilities would be lighted and landscaped, and be equipped with shelters,<br />
restroom facilities, maps/schedules, pay telephones, bike racks and/or lockers, a kiss-andride<br />
area, and disabled parking.<br />
Details regarding the three proposed Park & Ride sites are as follows.<br />
7.3.1 SR-160 east of S. Hualapai Way<br />
Reference No.: 1-1<br />
Size:<br />
17.7 acres (total)<br />
Owner:<br />
USA / BLM<br />
Parcel Number: 176-19-101-011 (govt lot 17 & pt govt lot 16)<br />
176-19-101-013 (pt govt lot 19 & pt govt lot 20)<br />
176-19-201-001 (pt SW4 NW4 sec 19 22 60)<br />
7-6
7. Proposed Park and Ride Facilities RTC SR-160 <strong>Corridor</strong> <strong>Study</strong><br />
EXHIBIT 7-6: Park & Ride Site 1-1<br />
Hualapai Way<br />
Park-&-Ride<br />
This 17¾ acre site is at the extreme western end of the study area. The Park & Ride would<br />
initially be used primarily by people coming from Pahrump and the western <strong>Blue</strong> <strong>Diamond</strong><br />
area, although there are plans for housing developments to eventually extend west to<br />
Hualapai. The site consists of three parcels, two small ones which front on SR-160 and one<br />
larger one immediately to the south.<br />
Funds are being sought from the Nevada Department of <strong>Transportation</strong> to provide bus<br />
service from Park & Ride facilities in Pahrump to the South Strip Transfer Terminal in Las<br />
Vegas. Any direct transit service from Pahrump to Las Vegas would likely lessen the initial<br />
importance and usage of this particular Park & Ride site.<br />
This land is virtually flat and completely undeveloped at this time, as shown in EXHIBIT 7-7<br />
and EXHIBIT 7-8 below. The Clark County aerial photograph was taken in September,<br />
2005, and shows the three parcels that comprise this site: 176-19-101-011 (1.6 acres),<br />
176-19-101-013 (1.73 acres), and 176-19-201-001 (14.42 acres). The ground-level shot,<br />
looking toward the southeast, was taken in May, 2006. The site analysis did not determine<br />
whether any utilities are currently available.<br />
7-7
7. Proposed Park and Ride Facilities RTC SR-160 <strong>Corridor</strong> <strong>Study</strong><br />
EXHIBIT 7-7: Aerial Photo, with Parcels, of P&R Site 1-1<br />
EXHIBIT 7-8: P&R Site 1-1 Facing Southeast<br />
7-8
7. Proposed Park and Ride Facilities RTC SR-160 <strong>Corridor</strong> <strong>Study</strong><br />
The proposed configuration of this facility is shown in EXHIBIT 7-9.<br />
As the end-of-line facility, all RTC buses would arrive from and depart to the east. Bus<br />
entry to this site is via Hualapai Way, and they would depart directly onto SR-160 for their<br />
eastbound runs toward Las Vegas. Automobiles would access the facility via either Hualapai<br />
Way or Conquistador <strong>Road</strong> No traffic signal is currently envisaged for either intersection.<br />
Being the terminal stop for RTC bus operations, buses would layover at this location.<br />
Secured break and restroom facilities would be provided for bus operators.<br />
A privately-owned 2.15 acre parcel is surrounded by the Park–and-Ride facility on three<br />
sides and SR-160 on the north. This land, Clark County parcel number 176-19-101-012<br />
which is owned by <strong>Blue</strong> <strong>Diamond</strong> & Hualapai LLC and Encore Homes LLC, would require<br />
direct access to SR-160 unless NDOT requires that access be provided via the Park & Ride.<br />
The proposed configuration would initially contain 777 parking stalls (40 of which are<br />
handicapped spaces), three bus bays in each direction (although bi-directional use is not<br />
initially contemplated), a kiss-and-ride area, and ancillary facilities within 12.8 acres at the<br />
north end of the site. Space for an additional 593 spaces is available at the south end of<br />
the property for parking expansion if necessary.<br />
7-9
7. Proposed Park and Ride Facilities RTC SR-160 <strong>Corridor</strong> <strong>Study</strong><br />
EXHIBIT 7-9: Park & Ride 1-1 Configuration<br />
7-10
7. Proposed Park and Ride Facilities RTC SR-160 <strong>Corridor</strong> <strong>Study</strong><br />
7.3.2 SR-160 west of S. Durango Drive<br />
Reference No.: 1-2 and 2-2<br />
Size:<br />
9.6 acres south of SR-160, 10.6 acres north<br />
Owner:<br />
USA / BLM<br />
Parcel Numbers: 176-20-601-009 (pt S2 NE4 sec 20 22 60) (south)<br />
176-20-601-014 (pt N2 sec 20 22 60) (north)<br />
A Park & Ride facility near<br />
Durango Drive is valuable<br />
due to the large Mountain’s<br />
Edge and Arlington Ranch<br />
developments south of<br />
SR-160, and Westchester<br />
Hills and Rhodes Ranch to<br />
the north. To the north of<br />
SR-160, Durango will be<br />
widened to become a<br />
major north-south arterial.<br />
The current land mapping<br />
in this area is reflected in<br />
the Clark County plan<br />
dated May, 2006, shown in<br />
EXHIBIT 7-10.<br />
EXHIBIT 7-10: Residential Density at SR-160 /<br />
Durango<br />
Durango<br />
SR-160<br />
EXHIBIT 7-11: Park & Ride Site 1-2/2-2<br />
Park-&-<br />
Ride<br />
Park-&-Ride<br />
Located 1.9 miles east of Park & Ride Site 1-1, this Park & Ride facility immediately west of<br />
S. Durango Drive would consist of two parcels, one north of SR-160 and one south, with the<br />
7-11
7. Proposed Park and Ride Facilities RTC SR-160 <strong>Corridor</strong> <strong>Study</strong><br />
two sites connected by a pedestrian bridge.<br />
without having to use or cross SR-160.<br />
Automobiles could access the Park & Ride<br />
EXHIBIT 7-12: Aerial Photo, with Parcels, of P&R Site 1-2/2-2<br />
EXHIBIT 7-13: P&R Site 1-2 Facing West<br />
The configuration of this facility is shown in EXHIBIT 7-14.<br />
7-12
7. Proposed Park and Ride Facilities RTC SR-160 <strong>Corridor</strong> <strong>Study</strong><br />
Eastbound buses would enter the south-side facility via a dedicated driveway from SR-160,<br />
service the facility, and re-enter eastbound SR-160 in a queue-jumping lane at the Durango<br />
Drive intersection. Westbound buses would use a queue-jumping lane to cross Durango and<br />
enter the north-side facility via a dedicated driveway, after which they would re-enter the<br />
westbound traffic lanes of SR-160.<br />
Automobiles would access the south-side facility via driveways on either Arlington Ranch<br />
<strong>Road</strong> or SR-160. Durango Drive could also be directly accessed if a mutual access<br />
easement is obtained from the owner of the undeveloped property immediately to the east,<br />
which is currently <strong>Diamond</strong> PHD LLC. The north-side facility would be accessed via<br />
Durango.<br />
The pedestrian bridge would be equipped with stairs and either ramps (preferred) or<br />
elevators for ADA compliance. Transit riders who park at the facility would generally have<br />
to cross SR-160 either via the bridge or at the signaled Durango intersection once per round<br />
trip.<br />
The facility north of SR-160 would have 713 parking spaces (including 20 handicapped),<br />
while there would be 648 spaces south of SR-160 (30 handicapped). There is no room for<br />
further expansion of either segment of the facility without the acquisition of privately-owned<br />
land.<br />
7-13
7. Proposed Park and Ride Facilities RTC SR-160 <strong>Corridor</strong> <strong>Study</strong><br />
EXHIBIT 7-14: Park & Ride 1-2/2-2 Configuration<br />
POTENTIAL FOR<br />
MUTUAL ACCESS<br />
EASEMENT<br />
7-14
7. Proposed Park and Ride Facilities RTC SR-160 <strong>Corridor</strong> <strong>Study</strong><br />
7.3.3 SR-160 between Rainbow and Torrey Pines<br />
Reference No.: 1-4<br />
Size:<br />
~65 acres (total)<br />
Owner:<br />
USA / BLM<br />
Parcel Numbers: 176-23-601-017 (pt N2 sec 23 22 60)<br />
176-23-201-003 (pt S2 N2 sec 23 22 60)<br />
EXHIBIT 7-15: Park & Ride Site 1-4<br />
Park-&-Ride<br />
This Park & Ride facility, located 2.5 miles east of Site 1-2/2-2, would initially occupy<br />
approximately 15.8 acres of land between Redwood Street and S. Torrey Pines Drive, which<br />
is located at the southwest corner of the 57.11 acre Clark County parcel 176-23-601-017.<br />
Should additional parking eventually be required, an additional 4.5 acres is available east of<br />
Torrey Pines in the same parcel, with another 4+ acres east of Torrey Pines in parcel<br />
176-23-201-003 northeast of the original site.<br />
The southwest corner of the facility would be located at the corner of Redwood Street and<br />
W. Serene Avenue. W. Serene Avenue provides access to S. Rainbow Boulevard, which<br />
connects to SR-160 at a signaled intersection. The east end of the facility would connect to<br />
SR-160 via S. Torrey Pines Drive at a signaled intersection 13 .<br />
At this time, the parcel is flat and is completely undeveloped. However, RTC is working with<br />
the Clark County Redevelopment Agency to develop workforce housing and shared parking<br />
facilities adjacent to the currently proposed school site. The current condition of the portion<br />
that is to be used for the Park & Ride is shown in EXHIBIT 7-16 and EXHIBIT 7-17 below,<br />
13 Although the SR-160 / Torrey Pines intersection is not currently programmed to be signaled, NDOT expects it to<br />
qualify prior to the completion of highway improvements.<br />
7-15
7. Proposed Park and Ride Facilities RTC SR-160 <strong>Corridor</strong> <strong>Study</strong><br />
with the Clark County aerial shot taken in September, 2005, and the ground-level picture,<br />
looking northwest from Serene and Torrey Pines, in May, 2006. The dedicated right-of-way<br />
along the southern bound of the north parcel may provide a corridor for access from the<br />
housing, so that both parcels could be accessible from the planned housing location.<br />
EXHIBIT 7-16: Aerial Photo, with Parcels, of P&R Site 1-4<br />
EXHIBIT 7-17: P&R Site 1-4 Facing Northwest<br />
7-16
7. Proposed Park and Ride Facilities RTC SR-160 <strong>Corridor</strong> <strong>Study</strong><br />
The configuration of this facility is shown in EXHIBIT 7-19.<br />
The Park & Ride could initially contain 808 parking places (including 52 handicapped), six<br />
bus bays (three in each direction), a kiss-and-ride area, and amenities within a 15.5 acre<br />
site. Space would be available for an additional 619 parking places in two sites to the east<br />
of the initial sites.<br />
Westbound buses would turn left from<br />
SR-160 in a left turn lane at the signaled<br />
S. Torrey Pines intersection, and proceed<br />
south on S. Torrey Pines into the Park &<br />
Ride. They would exit the Park & Ride<br />
westbound on Serene Avenue, turn north<br />
onto Rainbow Boulevard, and west onto<br />
SR-160 at a signaled intersection.<br />
Eastbound buses would follow the same<br />
path in the opposite direction. These<br />
routes, which are shared with automobiles,<br />
are shown in yellow in EXHIBIT 7-18.<br />
EXHIBIT 7-18: Bus Route Through P&R<br />
Site 1-4<br />
Bus route<br />
The direct connection to Rainbow Boulevard is beneficial because Rainbow marks the<br />
eastern edge of the Mountain’s Edge community. There will be several good east-west<br />
roads through the community that would enable Mountain’s Edge residents to access the<br />
Park & Ride facility without having to cross or travel on SR-160 in either direction, which is<br />
a major benefit.<br />
S. Torrey Pines Drive will be the interim means of accessing Jones Boulevard to the north<br />
from SR-160 until the intersection atop the UPRR flyover structure is completed in that<br />
direction. The green route shown exiting the Park & Ride to the south on Redwood Street<br />
connects to Silverado Ranch <strong>Road</strong>, which is planned to be upgraded in the future, including<br />
a grade separation of the Union Pacific Railroad tracks, a Park & Ride facility at Dean Martin<br />
Drive, and another direct connection to the Mountain’s Edge community.<br />
7-17
7. Proposed Park and Ride Facilities RTC SR-160 <strong>Corridor</strong> <strong>Study</strong><br />
EXHIBIT 7-19: Park & Ride 1-4 Configuration<br />
7-18
7. Proposed Park and Ride Facilities RTC SR-160 <strong>Corridor</strong> <strong>Study</strong><br />
7.4 LAND ACQUISITION OPTIONS<br />
The four recommended Park & Ride facilities adjacent to SR-160 are on property managed<br />
by the United States Bureau of Land Management (BLM). A review of the BLM Nevada<br />
Lands Records on May 19, 2006, indicates that the BLM parcels preferred for Park & Ride<br />
facilities contain the rights-of-way and pending reservations as shown in EXHIBIT 7-20.<br />
EXHIBIT 7-20: BLM Rights-of-Way and Reservations for Park & Ride Facilities<br />
BLM<br />
Rights-of-Way<br />
Parcel<br />
1-1 5427 – authorized telephone/telegraph,<br />
10 feet wide<br />
3983 - authorized telephone/telegraph,<br />
10 feet wide<br />
60107 – authorized oil and gas pipeline,<br />
40 feet wide<br />
76038 - authorized water facility – 60<br />
feet wide<br />
1-2 1871 – authorized telephone/telegraph,<br />
10 feet wide<br />
60107 - authorized oil and gas pipeline,<br />
40 feet wide<br />
78316 – authorized power trans, 10 feet<br />
wide<br />
7099– authorized telephone/telegraph,<br />
width varies<br />
2-2 60682 – pending road, width varies<br />
76127 - authorized water facility,17 - 32<br />
feet wide<br />
1-4 39876 – authorized power trans, 5 feet<br />
wide<br />
75412 – authorized power trans, 10 feet<br />
wide<br />
285003 – authorized power trans, 6 feet<br />
wide<br />
75198 – authorized road, width varies<br />
61478 - authorized road, 30 feet wide<br />
Reservations<br />
Government Lot 32 –<br />
identified for public sale<br />
77376 – Pending<br />
Affordable Housing<br />
77376 – Pending<br />
Affordable Housing<br />
77376 – Pending<br />
Affordable Housing<br />
77377 – Pending<br />
Affordable Housing<br />
77378 – Pending Clark<br />
County School District<br />
The following three options for obtaining these BLM-managed parcels were discussed via<br />
personal communiqués with BLM Las Vegas Field Office Supervisory Realty Specialist Anna<br />
Wharton in May, 2006:<br />
Right-of-Way (ROW): BLM can issue a ROW to any individual, company, or<br />
organization at the discretion of the authorized officer. As authorized by the Federal<br />
Land Policy and Management Act, BLM can issue ROW grants for facilities or systems<br />
that are in the public interest. A ROW is for a specific purpose, and a specific time,<br />
typically 30 years, and most can be renewed. Per Ms. Wharton, obtaining the land<br />
7-19
7. Proposed Park and Ride Facilities RTC SR-160 <strong>Corridor</strong> <strong>Study</strong><br />
for the Park & Ride facilities through an ROW is the preferred method as the process<br />
can begin immediately. In addition, because the RTC is a regional government<br />
agency (http://www.rtcsouthernnevada.com/rtc), no application, monitoring, or rental fee<br />
is required.<br />
<br />
The Recreation and Public Purposes Act (R&PP): R&PP authorizes lease or sale<br />
of public land for recreational or public purposes to State and local governments and<br />
to qualified nonprofit organizations. Ms. Wharton stated that the RTC itself is not<br />
eligible for purchasing land under the R&PP; however, the land could be purchased<br />
by Clark County.<br />
<br />
Direct Sales: According to Ms. Wharton, it would be difficult for the RTC to obtain<br />
BLM land under a non-competitive bid. Under 43 CFR 11 Part 27113-3, direct sales,<br />
without competition, may be utilized, when, in the opinion of the authorized officer,<br />
“the public interest would best be served by a direct sale.” Although examples of<br />
appropriate sales are included in the regulations and appear applicable, per Ms.<br />
Wharton, they are usually not granted because of overriding sales requirements in<br />
the Southern Nevada Public Lands Management Act (SNPLMA).<br />
7.5 BUS STOPS<br />
In addition to the Park & Ride facilities, curbside bus stops will be provided in locations<br />
where residential density is lower, where there is already parking available, or where land<br />
for a Park & Ride facility is not available.<br />
RTC Policies and Procedures (latest revision 3/9/06) states, in part, “On RTC-funded<br />
projects where full street improvements are to be constructed, bus turnouts shall be<br />
constructed for future bus routes at locations determined in accordance with Section B.2.a<br />
of this policy.” Although the SR-160 improvement project is not funded by the RTC, NDOT<br />
normally accommodates RTC configuration standards within the Las Vegas area, and RTC is<br />
working with NDOT and Clark County to ensure provisions are made for bus stop turnouts<br />
along the SR-160 corridor. The relevant section of the RTC Policies and Procedures<br />
document, along with turnout configuration drawings adopted by Clark County, is contained<br />
in Appendix D. In addition, the Uniform Standard Drawings for bus pullouts apply to all<br />
developments abutting arterial roadways and major corridors. Per the Uniform Standard<br />
Drawings, bus stops will be required at the far side of all major arterial intersections.<br />
On SR-160 east of S. Decatur Drive, there will be major retail centers rather than large<br />
residential developments and on-street bus stops would likely be provided in lieu of Park &<br />
Ride facilities. The retail centers, with their significant parking capacity, can complement<br />
the RTC-mandated bus stops in two ways:<br />
7-20
7. Proposed Park and Ride Facilities RTC SR-160 <strong>Corridor</strong> <strong>Study</strong><br />
Local residents who do not live along bus routes could use some of the parking<br />
spaces at these retail centers to access bus services, and<br />
Local residents who live along bus routes could take public transit to the retail<br />
centers.<br />
Whereas the Park & Ride facilities would be served by local, express, and BRT bus routes, it<br />
is likely that most on-street bus stops would generally only be serviced by local routes.<br />
Three representative locations for bus stops have been identified.<br />
7.5.1 SR-160 at S. Buffalo Drive<br />
S. Buffalo Drive is in the middle of the Mountain’s Edge development and is adjacent to the<br />
Exploration Peak Park on the south side of SR-160. Eastbound and westbound bus stops on<br />
SR-160 at the signaled intersection with S. Buffalo Drive could provide some transit benefit<br />
at little cost and without interfering with traffic lanes. (See EXHIBIT 7-21.)<br />
EXHIBIT 7-21: Facing West From SR-160 at Buffalo<br />
Alternatively, there is a large parking lot for Exploration Peak Park on Buffalo less than<br />
½ mile south of SR-160. Since this lot is generally underutilized on weekdays, the<br />
developers at Mountain’s Edge could make this lot available as a Park & Ride facility, and in<br />
fact a bus stop adjacent to the lot already exists. Not being located directly on SR-160,<br />
however, it would add to the running time of express bus or BRT service along the corridor.<br />
7.5.2 SR-160 at Arville Street<br />
Arville Street, located approximately 0.6 miles east of Decatur Boulevard, will likely become<br />
a signaled intersection at SR-160.<br />
With some smaller developments nearby, bus stops<br />
7-21
7. Proposed Park and Ride Facilities RTC SR-160 <strong>Corridor</strong> <strong>Study</strong><br />
could be beneficial in this area. Unless easements can be obtained, these bus stops would<br />
be within one of the general traffic lanes due to SR-160 having eight lanes in a 150 foot<br />
right-of-way through this area.<br />
7.5.3 S. Decatur Boulevard near W. Robindale <strong>Road</strong> and W. Windmill Lane<br />
Bus routes that use Decatur rather than the eastern segment of SR-160 will pass smaller<br />
developments that warrant bus stops. The right-of-way is sufficiently wide to accommodate<br />
bus stops in both directions without impacting through traffic. The area between the<br />
intersections at Robindale <strong>Road</strong> and Windmill Lane, approximately one mile north of SR-160<br />
is an appropriate site for northbound and southbound bus stops (See EXHIBIT 7-222).<br />
EXHIBIT 7-22: Facing North on Decatur Boulevard at Windmill Lane<br />
The feasibility of providing more significant transit facilities in the vicinity of Decatur<br />
Boulevard and Warm Springs <strong>Road</strong> could be limited by the Rural Neighborhood Preservation<br />
area.<br />
7-22
8. Estimated System Costs RTC SR-160 <strong>Corridor</strong> <strong>Study</strong><br />
8.0 COST ESTIMATES FOR TRANSIT ALTERNATIVES<br />
This section provides capital and operating cost estimates for each of the transit alternatives<br />
under consideration for the SR-160 corridor. For each of the alternatives – Alternative 1<br />
high build and Alternative 2 low build – costs are provided for three time horizons: 1) 2008,<br />
2) 2015, and 3) 2025, for a total of six transit alternatives. Capital estimates are provided<br />
first for each of the six alternatives, followed by annual operating costs for each alternative.<br />
8.1 CAPITAL COST ESTIMATES<br />
8.1.1 Overview of Capital Cost Benchmarks<br />
Capital costs are an important component<br />
in assessing the suitability of a given<br />
modal technology to the ridership<br />
characteristics of a given corridor.<br />
Conventional Bus Transit<br />
Standard 40-ft bus currently in use on CAT service<br />
Conventional fixed route bus service is a<br />
low-cost system that operates on mixed<br />
traffic streets, roads and highway without<br />
any special running way requirements.<br />
The basic requirement for fixed route bus service is a roadway and locations to stop and<br />
service passengers. Bus stops often include information indicating the carrier, the location<br />
of the bus stop, route alignment and the schedule. Typically, stops served by conventional<br />
fixed route bus lines with high ridership are provided with a protective shelter with seating<br />
and more transit information. Where no roadway investment is required, the only additional<br />
cost that may be incurred is the purchase of new transit vehicles where spare vehicles are<br />
not available. Conventional bus service could be provided on the corridor at minimal cost<br />
Bus stops can be located where desired along SR-160 by the placement of simple signs and<br />
benches, and buses can be purchased or redeployed to support the service. This could be<br />
an appropriate “first step” prior to providing a more elegant transit solution.<br />
Bus Rapid Transit (BRT)<br />
RTC has already implemented one bus rapid transit line in the Las Vegas Region. CAT<br />
operates RTC Southern Nevada’s Metropolitan Area Express (MAX) route, which travels<br />
northeast from the Downtown <strong>Transportation</strong> Center (DTC) to North Las Vegas along North<br />
Las Vegas Boulevard. The MAX system includes a curbside lane reserved for operation of<br />
transit vehicles and turning vehicles. Stations are generally spaced between 0.75 and 1.0<br />
miles apart. Station architecture includes a canopy for weather and sun protection, map<br />
cases, fare vending machines, vending machines for beverages, and seating. MAX<br />
8-1
8. Estimated System Costs RTC SR-160 <strong>Corridor</strong> <strong>Study</strong><br />
functions as a rapid transit overlay onto the local CAT transit services in North Las Vegas<br />
and more specifically Route 113, the local bus route operating along Las Vegas Boulevard<br />
North.<br />
EXHIBIT 8-1 provides a cost summary by element of MAX. MAX system costs serve as a<br />
logical starting point for estimating BRT implementation costs because fixed assets,<br />
operational parameters, and rolling stock requirements for BRT alternatives under<br />
consideration for the SR-160 corridor are similar to the MAX system.<br />
EXHIBIT 8-1: Summary of MAX Project Costs<br />
Project Element<br />
Total Cost<br />
% of Total<br />
Cost<br />
Civis Vehicle<br />
Vehicle & Systems (10 Total) - Irisbus $ 11,960,386 58.9%<br />
Vehicle Mfg Inspection - TRC/Semaly $ 340,760 1.7%<br />
Passenger Shelters<br />
Engineering Services - Stanley Consultants $ 1,150,966 5.7%<br />
Construction Bid (West Coast Contractors) $ 4,152,259 20.5%<br />
Guidance Markings $ 55,532 0.3%<br />
Miscellaneous $ 15,530 0.1%<br />
Dynamic Message Signs<br />
Passenger Information Displays $ -<br />
0.0%<br />
Ticket Vending Machines<br />
Production & Installation - GenFare Inc. $ 1,900,000 9.4%<br />
Fare Collection Design $ 200,000 1.0%<br />
Radio Communications/AVL<br />
Radio/AVL/APC Installation - Orbital $ 298,810 1.5%<br />
Transit Signal Priority<br />
Implementation Strategy & Analysis $ 26,026 0.1%<br />
Traffic Signal Equipment - 3M $ 120,000 0.6%<br />
Vehicle Emitters - 3M $ 10,945 0.1%<br />
Signal Controller Software Mods - GTS $ -<br />
0.0%<br />
Data Collection & Mgmt - Econolit/TrafficWerks $ 59,200 0.3%<br />
TOTAL $ 20,290,414<br />
The total project capital cost was approximately $20.3M (or $2.6M/mile). This total cost<br />
per alignment mile (not directional route mile) is on the lower end of the typical project<br />
scale for in-street mixed traffic alignments. The main reason the total project cost was<br />
comparatively low is because RTC did not incur any right-of-way acquisition or improvement<br />
costs. These were covered through the availability of the wide existing alignment profile<br />
and the right-of-way ownership by Nevada Department of <strong>Transportation</strong> (NDOT). Similar<br />
right-of-way availability is anticipated for the SR-160 corridor.<br />
The largest project cost was the BRT vehicles, which represented approximately 59 percent<br />
of the total project cost. The next largest project element was the engineering and<br />
construction of the MAX stations (20.5 percent), followed by the acquisition and installation<br />
of the ticket vending machines (9.4 percent). Much of the traffic signal equipment was in<br />
8-2
8. Estimated System Costs RTC SR-160 <strong>Corridor</strong> <strong>Study</strong><br />
place before the MAX project. Therefore, the cost for the additional TSP, vehicle emitter<br />
equipment, and installations was only $216,171. The communications system and the<br />
associated vehicle location and passenger counting systems were installed for a combined<br />
cost of $298,810. These systems acquisition and installation costs were also relatively low.<br />
Soft costs (including administration, agency and consultant costs) were not estimated for<br />
the project costs and not included in EXHIBIT 8-1.<br />
8.1.2 Alternative 1 –High Growth<br />
While MAX project costs provide a baseline for estimating capital costs for the SR-160<br />
corridor BRT alternatives, costs for the SR-160 corridor will be higher largely due to the<br />
acquisition, design, and construction of Park & Ride facilities at two of the alignment’s five<br />
proposed BRT stations and additional transit signal priority costs along the corridor where<br />
such advances are not expected to be in place as they were for MAX.<br />
A range of costs is provided for each alternative, reflecting variability in two cost elements:<br />
1) whether additional 40 foot coaches would need to be purchased for conventional bus<br />
transit services or service could be provided using the current CAT vehicle fleet, and 2) how<br />
the property would be acquired from the Bureau of Land Management (BLM) for two Park &<br />
Ride facilities along the BRT route. Alternatives for acquiring the land from BLM result in<br />
very different costs for the corridor. If RTC can obtain a Right-of-Way (ROW) agreement<br />
from BLM for the required land, RTC would incur virtually no costs paying only nominal<br />
processing fees for the application review and ongoing monitoring. Outright purchase of the<br />
land in question results in the highest costs identified and is based on current Clark County<br />
assessed values on the land parcels in question.<br />
EXHIBIT 8-2 provides an estimate of the capital costs for Alternative 1 alternatives. Capital<br />
costs for both Options 1 and 2 increase dramatically in the year during which BRT service is<br />
implemented – 2015 for Alternative 1 and 2025 for Alternative 2, reflecting the higher level<br />
of capital investment required for such service. Note that capital costs are presented in<br />
total for each horizon year, and include the costs for investment that may have occurred in<br />
an earlier year. For example, costs for Alternative 1 (2015) are inclusive of costs required<br />
to implement Alternative 1 (2008) so that each alternative can be evaluated in its entirety<br />
rather than as an increment to full build-out in 2025.<br />
8-3
8. Estimated System Costs RTC SR-160 <strong>Corridor</strong> <strong>Study</strong><br />
EXHIBIT 8-2: Alternative 1 – High Growth, Capital Costs<br />
Alternative 1 –<br />
2008<br />
(’06 $)<br />
Alternative 1 –<br />
2015<br />
(’06 $)<br />
Alternative 1 –<br />
2025<br />
(’06 $)<br />
Guideway Costs<br />
Re-striping/Transit Signal Priority -- $500,000 $500,000<br />
Acquisition -- -- --<br />
Subtotal: Guideway Costs -- $500,000 $500,000<br />
Vehicle Costs<br />
40’ Coaches $0 - $5,250,000<br />
(15 coaches)<br />
$0 - $3,500,000<br />
(10 coaches)<br />
$0 - $5,950,000<br />
(17 coaches)<br />
Station Costs<br />
BRT Vehicles (8 vehicles) -- $10,480,000 $10,480,000<br />
$10,480,000 - $10,480,000 -<br />
Subtotal: Vehicles $0-$5,250,000<br />
$13,980,000 $16,430,000<br />
Park & Ride Stations (2) -- $7,000,000 $7,000,000<br />
Land Acquisition -- $0 - $28,612,000 $0 - $28,612,000<br />
Intermediate Stations (3) -- $3,750,000 $3,750,000<br />
Surface Parking (at P&R stations) -- $1,200,000 $1,200,000<br />
Other Costs<br />
Bus Stop Amenities $26,000 $27,000 $50,000<br />
Subtotal: Station Costs $26,000<br />
$11,977,000 -<br />
$40,589,000<br />
$12,000,000 -<br />
$40,612,000<br />
Maintenance/Storage Costs -- $500,000 $500,000<br />
Ticket Vending Machines -- $560,000 $560,000<br />
Operations Control -- $250,000 $250,000<br />
Subtotal: Other Costs -- $860,000 $860,000<br />
Cost Contingencies<br />
Program Implementation<br />
Guideway Costs (10%) -- $50,000 $50,000<br />
Design/Construction (25%) -- $2,994,250 $3,000,000<br />
Vehicle Costs (10%) $0 - $525,000<br />
Subtotal: Cost Contingencies $0 - $525,000<br />
$1,048,000 -<br />
$1,398,000<br />
$4,092,250 -<br />
$4,443,000<br />
$1,048,000 -<br />
$1,643,000<br />
$4,098,000 -<br />
$4,693,000<br />
Design/Construction (31%) -- $3,713,000 $3,713,000<br />
Guideway (15%) -- $75,000 $75,000<br />
Vehicle Procurement (5%) $0 -$262,500 $524,000 - $699,000 $524,000 - $821,500<br />
Project Reserve (10%)<br />
Subtotal: Program Implementation<br />
TOTAL<br />
$2,600 - $580,100<br />
$2,600 –<br />
$842,600<br />
$28,600 -<br />
$6,643,600<br />
$2,790,925 -<br />
$6,037,200<br />
$7,103,000 -<br />
$10,524,200<br />
$35,012,250 -<br />
$70,896,200<br />
$2,793,800 -<br />
$6,309,500<br />
$7,105,800 -<br />
$10,919,000<br />
$35,043,800 -<br />
$74,014,000<br />
8-4
8. Estimated System Costs RTC SR-160 <strong>Corridor</strong> <strong>Study</strong><br />
Alternatives 1 (2015) and 1 (2025) which vary only by the level of conventional bus transit<br />
provided have the same lower bound capital cost estimate which assumes there is no need<br />
to purchase additional 40’ coaches for conventional bus services. The roughly $2.5 million<br />
difference in the upper bound estimate for these two alternatives reflects the additional<br />
costs of 40’ coaches in Alternative 1 (2025) which provides a greater level of conventional<br />
bus transit services.<br />
8.1.3 Alternative 2 – Moderate Growth<br />
Like Alternative 1 – High Growth, Alternative 2 – Moderate Growth costs are provided as<br />
ranges reflecting variability in two cost elements: 1) the need to purchase additional 40<br />
foot coaches, and 2) how the property for Park & Ride facilities would be acquired from<br />
BLM. EXHIBIT 8-3 provides an estimate of the capital costs for Alternative 2 – Moderate<br />
Growth. Capital costs for Alternative 2 increase dramatically in 2025 - the year during<br />
which BRT service is implemented. Like costs for Alternative 1, capital costs for Alternative<br />
2 are presented in total for each horizon year, and include the costs for investment that<br />
may have occurred in an earlier year. For example, costs for Alternative 2 (2025) are<br />
inclusive of costs required to implement Alternative 2 in 2015.<br />
EXHIBIT 8-3: Alternative 2 – Moderate Growth Capital Costs<br />
System Elements<br />
Alternative 2 –<br />
2008<br />
(’06 $)<br />
Alternative 2 –<br />
2015<br />
(’06 $)<br />
Alternative 2 –<br />
2025<br />
(’06 $)<br />
Guideway Costs<br />
Re-striping/Transit Signal Priority -- -- $500,000<br />
Acquisition -- -- --<br />
Subtotal: Guideway Costs -- -- $500,000<br />
Vehicle Costs<br />
40’ Coaches $0 - $3,500,000<br />
(10 coaches)<br />
$0 - $5,950,000<br />
(17 coaches)<br />
$0 - $4,200,000<br />
(12 coaches)<br />
Station Costs<br />
BRT Vehicles (8 vehicles) -- -- $10,480,000<br />
Subtotal: Vehicles $0-$3,500,000 $0 - $5,950,000<br />
$10,480,000 -<br />
$14,680,000<br />
Park & Ride Stations (2) -- -- $7,000,000<br />
Land Acquisition -- -- $0 - $28,612,000<br />
Intermediate Stations (3) -- -- $3,750,000<br />
Surface Parking (at P&R stations) -- -- $1,200,000<br />
Other Costs<br />
Bus Stop Amenities $8,000 $26,000 $27,000<br />
Subtotal: Station Costs $8,000 $26,000<br />
$11,977,000 -<br />
$40,589,000<br />
Maintenance/Storage Costs -- -- $500,000<br />
8-5
8. Estimated System Costs RTC SR-160 <strong>Corridor</strong> <strong>Study</strong><br />
System Elements<br />
Alternative 2 –<br />
2008<br />
(’06 $)<br />
Alternative 2 –<br />
2015<br />
(’06 $)<br />
Alternative 2 –<br />
2025<br />
(’06 $)<br />
Ticket Vending Machines -- -- $560,000<br />
Operations Control -- -- $250,000<br />
Subtotal: Other Costs -- -- $860,000<br />
Cost Contingencies<br />
Program Implementation<br />
Guideway Costs (10%) -- -- $50,000<br />
Design/Construction (25%) -- -- $2,995,000<br />
Vehicle Costs (10%) $0 - $350,000 $0 - $595,000<br />
Subtotal: Cost Contingencies $0 - $350,000 $0 - $595,000<br />
$1,048,000 -<br />
$1,468,000<br />
$4,093,000 -<br />
$4,513,000<br />
Design/Construction (31%) -- -- $3,713,000<br />
Guideway (15%) -- -- $75,000<br />
Vehicle Procurement (5%) $0 -$262,500 $0 - $297,500 $524,000 - $734,000<br />
Project Reserve (10%)<br />
Subtotal: Program Implementation $800 – $648,300<br />
TOTAL<br />
$800 - $385,800 $2,600 - $657,100<br />
$8,800 -<br />
$4,506,300<br />
$2,600 -<br />
$954,600<br />
$28,600 -<br />
$7,525,600<br />
$2,791,000 -<br />
$6,114,200<br />
$7,103,000 -<br />
$10,636,200<br />
$35,013,000 -<br />
$71,778,200<br />
Alternatives 2 (2008) and (2015), which vary only by the level of conventional bus transit<br />
provided, have much lower capital costs than Alternative 2 (2025) which introduces BRT. If<br />
no additional buses are required, capital costs for Alternatives 2 (2008) and (2015) would<br />
be incurred only for bus stop amenities – benches, shelters, and signage. Alternative 2<br />
(2025) is very close in cost to Alternatives 1 (2015) and 1 (2025) as all three include BRT<br />
(the largest capital cost element of the alternatives under review), and vary only by the<br />
level of conventional bus transit to be provided. Indeed, were there no need for additional<br />
40 foot coaches, capital costs for Alternative 1 (2008) and (2025), and Alternative 2 (2025)<br />
would be virtually identical.<br />
8.1.4 Summary/Conclusions<br />
Differences in capital cost estimates for Alternatives 1 and 2 arise primarily from the year in<br />
which BRT service is provided in the corridor (2015 versus 2025), and the level of<br />
conventional bus transit service provided and the resulting need (or lack thereof) of<br />
additional 40’ vehicles for the bus service.<br />
On a year-by-year basis, Alternative 2 is the lower capital cost alternative as it provides an<br />
overall lower level of transit investment. Overall, BRT costs on a per mile basis are<br />
estimated to be between $3.34 million and $6.37 million depending on the need to purchase<br />
land from BLM for Park & Ride facilities.<br />
8-6
8. Estimated System Costs RTC SR-160 <strong>Corridor</strong> <strong>Study</strong><br />
8.2 OPERATING COST ESTIMATES<br />
Annual operating costs of transit alternatives in the corridor must also be considered when<br />
selecting a transit investment. Operating costs represent an ongoing, recurring expense<br />
that can quickly dwarf the start up capital investment of bus alternatives, and must be<br />
accommodated within RTC’s annual transit operating budget.<br />
8.2.1 Estimation Methodology<br />
Two primary sources of information were used in the development of operating cost<br />
estimates for transit alternatives in the SR-160 corridor – the Federal Transit Administration<br />
(FTA) evaluation of the Las Vegas Metropolitan Area Express (MAX) and performance trend<br />
data for CAT route 113 and MAX from RTC’s transit department. Hourly marginal operating<br />
cost estimates from these two sources have been inflated to current year dollars and are<br />
applied to annual revenue service hour estimates for each of the alternative bus routes<br />
making up Alternatives 1 and 2 for the SR-160 corridor. Hourly operating cost estimates<br />
incorporate the contractor hourly rate plus a variable cost per hour for RTC transit division<br />
staff, and are shown in EXHIBIT 8-4.<br />
EXHIBIT 8-4: Hourly Marginal Costs for CAT Services<br />
Service Type 2004 2006 estimated<br />
CAT Bus Route $52.52 $55.72<br />
MAX $78.38 $83.15<br />
Note: Costs reflect hourly contractor costs plus RTC variable costs per<br />
hour as identified in performance trend data for route 113 and MAX<br />
provided by RTC’s transit department. Costs have been escalated by<br />
3% per year to arrive at estimated current year (2006) costs.<br />
For each of the transit alternatives under consideration, annual revenue service hours were<br />
estimated using some basic assumptions:<br />
Peak frequency based on that of the current CAT route to which the proposed bus<br />
alternative would connect;<br />
Off-peak frequency estimated at half the peak period frequency or 60 minutes,<br />
whichever is less;<br />
Both peak and off-peak periods last twelve hours;<br />
Weekdays – 254 in total – use the 12/12 peak/off-peak split while<br />
weekends/holidays – 111 in total – are treated as 24 hours of off-peak operations;<br />
Operating speeds for local, express, and BRT alternatives are 10 mph, 13 mph, and<br />
16 mph respectively (based, in part, on data provided in the FTA review of MAX).<br />
8-7
8. Estimated System Costs RTC SR-160 <strong>Corridor</strong> <strong>Study</strong><br />
These operating characteristics were applied to the route length of each alternative bus<br />
alignment identified for the corridor. Segment lengths for the roadways, and future<br />
roadways, in the study area are shown in EXHIBIT 8-5.<br />
EXHIBIT 8-5: Segment Lengths<br />
To Durango Dr &<br />
Flamingo Rd<br />
Fort Apache <strong>Road</strong><br />
4.1<br />
Rhodes<br />
Ranch<br />
To Rainbow Blvd<br />
2.2 To Decatur Blvd<br />
& Dewey 215<br />
Dr<br />
& Tropicana Ave 3.0<br />
2.0<br />
2.0<br />
Warm Springs <strong>Road</strong><br />
Windmill Lane<br />
Jones Blvd<br />
Jones Blvd<br />
.25<br />
Pinnacle<br />
Peaks<br />
1.4<br />
To Transfer<br />
Point<br />
1.3<br />
1.0<br />
<strong>Blue</strong> <strong>Diamond</strong><br />
.5<br />
.5<br />
Dean Martin Drive<br />
.6<br />
.5<br />
Warm Springs <strong>Road</strong><br />
Las<br />
Vegas<br />
Outlet<br />
Center<br />
Windmill Lane<br />
.25<br />
To Transit<br />
Center<br />
Durango Drive<br />
Durango Drive<br />
2.4<br />
2.3<br />
1.5<br />
I-15<br />
Las Vegas Blvd<br />
Las Vegas Blvd<br />
Bermuda <strong>Road</strong><br />
Bermuda <strong>Road</strong><br />
PR 1-4<br />
1.6<br />
Hualapai Way<br />
PR 1-1<br />
Mountains<br />
2.1 Edge<br />
2.3<br />
.5<br />
Jones Blvd<br />
Jones Blvd<br />
Decatur Blvd<br />
Decatur Blvd<br />
Silverado Ranch Blvd<br />
UPRR<br />
Cactus Ave<br />
Rainbow Blvd<br />
Rainbow Blvd<br />
Buffalo Drive<br />
Buffalo Drive<br />
N 0 1 2<br />
Scale: Miles<br />
Southern<br />
Highlands<br />
©2006 Rand McNally & Company<br />
8.2.2 Alternative 1 – High Growth<br />
Alternative 1, which reflects the maximum level of transit investment in the SR-160<br />
corridor, includes four bus route alternatives incorporating local, express, and BRT services<br />
by the year 2025.<br />
2008<br />
Alternative 1 (2008) reflects the level of transit investment by 2008, and includes only the<br />
local bus route connecting to CAT route 101 on Rainbow Boulevard (route designation in<br />
red), and a modified east/west running express bus route. By 2008, the express bus route<br />
would follow the same alignment as the BRT route (designated in blue) in Exhibit 5-10,<br />
connecting to current CAT services at the South Strip Transfer Terminal (SSTT).<br />
8-8
8. Estimated System Costs RTC SR-160 <strong>Corridor</strong> <strong>Study</strong><br />
2015<br />
Alternative 1 (2015) reflects the level of transit investment in the SR-160 corridor by 2015<br />
and includes all services shown in Exhibit 5-11 except the second local route (designated in<br />
orange) connecting to CAT routes 201 and 203 at Flamingo and Durango Boulevards.<br />
2025<br />
Alternative 1 (2025) reflects the maximum level of transit investment in the SR-160 corridor<br />
and includes all elements shown in Exhibit 5-12 – two local routes, an express route and<br />
BRT service on SR-160 connecting to the region’s future fixed guideway system on South<br />
Las Vegas Boulevard.<br />
Operating costs for each of the three time horizons for Alternative 1 are summarized in<br />
EXHIBIT 8-6, and are shown in current year (2006) dollars.<br />
Routes<br />
Local Route 1<br />
(Route 101 Connector)<br />
Local Route 2<br />
(Route 201 and 203<br />
Connector)<br />
Express Route 1<br />
(on BRT alignment)<br />
Express Route 1a<br />
(Route 103 Connector)<br />
BRT Route<br />
(connecting to southern<br />
end of <strong>Regional</strong> Fixed<br />
Guideway on S. Las<br />
Vegas Boulevard)<br />
EXHIBIT 8-6: Alternative 1 – Operating Costs<br />
Route<br />
Length<br />
(miles)<br />
Peak<br />
Frequency<br />
(minutes)<br />
Annual<br />
Service<br />
Hours<br />
Alternative 1<br />
– 2008<br />
(’06 millions $)<br />
Alternative 1<br />
– 2015<br />
(’06 millions $)<br />
Alternative 1<br />
– 2025<br />
(’06 millions $)<br />
8.84 30 20,877 $1.16 $1.16 $1.16<br />
11.38 20 40,313 -- -- $2.25<br />
10.48 15 38,076 $2.12 -- --<br />
10.99 30 19,965 -- $1.11 $1.11<br />
10.48 15 30,937 -- $2.57 $2.57<br />
TOTAL -- -- -- $3.28 $4.84 $7.09<br />
Annual service hours for each route alternative are a direct reflection of the route length,<br />
peak service frequency, and operating speed of each route. Generally, greater service<br />
frequencies, longer route lengths, and lower operating speeds lead to greater service hours<br />
resulting in overall higher service hours for local routes than either express or BRT routes.<br />
On a cost basis, however, BRT is the most expensive service to operate due to the higher<br />
cost per hour.<br />
8-9
8. Estimated System Costs RTC SR-160 <strong>Corridor</strong> <strong>Study</strong><br />
8.2.3 Alternative 2 – moderate growth<br />
Alternative 2, which reflects a lesser level of transit investment in the SR-160 corridor than<br />
in Alternative 1, includes three bus route alternatives incorporating local, express, and BRT<br />
services by the year 2025, as shown in Exhibit 5-15.<br />
2008<br />
Alternative 2 (2008) reflects the level of transit investment by 2008, and includes only a<br />
modified east/west running express route from that shown in Exhibit 5-13 (route<br />
designation in green).<br />
2015<br />
Alternative 2 (2015) reflects the level of transit investment in the SR-160 corridor by 2015<br />
and adds a local route (designated in red in Exhibit 5-14) to the express route in Alternative<br />
2 (2008). This local route would connect to CAT routes 201 and 203 at Flamingo and<br />
Durango Boulevards.<br />
2025<br />
Alternative 2 (2025) reflects a lesser level of transit investment in the SR-160 corridor than<br />
Alternative 1 (2025) but includes local, express, and BRT services as shown in Exhibit 5-15.<br />
Operating costs for each of the three time horizons for Alternative 2 are summarized in<br />
EXHIBIT 8-7, and are shown in current year (2006) dollars.<br />
Routes<br />
Local Route 1<br />
(Route 201 and 203<br />
Connector)<br />
Express Route 1<br />
(on BRT alignment)<br />
Express Route 1a<br />
(Route 103 Connector)<br />
BRT Route<br />
(connecting to southern<br />
end of <strong>Regional</strong> Fixed<br />
Guideway on S. Las<br />
Vegas Boulevard)<br />
EXHIBIT 8-7: Alternative 2 – Moderate Growth Operating Costs<br />
Route<br />
Length<br />
(miles)<br />
Peak<br />
Frequency<br />
(minutes)<br />
Annual<br />
Service<br />
Hours<br />
Alternative<br />
2 – 2008<br />
(’06 millions $)<br />
Alternative<br />
2 – 2015<br />
(’06 millions $)<br />
Alternative<br />
2 – 2025<br />
(’06 millions $)<br />
8.87 20 31,421 -- $1.75 $1.75<br />
9.99 15 36,296 $2.02 $2.02 --<br />
10.99 30 19,965 -- -- $1.11<br />
9.99 15 29,490 -- -- $2.45<br />
TOTAL -- -- -- $2.02 $3.77 $5.31<br />
8-10
8. Estimated System Costs RTC SR-160 <strong>Corridor</strong> <strong>Study</strong><br />
As under Alternative 1, annual service hours for each route alternative are a direct reflection<br />
of the route length, peak service frequency, and operating speed of each route. For<br />
Alternative 2, this means that the most service hours are associated with the express route<br />
operating at 15 minute peak frequencies. On a cost basis, however, the higher cost per<br />
hour results in the BRT route being the most expensive to operate.<br />
8.2.4 Summary/Conclusions<br />
Alternative 2 alternatives represent an overall lower level of investment than Alternative 1<br />
alternatives in each of the three key years of investment – 2008, 2015, and 2025. The<br />
delay of BRT implementation and one less local route under Alternative 2 build-out in 2025<br />
result in a 34% lower overall operating cost impact than the Alternative 1 2025 alternative.<br />
The difference between the two alternatives is even greater in 2008 with Alternative 1 being<br />
85% more costly to operate than Alternative 2 which includes a single express route as<br />
opposed to both an express and local route in Alternative 1. However, the 2008 Alternative<br />
2 alternative provides no north-south connectivity to the current CAT system west of I-15<br />
whereas Alternative 1 connects to the current CAT system along Rainbow Boulevard<br />
Additionally, the higher initial investment under Alternative 1 results in less growth in<br />
operating costs from 2008 to 2015, and 2008 to 2025 at 48 percent and 116 percent<br />
respectively than under Alternative 2 where costs are estimated to grow by 86 percent from<br />
2008 to 2015, and by 163 percent from 2008 to 2025. Cost growth is a direct reflection of<br />
the number of service hours provided under each option as shown in EXHIBIT 8-8.<br />
EXHIBIT 8-8: Comparison of Vehicle Service Hours<br />
Alternative 1 Alternative 1 Alternative 1 Alternative 2 Alternative 2 Alternative 2<br />
Service Hours<br />
(2025) (2015) (2025) (2015) (2015) (2025)<br />
Bus Service Hours 58,953 71,779 112,092 36,296 67,717 80,876<br />
8-11
A. Aerial Photographs of <strong>Blue</strong> <strong>Diamond</strong> <strong>Corridor</strong> RTC SR-160 <strong>Corridor</strong> <strong>Study</strong><br />
APPENDIX A<br />
Aerial Photographs of <strong>Blue</strong><br />
<strong>Diamond</strong> <strong>Corridor</strong><br />
2005 photographs of study corridor<br />
shown West to East,<br />
from Clark County GIS website<br />
A-1
A. Aerial Photographs of <strong>Blue</strong> <strong>Diamond</strong> <strong>Corridor</strong> RTC SR-160 <strong>Corridor</strong> <strong>Study</strong><br />
EXHIBIT A-1: Aerial View 1<br />
A-2
A. Aerial Photographs of <strong>Blue</strong> <strong>Diamond</strong> <strong>Corridor</strong> RTC SR-160 <strong>Corridor</strong> <strong>Study</strong><br />
EXHIBIT A-2: Aerial View 2<br />
A-3
A. Aerial Photographs of <strong>Blue</strong> <strong>Diamond</strong> <strong>Corridor</strong> RTC SR-160 <strong>Corridor</strong> <strong>Study</strong><br />
EXHIBIT A-3: Aerial View 3<br />
A-4
A. Aerial Photographs of <strong>Blue</strong> <strong>Diamond</strong> <strong>Corridor</strong> RTC SR-160 <strong>Corridor</strong> <strong>Study</strong><br />
EXHIBIT A-4: Aerial View 4<br />
A-5
A. Aerial Photographs of <strong>Blue</strong> <strong>Diamond</strong> <strong>Corridor</strong> RTC SR-160 <strong>Corridor</strong> <strong>Study</strong><br />
EXHIBIT A-5: Aerial View 5<br />
A-6
A. Aerial Photographs of <strong>Blue</strong> <strong>Diamond</strong> <strong>Corridor</strong> RTC SR-160 <strong>Corridor</strong> <strong>Study</strong><br />
EXHIBIT A-6: Aerial View 6<br />
A-7
A. Aerial Photographs of <strong>Blue</strong> <strong>Diamond</strong> <strong>Corridor</strong> RTC SR-160 <strong>Corridor</strong> <strong>Study</strong><br />
EXHIBIT A-7: Aerial View 7<br />
A-8
A. Aerial Photographs of <strong>Blue</strong> <strong>Diamond</strong> <strong>Corridor</strong> RTC SR-160 <strong>Corridor</strong> <strong>Study</strong><br />
EXHIBIT A-8: Aerial View 8<br />
A-9
A. Aerial Photographs of <strong>Blue</strong> <strong>Diamond</strong> <strong>Corridor</strong> RTC SR-160 <strong>Corridor</strong> <strong>Study</strong><br />
EXHIBIT A-9: Aerial View 9<br />
A-10
A. Aerial Photographs of <strong>Blue</strong> <strong>Diamond</strong> <strong>Corridor</strong> RTC SR-160 <strong>Corridor</strong> <strong>Study</strong><br />
EXHIBIT A-10: Aerial View 10<br />
A-11
A. Aerial Photographs of <strong>Blue</strong> <strong>Diamond</strong> <strong>Corridor</strong> RTC SR-160 <strong>Corridor</strong> <strong>Study</strong><br />
EXHIBIT A-11: Aerial View 11<br />
A-12
A. Aerial Photographs of <strong>Blue</strong> <strong>Diamond</strong> <strong>Corridor</strong> RTC SR-160 <strong>Corridor</strong> <strong>Study</strong><br />
EXHIBIT A-12: Aerial View 12<br />
A-13
A. Aerial Photographs of <strong>Blue</strong> <strong>Diamond</strong> <strong>Corridor</strong> RTC SR-160 <strong>Corridor</strong> <strong>Study</strong><br />
EXHIBIT A-13: Aerial View 13<br />
A-14
A. Aerial Photographs of <strong>Blue</strong> <strong>Diamond</strong> <strong>Corridor</strong> RTC SR-160 <strong>Corridor</strong> <strong>Study</strong><br />
EXHIBIT A-14: Aerial View 14<br />
A-15
A. Aerial Photographs of <strong>Blue</strong> <strong>Diamond</strong> <strong>Corridor</strong> RTC SR-160 <strong>Corridor</strong> <strong>Study</strong><br />
EXHIBIT A-15: Aerial View 15<br />
A-16
B. Candidate Park & Ride Site Data RTC SR-160 <strong>Corridor</strong> <strong>Study</strong><br />
APPENDIX B<br />
Candidate Park & Ride Site Data<br />
B-1
B. Candidate Park & Ride Site Data RTC SR-160 <strong>Corridor</strong> <strong>Study</strong><br />
EXHIBIT B-1: Potential Park & Ride Sites That Are Owned By the Government or Long-Time Private Owners<br />
No.<br />
County Parcel<br />
No. & Govt.<br />
Description<br />
Location / Map(s)<br />
N/S of<br />
160<br />
(within groups, listed west to east)<br />
Fronts on<br />
Owned<br />
by<br />
Size<br />
(acres)<br />
Comments<br />
Photos<br />
(taken 2/14/06)<br />
Group 1: Meet all location criteria<br />
1-1 Three parcels:<br />
17619101011<br />
(govt lot 17 & pt<br />
govt lot 16)<br />
Between Hualapai and<br />
Conquistador<br />
South<br />
SR-160,<br />
Hualapai,<br />
Conquistador<br />
USA /<br />
BLM<br />
17.7<br />
(total)<br />
Would probably be<br />
the western terminus<br />
of transit service.<br />
Good collector site<br />
for traffic from<br />
Pahrump and <strong>Blue</strong><br />
<strong>Diamond</strong>, with space<br />
for approximately<br />
1500 parking stalls.<br />
17619101013<br />
(pt govt lot 19 &<br />
pt govt lot 20)<br />
Only need one of the<br />
two parcels fronting<br />
on SR-160 to provide<br />
access to main lot<br />
area, preferably the<br />
western one which<br />
provides access to<br />
SR-160 via Hualapai.<br />
Looking S from northeast corner of<br />
Hualapai and SR-160. SR-160 in<br />
foreground.<br />
Little development in<br />
this area.<br />
17619201001<br />
(pt SW4 NW4<br />
sec 19 22 60)<br />
Looking SE from northeast corner of<br />
Hualapai and SR-160, with SR-160 in<br />
midground.<br />
B-2
B. Candidate Park & Ride Site Data RTC SR-160 <strong>Corridor</strong> <strong>Study</strong><br />
County Parcel<br />
No. No. & Govt.<br />
Description<br />
1-2 17620601009<br />
(pt S2 NE4 sec<br />
20 22 60)<br />
Location / Map(s)<br />
West of (but separated from)<br />
Durango<br />
N/S of<br />
160<br />
South<br />
Fronts on<br />
SR-160,<br />
Arlington<br />
Ranch<br />
Owned<br />
by<br />
USA /<br />
BLM<br />
Size<br />
(acres)<br />
Comments<br />
9.6 Well situated<br />
between Pinnacle<br />
Peaks and<br />
Westchester Hills.<br />
Photos<br />
(taken 2/14/06)<br />
A parcel owned by<br />
<strong>Diamond</strong> PHD is<br />
between this parcel<br />
and Durango; would<br />
require easement to<br />
Durango for access<br />
without additional<br />
intersection on<br />
SR-160.<br />
Looking S across SR-160 from just west<br />
of northwest corner of Durango and<br />
SR-160.<br />
Alternatively, SR-160<br />
past this site is not<br />
currently scheduled<br />
for widening. It would<br />
be possible to put<br />
bus stops along the<br />
SR-160 corridor itself,<br />
with a pedestrian<br />
overpass for westbound<br />
access.<br />
Looking SW across SR-160 from just<br />
west of northwest corner of Durango<br />
and SR-160.<br />
B-3
B. Candidate Park & Ride Site Data RTC SR-160 <strong>Corridor</strong> <strong>Study</strong><br />
County Parcel<br />
No. No. & Govt.<br />
Description<br />
1-3 Two parcels:<br />
17622201018<br />
(pt SW4 NW4<br />
sec 22 22 60)<br />
17622301014<br />
(pt S2 sec 22<br />
22 60)<br />
Location / Map(s)<br />
N/S of<br />
160<br />
Fronts on<br />
Buffalo to Pioneer South SR-160,<br />
Buffalo,<br />
Pioneer<br />
Owned<br />
by<br />
USA /<br />
BLM<br />
Size<br />
(acres)<br />
4.7<br />
along<br />
SR160,<br />
194<br />
immediately<br />
south<br />
Comments<br />
Somewhat hilly, but<br />
slope up to 5% is<br />
acceptable for P&R<br />
lots.<br />
Availability of this<br />
parcel is now<br />
questionable,<br />
because the west<br />
side and frontage<br />
along SR-160 was<br />
recently made into a<br />
nature park -- the<br />
Mountain’s Edge<br />
development shows a<br />
portion of this land as<br />
“Exploration Park,”<br />
although ownership<br />
still shows as being<br />
with BLM.<br />
Photos<br />
(taken 2/14/06)<br />
Looking East at park building across<br />
Buffalo from SW corner of Buffalo and<br />
SR-160.<br />
Looking SE across Buffalo from SW<br />
corner of Buffalo and SR-160.<br />
Looking east across Buffalo from just<br />
south of southwest corner of Buffalo &<br />
SR-160. Sign is for new nature park.<br />
B-4
B. Candidate Park & Ride Site Data RTC SR-160 <strong>Corridor</strong> <strong>Study</strong><br />
County Parcel<br />
No. No. & Govt.<br />
Description<br />
1-4 Two parcels:<br />
17623601017<br />
(pt N2 sec 23<br />
22 60)<br />
Location / Map(s)<br />
N/S of<br />
160<br />
Fronts on<br />
Redwood to UPRR mainline South SR-160 (east<br />
of Mann),<br />
Redwood,<br />
Torrey Pines,<br />
El Camino<br />
Owned<br />
by<br />
USA /<br />
BLM<br />
Size<br />
(acres)<br />
57 for<br />
larger<br />
parcel,<br />
7¾ for<br />
smaller<br />
Comments<br />
Large but somewhat<br />
awkward and<br />
disjointed.<br />
SR-160 will go aerial<br />
over the UPRR in this<br />
area.<br />
Photos<br />
(taken 2/14/06)<br />
17623201003<br />
(pt S2 N2 sec<br />
23 22 60)<br />
It may be possible to<br />
construct onramp to<br />
WB SR-160 under<br />
new overpass,<br />
otherwise access will<br />
be best via Torrey<br />
Pines.<br />
Looking S across SR-160 to parcel 1-4.<br />
Looking S across SR-160 to parcel 1-4.<br />
B-5
B. Candidate Park & Ride Site Data RTC SR-160 <strong>Corridor</strong> <strong>Study</strong><br />
No.<br />
County Parcel<br />
No. & Govt.<br />
Description<br />
Location / Map(s)<br />
N/S of<br />
160<br />
Fronts on<br />
1-5 17613801025 Immediately west of Decatur South SR-160,<br />
Decatur<br />
Owned<br />
by<br />
<strong>Blue</strong><br />
<strong>Diamond</strong><br />
Ranch<br />
(last<br />
sale<br />
date<br />
and<br />
price<br />
not<br />
avail.)<br />
Size<br />
(acres)<br />
13<br />
(H-2)<br />
Comments<br />
Long-time private<br />
owner.<br />
Good access from<br />
both SR-160 and<br />
Decatur.<br />
Close to Southern<br />
Highlands<br />
development.<br />
Photos<br />
(taken 2/14/06)<br />
Looking W from southwest corner of<br />
Decatur and 160.<br />
Looking SW from southwest corner of<br />
Decatur and 160.<br />
Looking S from southwest corner of<br />
Decatur and 160.<br />
B-6
B. Candidate Park & Ride Site Data RTC SR-160 <strong>Corridor</strong> <strong>Study</strong><br />
No.<br />
County Parcel<br />
No. & Govt.<br />
Description<br />
2-1 17619101002<br />
(govt lots 7,9-<br />
11 & pt govt<br />
lots 15,16)<br />
Location / Map(s)<br />
N/S of<br />
160<br />
Fronts on<br />
Owned<br />
by<br />
Size<br />
(acres)<br />
Comments<br />
Group 2: Good alternate sites that meet most location criteria<br />
Immediately east of Hualapai North SR-160,<br />
Hualapai<br />
USA /<br />
BLM<br />
11 Could be alternate<br />
site of end-of-line<br />
P&R, but is not on<br />
inbound side of<br />
SR-160. Also does<br />
not have as much<br />
capacity as site on<br />
south side of SR-160.<br />
Photos<br />
(taken 2/14/06)<br />
Looking SE from just north of northeast<br />
corner of Hualapai and sr-160.<br />
B-7
B. Candidate Park & Ride Site Data RTC SR-160 <strong>Corridor</strong> <strong>Study</strong><br />
County Parcel<br />
No. No. & Govt.<br />
Description<br />
2-2 17620601014<br />
(pt N2 sec 20<br />
22 60)<br />
Location / Map(s)<br />
N/S of<br />
160<br />
Fronts on<br />
Immediately west of Durango North SR-160,<br />
Durango<br />
Owned<br />
by<br />
USA /<br />
BLM<br />
Size<br />
(acres)<br />
Comments<br />
10.6 Has good access via<br />
Durango. Would be<br />
worth considering if<br />
site #1-2 is not<br />
available, even<br />
though on north side<br />
of SR-160.<br />
Photos<br />
(taken 2/14/06)<br />
One privately-owned<br />
high price parcel<br />
between this site and<br />
site #2-3.<br />
Looking W from just west of northwest<br />
corner of Durango and SR-160.<br />
This parcel is quite<br />
linear; careful design<br />
would be required to<br />
minimize walking<br />
distances.<br />
Looking E from just west of northwest<br />
corner of Durango and SR-160.<br />
Looking NW from just west of northwest<br />
corner of Durango and SR-160.<br />
B-8
B. Candidate Park & Ride Site Data RTC SR-160 <strong>Corridor</strong> <strong>Study</strong><br />
No.<br />
County Parcel<br />
No. & Govt.<br />
Description<br />
Location / Map(s)<br />
N/S of<br />
160<br />
Fronts on<br />
2-3 17718301004 Immediately east of Decatur North SR-160,<br />
Decatur<br />
Owned<br />
by<br />
<strong>Blue</strong><br />
<strong>Diamond</strong><br />
Ranch<br />
(last<br />
sale<br />
date<br />
and<br />
price<br />
not<br />
avail.)<br />
Size<br />
(acres)<br />
16<br />
(C-2)<br />
Comments<br />
Long-time owner.<br />
Is a good site, except<br />
for being on the north<br />
side of SR-160. Has<br />
good access to<br />
SR-160 and Decatur.<br />
Would be worth<br />
serious consideration<br />
if bus routes turn<br />
north onto Decatur to<br />
Warm Springs.<br />
Photos<br />
(taken 2/14/06)<br />
Looking W across parcel to houses on<br />
west side of Decatur.<br />
Much development<br />
nearby.<br />
Looking north, chip seal road bisecting<br />
lot in foreground.<br />
Looking west, chip seal road bisecting<br />
lot in foreground.<br />
B-9
B. Candidate Park & Ride Site Data RTC SR-160 <strong>Corridor</strong> <strong>Study</strong><br />
No.<br />
County Parcel<br />
No. & Govt.<br />
Description<br />
Location / Map(s)<br />
N/S of<br />
160<br />
Fronts on<br />
2-4 17718602016 East and west of Hinson South SR-160,<br />
Hinson,<br />
Valley View<br />
Owned<br />
by<br />
CC<br />
Dept of<br />
Aviation<br />
Size<br />
(acres)<br />
40<br />
(H-2)<br />
Comments<br />
Although a highly<br />
desirable location, it<br />
could not be placed<br />
in Group 1 because<br />
of access issues.<br />
Photos<br />
(taken 2/14/06)<br />
No Photos.<br />
Without flyovers,<br />
access to/from<br />
westbound SR-160<br />
requires a ¼ mile<br />
drive along Valley<br />
View or an easement<br />
to Arville (which<br />
would be right at the<br />
corner of SR-160).<br />
Privately-owned<br />
parcels prevent<br />
easier access to<br />
Valley View or Arville.<br />
Despite the negative<br />
aspects of this parcel<br />
and its awkward<br />
shape, it is an<br />
excellent location for<br />
a P&R facility (being<br />
the easternmost site<br />
prior to I-15) and<br />
ways need to be<br />
explored to make it<br />
viable.<br />
B-10
B. Candidate Park & Ride Site Data RTC SR-160 <strong>Corridor</strong> <strong>Study</strong><br />
No.<br />
County Parcel<br />
No. & Govt.<br />
Description<br />
Location / Map(s)<br />
N/S of<br />
160<br />
Fronts on<br />
Owned<br />
by<br />
Size<br />
(acres)<br />
Comments<br />
Photos<br />
(taken 2/14/06)<br />
Group 3: Less desirable alternate sites<br />
3-1 17619101018<br />
(pt NE4 NW4<br />
sec 19 22 60 &<br />
govt lot 5 & pt<br />
govt lots 19,20)<br />
Conquistador to Grand<br />
Canyon<br />
North<br />
SR-160,<br />
Grand<br />
Canyon<br />
USA /<br />
BLM<br />
31.6 Another possible<br />
end-of-line site, but<br />
also on north side of<br />
SR-160. Is larger<br />
than site #2-1 above.<br />
There is no good<br />
access to eastbound<br />
SR-160 without the<br />
addition of a new<br />
dedicated<br />
intersection.<br />
Looking SE from northeast corner of<br />
Hualapai and SR-160.<br />
Looking E from northeast corner of<br />
Hualapai and SR-160.<br />
Looking west to detention basin near<br />
intersection of Hualapai and SR-160.<br />
B-11
B. Candidate Park & Ride Site Data RTC SR-160 <strong>Corridor</strong> <strong>Study</strong><br />
County Parcel<br />
No. No. & Govt.<br />
Description<br />
3-2 17620201015<br />
(pt N2 sec 20<br />
22 60)<br />
Location / Map(s)<br />
Immediately east of Ft.<br />
Apache<br />
N/S of<br />
160<br />
North<br />
Fronts on<br />
SR-160,<br />
Ft. Apache<br />
Owned<br />
by<br />
USA /<br />
BLM<br />
Size<br />
(acres)<br />
Comments<br />
26 Good size, but north<br />
of SR-160 and very<br />
linear, which would<br />
result in long walking<br />
distances.<br />
Photos<br />
(taken 2/14/06)<br />
Has good access to<br />
Westchester Hills<br />
development, which<br />
helps to mitigate the<br />
drawback of being<br />
north of SR-160.<br />
Looking W from northeast corner of Ft<br />
Apache and SR-160. RV is on Ft<br />
Apache stopped at intersection.<br />
Would require<br />
backtracking from<br />
Mountain’s Edge.<br />
Looking NW from northeast corner of Ft<br />
Apache and SR-160.<br />
Looking N from northeast corner of Ft<br />
Apache and SR-160 toward<br />
Westchester Hills development.<br />
B-12
B. Candidate Park & Ride Site Data RTC SR-160 <strong>Corridor</strong> <strong>Study</strong><br />
County Parcel<br />
No. No. & Govt.<br />
Description<br />
3-3 17622501019<br />
(pt N2 sec 22<br />
22 60)<br />
Location / Map(s)<br />
Monte Cristo almost to<br />
Rainbow<br />
N/S of<br />
160<br />
North<br />
Fronts on<br />
SR-160,<br />
Monte Cristo,<br />
Belcastro<br />
Owned<br />
by<br />
USA /<br />
BLM<br />
Size<br />
(acres)<br />
Comments<br />
77 Location on the north<br />
side of SR-160 is a<br />
disadvantage.<br />
Is very large,<br />
although somewhat<br />
disjointed – only part<br />
of this property would<br />
be required for a<br />
P&R.<br />
Some private parcels<br />
are imbedded within<br />
this parcel.<br />
Photos<br />
(taken 2/14/06)<br />
Looking N, just west of northwest corner<br />
of Rainbow and SR-160.<br />
No major existing<br />
developments are in<br />
the immediate area.<br />
Looking NW, just west of northwest<br />
corner of Rainbow and SR-160.<br />
Looking NW, just west of northwest<br />
corner of Rainbow and SR-160.<br />
B-13
B. Candidate Park & Ride Site Data RTC SR-160 <strong>Corridor</strong> <strong>Study</strong><br />
County Parcel<br />
No. No. & Govt.<br />
Description<br />
3-4 17623501011<br />
(pt N2 sec 23<br />
22 60)<br />
Location / Map(s)<br />
Torrey Pines to UPRR<br />
mainline<br />
N/S of<br />
160<br />
North<br />
Fronts on<br />
SR-160,<br />
Torrey Pines,<br />
El Camino<br />
Owned<br />
by<br />
USA /<br />
BLM<br />
Size<br />
(acres)<br />
Comments<br />
28 On north side of<br />
SR-160.<br />
SR-160 will go aerial<br />
over the UPRR in<br />
this area.<br />
Photos<br />
(taken 2/14/06)<br />
Access from west<br />
may be possible<br />
under overpass,<br />
parallel to UPRR<br />
tracks (using part of<br />
site #1-4 above).<br />
Looking N just west of west side of<br />
UPRR ROW.<br />
The lot is long and<br />
narrow, requiring<br />
careful design to<br />
minimize walking<br />
distances.<br />
Looking W just west of west side of<br />
UPRR ROW.<br />
Looking northeast on west side of<br />
UPRR ROW. Tracks visible just past<br />
powerline.<br />
B-14
B. Candidate Park & Ride Site Data RTC SR-160 <strong>Corridor</strong> <strong>Study</strong><br />
County Parcel<br />
No. No. & Govt.<br />
Description<br />
3-5 Two parcels:<br />
17718601001<br />
Location / Map(s)<br />
Immediately east of Arville,<br />
with larger adjacent parcel<br />
extending to Valley View<br />
N/S of<br />
160<br />
North<br />
Fronts on<br />
SR-160,<br />
Arville<br />
Owned<br />
by<br />
CC<br />
Dept of<br />
Aviation<br />
Size<br />
(acres)<br />
8.25<br />
and 40<br />
(C-2)<br />
Comments<br />
On north side of<br />
SR-160.<br />
Current construction<br />
appears to be for<br />
retail development.<br />
Photos<br />
(taken 2/14/06)<br />
May be able to take<br />
advantage of<br />
“opportunistic” or<br />
“joint-use” parking.<br />
Looking NE from middle of parcel along<br />
SR-160. Signage indicates retail center<br />
under construction.<br />
17718501015<br />
Looking N from middle of parcel along<br />
SR-160; construction apparent.<br />
Looking W from middle of parcel along<br />
SR-160.<br />
B-15
C. SR-160 Major Intersections RTC SR-160 <strong>Corridor</strong> <strong>Study</strong><br />
APPENDIX C<br />
SR-160 Major Intersections<br />
C-1
C. SR-160 Major Intersections RTC SR-160 <strong>Corridor</strong> <strong>Study</strong><br />
EXHIBIT C-1: SR-160 at Las Vegas Blvd.<br />
C-2
C. SR-160 Major Intersections RTC SR-160 <strong>Corridor</strong> <strong>Study</strong><br />
EXHIBIT C-2: SR-160 at I-15<br />
C-3
C. SR-160 Major Intersections RTC SR-160 <strong>Corridor</strong> <strong>Study</strong><br />
EXHIBIT C-3: SR-160 at Industrial<br />
C-4
C. SR-160 Major Intersections RTC SR-160 <strong>Corridor</strong> <strong>Study</strong><br />
EXHIBIT C-4: SR-160 at Valley View Blvd.<br />
C-5
C. SR-160 Major Intersections RTC SR-160 <strong>Corridor</strong> <strong>Study</strong><br />
EXHIBIT C-5: SR-160 at Arville<br />
C-6
C. SR-160 Major Intersections RTC SR-160 <strong>Corridor</strong> <strong>Study</strong><br />
EXHIBIT C-6: SR-160 at Decatur<br />
C-7
C. SR-160 Major Intersections RTC SR-160 <strong>Corridor</strong> <strong>Study</strong><br />
EXHIBIT C-7: SR-160 at Jones<br />
(Note: North is toward the bottom of the drawing)<br />
C-8
C. SR-160 Major Intersections RTC SR-160 <strong>Corridor</strong> <strong>Study</strong><br />
EXHIBIT C-8: SR-160 at Rainbow<br />
(Note: North is toward the bottom of the drawing)<br />
C-9
D. RTC Policies and Procedures RTC SR-160 <strong>Corridor</strong> <strong>Study</strong><br />
APPENDIX D<br />
RTC Policies and Procedures<br />
Last Revised: March 9, 2006<br />
Excerpt covering<br />
“Guidelines for the Provision of<br />
Bus Turnouts and Passenger Loading Areas<br />
for the Citizens Area Transit (CAT) Bus”<br />
Including<br />
Uniform Standard Drawings for Bus Stops<br />
D-1
D. RTC Policies and Procedures RTC SR-160 <strong>Corridor</strong> <strong>Study</strong><br />
D-2
D. RTC Policies and Procedures RTC SR-160 <strong>Corridor</strong> <strong>Study</strong><br />
D-3
D. RTC Policies and Procedures RTC SR-160 <strong>Corridor</strong> <strong>Study</strong><br />
D-4
D. RTC Policies and Procedures RTC SR-160 <strong>Corridor</strong> <strong>Study</strong><br />
D-5
D. RTC Policies and Procedures RTC SR-160 <strong>Corridor</strong> <strong>Study</strong><br />
D-6
D. RTC Policies and Procedures RTC SR-160 <strong>Corridor</strong> <strong>Study</strong><br />
D-7
D. RTC Policies and Procedures RTC SR-160 <strong>Corridor</strong> <strong>Study</strong><br />
D-8
D. RTC Policies and Procedures RTC SR-160 <strong>Corridor</strong> <strong>Study</strong><br />
D-9
D. RTC Policies and Procedures RTC SR-160 <strong>Corridor</strong> <strong>Study</strong><br />
D-10
D. RTC Policies and Procedures RTC SR-160 <strong>Corridor</strong> <strong>Study</strong><br />
D-11
D. RTC Policies and Procedures RTC SR-160 <strong>Corridor</strong> <strong>Study</strong><br />
D-12
D. RTC Policies and Procedures RTC SR-160 <strong>Corridor</strong> <strong>Study</strong><br />
D-13
D. RTC Policies and Procedures RTC SR-160 <strong>Corridor</strong> <strong>Study</strong><br />
D-14
D. RTC Policies and Procedures RTC SR-160 <strong>Corridor</strong> <strong>Study</strong><br />
D-15