corresponding pdf
corresponding pdf
corresponding pdf

You also want an ePaper? Increase the reach of your titles
YUMPU automatically turns print PDFs into web optimized ePapers that Google loves.
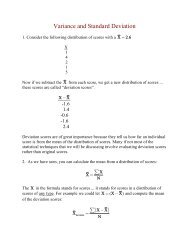
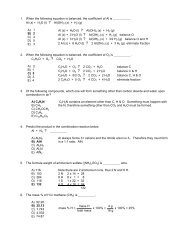
oxplot(Di.change ~ Fertilizer, data = BS, col = c("brown", "red"))<br />
ggplot(data = BS, aes(x = Fertilizer, y = Di.change)) + geom_boxplot()<br />
7.5<br />
2 4 6 8<br />
Di.change<br />
5.0<br />
2.5<br />
F<br />
NF<br />
F<br />
Fertilizer<br />
NF<br />
(d) Use the tapply command to find the numeric summaries of the diameter changes for the two levels<br />
of fertilization.<br />
with(data = BS, tapply(Di.change, list(Fertilizer), summary))<br />
$F<br />
Min. 1st Qu. Median Mean 3rd Qu. Max.<br />
2.91 4.32 4.76 5.27 6.52 8.92<br />
$NF<br />
Min. 1st Qu. Median Mean 3rd Qu. Max.<br />
1.02 1.92 2.71 2.72 3.16 5.71<br />
with(data = BS, tapply(Di.change, list(Fertilizer), sd))<br />
F NF<br />
1.383 1.101<br />
(e) Create a scatter plot of the height changes against the diameter changes and describe the relationship.<br />
plot(Ht.change ~ Di.change, data = BS, cex = 0.5, pch = 19, col = "blue")<br />
p
![Graduate Bulletin [PDF] - MFC home page - Appalachian State ...](https://img.yumpu.com/50706615/1/190x245/graduate-bulletin-pdf-mfc-home-page-appalachian-state-.jpg?quality=85)