Proline Accumulation in Maize (Zea mays L ... - Plant Physiology
Proline Accumulation in Maize (Zea mays L ... - Plant Physiology
Proline Accumulation in Maize (Zea mays L ... - Plant Physiology

Create successful ePaper yourself
Turn your PDF publications into a flip-book with our unique Google optimized e-Paper software.
1352 Verslues and Sharp <strong>Plant</strong> Physiol. Vol. 119, 1999<br />
tud<strong>in</strong>al stra<strong>in</strong> rate (Sharp et al., 1988). In similar experiments,<br />
the apical 12 mm of 15 to 20 roots was harvested<br />
<strong>in</strong>to 1-mm sections (collected by position) and used to<br />
determ<strong>in</strong>e the profile of Pro content via a n<strong>in</strong>hydr<strong>in</strong>-based<br />
assay (Bates et al., 1973). The spatial growth and Procontent<br />
data were comb<strong>in</strong>ed to calculate profiles of net Pro<br />
deposition rate us<strong>in</strong>g the cont<strong>in</strong>uity equation, as described<br />
previously (Silk et al., 1984; Sharp et al., 1990).<br />
The boundaries of the root sections harvested <strong>in</strong> label<strong>in</strong>g<br />
experiments were determ<strong>in</strong>ed by fitt<strong>in</strong>g a polynomial<br />
equation to the high- and low- w displacement velocity<br />
profiles. These equations were then put <strong>in</strong>to a computer<br />
program that calculated the displacement of a specific<br />
po<strong>in</strong>t on the root surface over time. From these data, the<br />
positions of the apical and basal boundaries of the section<br />
at each sampl<strong>in</strong>g time were determ<strong>in</strong>ed.<br />
HPLC Analysis and Quantification of Am<strong>in</strong>o Acid Label<strong>in</strong>g<br />
HPLC separation of am<strong>in</strong>o acids was performed as described<br />
previously (Verslues et al., 1998). Derivatized<br />
am<strong>in</strong>o acids were separated by reversed-phase HPLC<br />
(modified from Yang and Sepulveda, 1985; Ebert, 1986).<br />
HPLC results were corrected for recovery (always with<strong>in</strong><br />
the range of 60%–80%) of the <strong>in</strong>ternal standard<br />
-am<strong>in</strong>oadipic acid. The am<strong>in</strong>o acids Pro, Glu, Asp, Asn,<br />
Ser, Gln, Arg, GABA, Thr, and Ala were rout<strong>in</strong>ely quantified<br />
us<strong>in</strong>g this method. However, the method was unable<br />
to quantify Orn because of its low concentration <strong>in</strong> the root<br />
apical region (Voetberg and Sharp, 1991) and coelution<br />
with other, unidentified peaks. In label<strong>in</strong>g experiments,<br />
<strong>in</strong>dividual am<strong>in</strong>o acid peaks were collected <strong>in</strong> 7-mL sc<strong>in</strong>tillation<br />
vials by a computer-controlled fraction collector<br />
(Cygnet, Isco, L<strong>in</strong>coln, NE). The 3 Hor 14 C activity of each<br />
collected peak was determ<strong>in</strong>ed by sc<strong>in</strong>tillation count<strong>in</strong>g for<br />
10 m<strong>in</strong> (LS-6000-IC, Beckman) us<strong>in</strong>g Opti-Fluor sc<strong>in</strong>tillation<br />
fluid (Packard Instruments, Meriden, CT); all samples<br />
were well above the limit of detection. Count<strong>in</strong>g results<br />
were corrected for background 3 Hor 14 C activity.<br />
For samples <strong>in</strong> which labeled Pro was applied to the root<br />
apical region, <strong>in</strong>corporation of Pro <strong>in</strong>to the aqueous <strong>in</strong>soluble<br />
fraction was measured by dry<strong>in</strong>g the residual organic<br />
phase and hydrolyz<strong>in</strong>g the residue <strong>in</strong> 6 m HCl at 110°C for<br />
12 to 15 h. HPLC fractions were collected and 3 H activity<br />
was quantified as described above.<br />
RESULTS<br />
Root Growth and Am<strong>in</strong>o Acid Concentrations<br />
After the seedl<strong>in</strong>gs were transferred to solution culture<br />
at high w , the root elongation rate accelerated and reached<br />
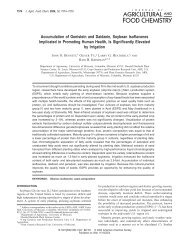
a steady value at approximately 30 h (Fig. 2). In the low- w<br />
(1.6 MPa PEG) treatment, the root elongation rate first<br />
decreased and then recovered, reach<strong>in</strong>g a near-steady<br />
value at approximately 35 h. These results are similar to<br />
those obta<strong>in</strong>ed <strong>in</strong> similar experiments by Verslues et al.<br />
(1998). Thirty-two hours (high w ) and 52 h (low w ) were<br />
chosen as the appropriate times for analysis of Pro deposition<br />
and for label<strong>in</strong>g experiments because of the steady<br />
Figure 2. Time course of root elongation rate at high (0.02 MPa) or<br />
low (1.6 MPa) w . Arrows show the time at which the addition of<br />
PEG was started and the time at which solution w reached 1.6<br />
MPa <strong>in</strong> the low- w treatment; solution w was constant at later times.<br />
Boldface arrows <strong>in</strong>dicate the times after transfer when 3 Hor 14 C<br />
label<strong>in</strong>g and quantification of the spatial patterns of Pro concentration<br />
and growth with<strong>in</strong> the root tip were performed. Root elongation<br />
rates are means SE (n 50–100) from three to five experiments.<br />
Inset, Root elongation rate measured <strong>in</strong> 30-m<strong>in</strong> <strong>in</strong>tervals after seedl<strong>in</strong>gs<br />
were transferred to the label<strong>in</strong>g box. Data are means SE (n <br />
25–55) from four experiments.<br />
root elongation rates and root-tip am<strong>in</strong>o acid concentrations<br />
(see below). Because root-tip label<strong>in</strong>g <strong>in</strong>volved transfer<br />
of the seedl<strong>in</strong>gs to another box and was done over a<br />
short time <strong>in</strong>terval, it was also necessary to exam<strong>in</strong>e the<br />
root elongation rate immediately after transfer to the label<strong>in</strong>g<br />
box to ensure that substantial fluctuations did not<br />
occur. Figure 2, <strong>in</strong>set, shows that root elongation was stable<br />
<strong>in</strong> the 2 h after transfer of seedl<strong>in</strong>gs at 1.6 MPa. In the<br />
high- w treatment, there was a small decrease <strong>in</strong> the root<br />
elongation rate dur<strong>in</strong>g the <strong>in</strong>itial 90 m<strong>in</strong> after transfer,<br />
followed by recovery to the normal rate. These root elongation<br />
rates were judged to be sufficiently stable for the<br />
label<strong>in</strong>g experiments.<br />
It was also necessary to measure time courses of root-tip<br />
am<strong>in</strong>o acid concentrations <strong>in</strong> the high- and low- w treatments<br />
before and after transfer to the label<strong>in</strong>g box to ensure<br />
that <strong>in</strong>terpretation of label<strong>in</strong>g was not complicated by <strong>in</strong>creases<br />
or decreases <strong>in</strong> concentration over time. Time<br />
courses of root-tip (apical 10 mm) concentrations of Pro,<br />
Glu, Gln, Arg, GABA, Asp, Asn, Ala, Ser, Thr, and Gly<br />
were measured. The results for Glu, Arg, and Pro are<br />
shown <strong>in</strong> Figure 3 because these am<strong>in</strong>o acids were the<br />
focus of much of the label<strong>in</strong>g studies and because the<br />
response of Glu and Arg concentrations to low w was<br />
similar to that of the other am<strong>in</strong>o acids measured.<br />
With the exception of Pro, all of the am<strong>in</strong>o acids exam<strong>in</strong>ed<br />
exhibited a rapid <strong>in</strong>crease <strong>in</strong> concentration after the<br />
addition of PEG, which was followed by a decl<strong>in</strong>e either to