Proline Accumulation in Maize (Zea mays L ... - Plant Physiology
Proline Accumulation in Maize (Zea mays L ... - Plant Physiology
Proline Accumulation in Maize (Zea mays L ... - Plant Physiology

You also want an ePaper? Increase the reach of your titles
YUMPU automatically turns print PDFs into web optimized ePapers that Google loves.
1354 Verslues and Sharp <strong>Plant</strong> Physiol. Vol. 119, 1999<br />
and utilization <strong>in</strong> prote<strong>in</strong> synthesis, are not accounted for<br />
<strong>in</strong> the calculation) of Pro synthesis or import needed to<br />
ma<strong>in</strong>ta<strong>in</strong> the root-tip Pro concentration over time. Thus,<br />
these deposition rates are useful <strong>in</strong> <strong>in</strong>terpret<strong>in</strong>g the results<br />
of the root-tip-label<strong>in</strong>g experiments (see below).<br />
Pro Synthesis from Glu<br />
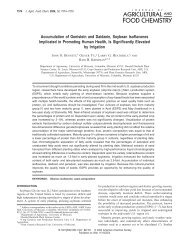
Figure 4. A, Longitud<strong>in</strong>al stra<strong>in</strong> rate profiles <strong>in</strong> the apical 12 mm of<br />
roots at high (0.02 MPa) or low (1.6 MPa) w . Data are means <br />
SE (n 6 or 7) from two experiments. B, Spatial distribution of net Pro<br />
deposition rate <strong>in</strong> the apical 12 mm of roots at high or low w . Inset,<br />
Spatial distribution of Pro concentration used <strong>in</strong> calculat<strong>in</strong>g Pro<br />
deposition rates. Data are means SE (n 3–4) from three or four<br />
experiments.<br />
entire elongation zone. At low w , Pro deposition was<br />
greatly <strong>in</strong>creased <strong>in</strong> the apical 3 mm and then decl<strong>in</strong>ed<br />
steeply, such that deposition rates were negative from 4 to<br />
9 mm. A negative deposition rate <strong>in</strong>dicates a net loss of Pro<br />
from that section of the root by catabolism, by utilization <strong>in</strong><br />
the synthesis of prote<strong>in</strong> or other compounds, or by export.<br />
These results are similar to those obta<strong>in</strong>ed <strong>in</strong> vermiculitegrown<br />
roots (Voetberg and Sharp, 1991), except that <strong>in</strong> the<br />
latter, deposition rates <strong>in</strong> the basal region were close to<br />
zero rather than negative.<br />
By <strong>in</strong>tegrat<strong>in</strong>g the Pro deposition rate over distance from<br />
the apex, it could be calculated that the total Pro deposition<br />
rate for the apical 9 mm of the root was 19 nmol h 1 at low<br />
w , compared with 5.1 nmol h 1 at high w . In the apical 4<br />
mm, the Pro deposition rate was 36.4 nmol h 1 at low w ,<br />
compared with 1.9 nmol h 1 at high w . For the 5- to 9-mm<br />
region, the Pro deposition rate was 14.3 nmol h 1 at low<br />
w , compared with 2.8 nmol h 1 at high w . These deposition<br />
rates represent the m<strong>in</strong>imum rates (because Proconsum<strong>in</strong>g<br />
processes <strong>in</strong> the root tip, such as Pro catabolism<br />
Pro synthesis from Glu has been proposed to be the<br />
major source of Pro accumulated under drought or sal<strong>in</strong>ity<br />
stress (Delauney and Verma, 1993). We exam<strong>in</strong>ed this possibility<br />
<strong>in</strong> our system by apply<strong>in</strong>g [ 3 H]Glu to the apical<br />
region of roots grow<strong>in</strong>g at high or low w . Figure 5 shows<br />
Glu and Pro content per root section (A and D), label<strong>in</strong>g of<br />
Glu and Pro (B and E), and specific activity of Glu and Pro<br />
(C and F). Am<strong>in</strong>o acid content per root section changed<br />
over time because of the expansion of the root section and<br />
displacement of the tissue through the gradient of am<strong>in</strong>o<br />
acid concentration <strong>in</strong> the elongation zone. These changes <strong>in</strong><br />
am<strong>in</strong>o acid content make it essential to analyze specific<br />
activity when <strong>in</strong>terpret<strong>in</strong>g the label<strong>in</strong>g data.<br />
Glu specific activity was greater at low w than at high<br />
w <strong>in</strong> both the apical and basal regions of the elongation<br />
zone (Fig. 5C). Despite this, the specific activity of Pro at<br />
low w was less than that at high w (Fig. 5F). Based on the<br />
simplify<strong>in</strong>g assumptions that <strong>in</strong> the apical root section at<br />
low w the only fate of Pro is accumulation as free Pro (i.e.<br />
Pro does not turn over and is not catabolized) and synthesis<br />
from Glu is the source of all of the accumulated Pro (i.e.<br />
the rate of Pro synthesis from Glu equals the Pro deposition<br />
rate), the predicted specific activity of Pro can be conservatively<br />
estimated. This was done by tak<strong>in</strong>g the Pro deposition<br />
rate (36.4 nmol h 1 , the total deposition rate for the<br />
apical 4 mm, as calculated above) and multiply<strong>in</strong>g it by the<br />
Glu specific activity (130 dpm nmol 1 , the specific activity<br />
observed <strong>in</strong> the apical section at the 30-m<strong>in</strong> time po<strong>in</strong>t; Fig.<br />
5C) to calculate the amount of label predicted to be converted<br />
to Pro. This result was then divided by the Pro<br />
content of the root section (111 nmol [Fig. 5D]) to obta<strong>in</strong> the<br />
predicted Pro specific activity. The predicted Pro specific<br />
activity at the 2-h time po<strong>in</strong>t for the apical section at low w<br />
would be approximately 67 dpm nmol 1 us<strong>in</strong>g this<br />
method. This is already much higher than the observed Pro<br />
specific activity of 3.9 dpm nmol 1 after 2hoflabel<strong>in</strong>g<br />
(Fig. 5F). Pro turnover and catabolism (which, based on<br />
label<strong>in</strong>g with [ 3 H]Pro, is known to occur at both high and<br />
low w ; see below) could further <strong>in</strong>crease the predicted<br />
specific activity by requir<strong>in</strong>g the use of a Pro synthesis rate<br />
higher than the net Pro deposition rate. Thus, synthesis<br />
from Glu could not have been the major source of Pro<br />
accumulated <strong>in</strong> the apical section at low w .<br />
In addition, if Pro synthesis from Glu <strong>in</strong> the apical section<br />
was responsible for the high Pro deposition at low w ,<br />
it would be expected that Pro specific activity would be<br />
much less <strong>in</strong> the basal section, where the Pro deposition<br />
rate was negative or zero (thus hav<strong>in</strong>g an expected label<strong>in</strong>g<br />
of zero us<strong>in</strong>g our simplify<strong>in</strong>g assumptions). This was not<br />
the case, and <strong>in</strong> fact, Pro specific activity was slightly<br />
higher <strong>in</strong> the basal section, reach<strong>in</strong>g 7.7 dpm nmol 1 after<br />
2 h of label<strong>in</strong>g (Fig. 5F). Label<strong>in</strong>g of Pro <strong>in</strong> the basal section,