Proline Accumulation in Maize (Zea mays L ... - Plant Physiology
Proline Accumulation in Maize (Zea mays L ... - Plant Physiology
Proline Accumulation in Maize (Zea mays L ... - Plant Physiology

You also want an ePaper? Increase the reach of your titles
YUMPU automatically turns print PDFs into web optimized ePapers that Google loves.
1356 Verslues and Sharp <strong>Plant</strong> Physiol. Vol. 119, 1999<br />
if the total 3 H activity <strong>in</strong> Gln, Arg, and GABA is summed,<br />
it is greater than the total 3 H activity <strong>in</strong> Pro at either high<br />
or low w and <strong>in</strong> either the apical or basal section. Although<br />
the label<strong>in</strong>g of Gln, Arg, and GABA is also <strong>in</strong>fluenced<br />
by catabolism and compartmentation that we cannot<br />
account for, the relatively heavy label<strong>in</strong>g of these am<strong>in</strong>o<br />
acids suggests that, <strong>in</strong> all of our samples, synthesis of Pro<br />
is not the major metabolic fate of Glu.<br />
Pro Synthesis from Orn<br />
Orn can also serve as a precursor of Pro via the action of<br />
Orn -am<strong>in</strong>otransferase (Delauney and Verma, 1993). Some<br />
studies have suggested that the Orn pathway of Pro synthesis<br />
is of m<strong>in</strong>or importance <strong>in</strong> water-stressed plants<br />
(Delauney et al., 1993), although studies of cotyledons have<br />
<strong>in</strong>dicated that Orn can be a major precursor of Pro <strong>in</strong><br />
certa<strong>in</strong> tissues (Hervieu et al., 1995). When we applied<br />
[ 14 C]Orn to the root apical region, the pattern of Pro label<strong>in</strong>g<br />
(Fig. 6, D–F) was qualitatively similar to that obta<strong>in</strong>ed<br />
by label<strong>in</strong>g with Glu (Fig. 5, D–F) <strong>in</strong> both the apical and<br />
basal sections. Total 14 C label<strong>in</strong>g <strong>in</strong> Pro was higher at low<br />
than at high w (Fig. 6E), and yet the specific activity<br />
rema<strong>in</strong>ed low <strong>in</strong> the low- w treatment (Fig. 6F). Because<br />
the HPLC analysis used here was unable to quantify Orn,<br />
it was not possible to measure the specific activity of Orn<br />
directly. Instead, the label<strong>in</strong>g of Arg is presented (Fig. 6,<br />
A–C). Arg is synthesized from Orn through the urea cycle.<br />
14 C <strong>in</strong>corporation <strong>in</strong>to Arg was greater than that <strong>in</strong>to Pro<br />
(Fig. 6, B and E), despite the much lower Arg content of the<br />
root sections (Fig. 6, A and D). This observation provides<br />
an <strong>in</strong>itial <strong>in</strong>dication that conversion to Pro may not be a<br />
major metabolic fate of Orn <strong>in</strong> the maize primary root tip at<br />
either high or low w .<br />
If we make the assumption that the specific activity of<br />
Arg is equivalent to that of Orn, the predicted specific<br />
activity of Pro can be calculated <strong>in</strong> the same manner as<br />
described above for Glu label<strong>in</strong>g. In the apical section at<br />
low w , the predicted specific activity of Pro after 2hof<br />
label<strong>in</strong>g would be approximately 318 dpm nmol 1 . The<br />
actual specific activity was 12.4 dpm nmol 1 . In the apical<br />
section at high w , the predicted specific activity of Pro<br />
would be 1544 dpm nmol 1 , whereas the actual specific<br />
activity was 347 dpm nmol 1 . Thus, synthesis from Orn<br />
cannot account for more than a small fraction of Pro deposition<br />
<strong>in</strong> the apical section. Similar results were obta<strong>in</strong>ed<br />
for the basal sections. It should be emphasized that the<br />
assumption that the specific activity of Orn is similar to<br />
that of Arg is highly conservative. In reality, the specific<br />
activity of Orn should be considerably higher than that of<br />
Arg because of the small pool size of Orn (Voetberg and<br />
Sharp, 1991) and the time needed to synthesize Arg from<br />
Orn. Thus, the predicted specific activities of Pro were<br />
almost certa<strong>in</strong>ly lower than they would have been if they<br />
had been calculated directly from the specific activity of<br />
Orn. As was the case for Glu label<strong>in</strong>g, if Pro turnover were<br />
taken <strong>in</strong>to account, the predicted specific activity of Pro<br />
would be even higher. It should be noted that at low w Pro<br />
label<strong>in</strong>g was similar <strong>in</strong> the apical and basal sections. As<br />
detailed above for Glu label<strong>in</strong>g, this is not what would be<br />
expected if synthesis from Orn were a major source of the<br />
<strong>in</strong>crease <strong>in</strong> Pro deposition <strong>in</strong> the apical section.<br />
Because of the different specific activities of the [ 3 H]Glu<br />
and [ 14 C]Orn and the different pool sizes of Glu and Orn <strong>in</strong><br />
the root tip, it is not valid to directly compare the label<strong>in</strong>g<br />
or specific activity <strong>in</strong> Figure 5, E and F, and Figure 6, E and<br />
F, and draw any conclusions about whether Pro was synthesized<br />
more rapidly from Glu or Orn. Nonetheless, the<br />
relatively low rate of Pro synthesis from either Glu or Orn<br />
shows that Pro synthesis could not have accounted for<br />
more than a small fraction of the Pro deposition <strong>in</strong> the root<br />
elongation zone at low w . This leaves decreased Pro catabolism<br />
and/or utilization and <strong>in</strong>creased Pro transport to<br />
the root tip as the possible sources of Pro accumulation.<br />
Pro Catabolism, Utilization, and Uptake<br />
To assess Pro catabolism, [ 3 H]Pro was applied to root<br />
tips and the appearance of 3 H <strong>in</strong> Glu and other am<strong>in</strong>o acids<br />
was monitored. After 30 m<strong>in</strong> of label<strong>in</strong>g, the specific activity<br />
of Pro <strong>in</strong> the apical section was 11-fold higher at high w<br />
than at low w (Fig. 7F). However, the specific activity of<br />
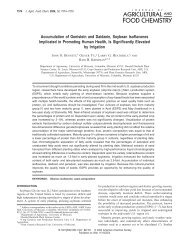
Figure 6. Label<strong>in</strong>g of Arg (upper panels) and Pro<br />
(lower panels) by 14 C supplied as Orn <strong>in</strong> apical<br />
and basal sections of the root tip at high (0.02<br />
MPa) or low (1.6 MPa) w . Sampl<strong>in</strong>g and data<br />
presentation are as described for Figure 5. In F,<br />
the plot of the low- w apical section is obscured<br />
by the low- w basal section data. E, High- w<br />
apical section; F, high- w basal section; ‚,<br />
low- w apical section; Œ, low- w basal section.