EXPERIMENT 5 Series Resonance in AC Circuits Figure 1
EXPERIMENT 5 Series Resonance in AC Circuits Figure 1
EXPERIMENT 5 Series Resonance in AC Circuits Figure 1

You also want an ePaper? Increase the reach of your titles
YUMPU automatically turns print PDFs into web optimized ePapers that Google loves.
Physics 112 Laboratory Exp. 5 – <strong>Series</strong> <strong>Resonance</strong> <strong>in</strong> <strong>AC</strong> <strong>Circuits</strong> (2004 Fall)<br />
<strong>EXPERIMENT</strong> 5<br />
<strong>Series</strong> <strong>Resonance</strong> <strong>in</strong> <strong>AC</strong> <strong>Circuits</strong><br />
Reference: Serway & Faughn, College Physics (6th. ed.), Chapter 21, Sections 21.4-6<br />
Purpose of this Experiment:<br />
A. To experimentally f<strong>in</strong>d the resonant frequency of an RLC circuit, and to compare it with the<br />
value predicted us<strong>in</strong>g the <strong>in</strong>ductance and capacitance <strong>in</strong> the circuit.<br />
B. To study the behavior of the current, the <strong>in</strong>ductive reactance, and the capacitive reactance <strong>in</strong><br />
the vic<strong>in</strong>ity of resonance.<br />
The calculations and answers to each of the Questions (below) should be <strong>in</strong>cluded <strong>in</strong><br />
your Lab Report, as well as your conclusions There is a data sheet at the end of this document<br />
(remember to get it signed by the T.A. before you leave the Laboratory).<br />
Overview & Theory:<br />
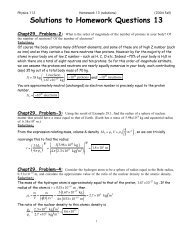
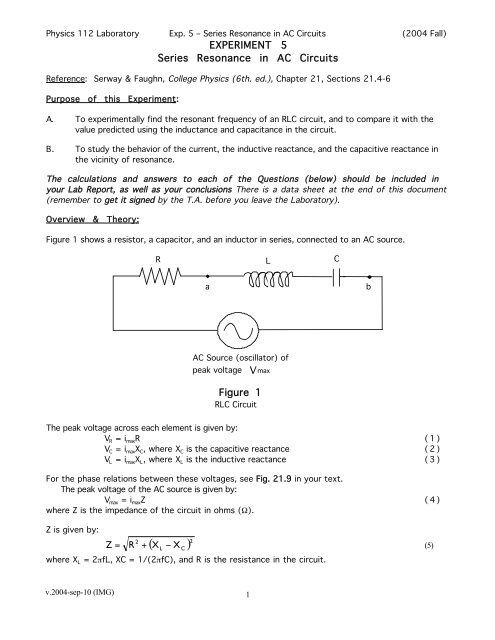
<strong>Figure</strong> 1 shows a resistor, a capacitor, and an <strong>in</strong>ductor <strong>in</strong> series, connected to an <strong>AC</strong> source.<br />
R<br />
L<br />
C<br />
a<br />
b<br />
<strong>AC</strong> Source (oscillator) of<br />
peak voltage<br />
Vmax<br />
<strong>Figure</strong> 1<br />
RLC Circuit<br />
The peak voltage across each element is given by:<br />
V R = i max R (1)<br />
V C = i max X C , where X C is the capacitive reactance (2)<br />
V L = i max X L , where X L is the <strong>in</strong>ductive reactance (3)<br />
For the phase relations between these voltages, see Fig. 21.9 <strong>in</strong> your text.<br />
The peak voltage of the <strong>AC</strong> source is given by:<br />
V max = i max Z (4)<br />
where Z is the impedance of the circuit <strong>in</strong> ohms (Ω).<br />
Z is given by:<br />
Z<br />
( X − X ) 2<br />
2<br />
= R +<br />
L C<br />
(5)<br />
where X L = 2πfL, XC = 1/(2πfC), and R is the resistance <strong>in</strong> the circuit.<br />
v.2004-sep-10 (IMG)<br />
1
Physics 112 Laboratory Exp. 5 – <strong>Series</strong> <strong>Resonance</strong> <strong>in</strong> <strong>AC</strong> <strong>Circuits</strong> (2004 Fall)<br />
Note, <strong>in</strong> Equations (1)-(4) the maximum values of the <strong>AC</strong> currents and voltages are used rather<br />
than the effective values I and V. S<strong>in</strong>ce I = 0.707 i max and V = 0.707 v max , we are free to use either set<br />
of values. S<strong>in</strong>ce it is easier to obta<strong>in</strong> i max and V max from the screen of the oscilloscope, we use the<br />
maximum values here.<br />
(X L - X C ) is the equivalent reactance between po<strong>in</strong>ts a and b <strong>in</strong> <strong>Figure</strong> 1. This part of the circuit<br />
consists of an <strong>in</strong>ductor and a capacitor <strong>in</strong> series. The m<strong>in</strong>us sign of X C <strong>in</strong>dicates that the voltage across<br />
the <strong>in</strong>ductor is 180° out of phase with the voltage across the capacitor. The maximum voltage V L+C<br />
between po<strong>in</strong>ts a and b is given by:<br />
V L+C = i max (X L -X C ) (6)<br />
There is a specific frequency, called the resonant frequency, f res , at which X L = X C . The theoretical<br />
value of f res is obta<strong>in</strong>ed by sett<strong>in</strong>g<br />
lead<strong>in</strong>g to<br />
X L = 2πf res L equal to X<br />
f res<br />
C<br />
1<br />
=<br />
2π<br />
f<br />
res<br />
C<br />
1 1<br />
= (7)<br />
2π<br />
LC<br />
At resonance, accord<strong>in</strong>g to Equation (5) and <strong>Figure</strong> 2, Z = R. Therefore, i max = V max /R and the<br />
current <strong>in</strong> the circuit has its maximum value. Also, Equation (6) predicts that V L+C = 0 s<strong>in</strong>ce X L - X C<br />
= 0. In practice, V L+C is a m<strong>in</strong>imum rather than zero at resonance because of the small amount of<br />
resistance between po<strong>in</strong>ts a and b due to the resistance of the <strong>in</strong>ductance coil.<br />
In this experiment, you will f<strong>in</strong>d f res for a particular RLC circuit by not<strong>in</strong>g where V L+C is a<br />
m<strong>in</strong>imum. This experimental value of f res will then be compared to the theoretical value given by<br />
Equation (7).<br />
Apparatus:<br />
Fixed-value <strong>in</strong>ductor, capacitance box, resistance box, <strong>AC</strong> ammeter, oscilloscope, signal<br />
generator.<br />
v.2004-sep-10 (IMG)<br />
2
Physics 112 Laboratory Exp. 5 – <strong>Series</strong> <strong>Resonance</strong> <strong>in</strong> <strong>AC</strong> <strong>Circuits</strong> (2004 Fall)<br />
Procedure:<br />
1. Set up the circuit shown <strong>in</strong> <strong>Figure</strong> 1. Choose a capacitance which, when comb<strong>in</strong>ed with the<br />
given <strong>in</strong>ductance, will give a resonant frequency somewhere between 1,000 and 10,000 Hz.<br />
Use Equation (7) to f<strong>in</strong>d an approximate value of C correspond<strong>in</strong>g to whatever f res you choose.<br />
Then choose a capacitance close to that. Record the values of C, L, and R <strong>in</strong> the Datasheet.<br />
2. Connect the CRO across po<strong>in</strong>ts a and b <strong>in</strong> the circuit of <strong>Figure</strong> 1. (This will enable you to<br />
measure V L+C .) Sweep through a range of frequencies below and above f res . Notice that V L+C is a<br />
m<strong>in</strong>imum at f res . It’s not zero as Equation (6) predicts because there is a non-negligible<br />
amount of resistance <strong>in</strong> the <strong>in</strong>ductor.<br />
3. Place an <strong>AC</strong> ammeter <strong>in</strong> the circuit to measure the current.<br />
4. Set the frequency to someth<strong>in</strong>g below resonance and record the value of V L+C from off the CRO,<br />
and the current from the <strong>AC</strong> ammeter. Recall from Experiment 4 that you likely will need to<br />
measure the frequency with the CRO.<br />
5. Measure the <strong>in</strong>ductive reactance X L . To do this, measure the voltage across the <strong>in</strong>ductor, V L ,<br />
with the oscilloscope and use Equation 3. S<strong>in</strong>ce the <strong>AC</strong> ammeter measures effective current,<br />
the maximum current must be calculated by multiply<strong>in</strong>g by 2 .<br />
6. Next measure the capacitive reactance, X C , us<strong>in</strong>g Equation 2.<br />
7. Repeat procedures 4 through 6 for n<strong>in</strong>e additional frequencies (four more below and five above<br />
resonance). One of your frequencies should be as close to resonance as you can get. The<br />
frequencies above and below should show the full range of changes <strong>in</strong> current.<br />
Graph One:<br />
Plot V L+C vs. frequency, f, for the ten frequencies at which you measured V L+C .<br />
Question One:<br />
F<strong>in</strong>d the experimental value of f res from this plot. In other words, by hand of<br />
otherwise draw a best fit l<strong>in</strong>e between the po<strong>in</strong>ts. Remember the parabolic<br />
nature of the curve.<br />
Question Two:<br />
Calculate the theoretical value of f res from Equation (7).<br />
Question Three:<br />
Calculate the percentage difference between the experimental and theoretical<br />
values of f res .<br />
Graph Two:<br />
Plot the values of X L and X C obta<strong>in</strong>ed above as a function of frequency.<br />
Immediately below, plot the current as a function of frequency.<br />
v.2004-sep-10 (IMG)<br />
3
Physics 112 Laboratory Exp. 5 – <strong>Series</strong> <strong>Resonance</strong> <strong>in</strong> <strong>AC</strong> <strong>Circuits</strong> (2004 Fall)<br />
Question Four:<br />
Compare the follow<strong>in</strong>g three results from your data:<br />
a. The frequency at which V L+C is a m<strong>in</strong>imum.<br />
b. The frequency at which X L = X C .<br />
c. The frequency at which the current is a maximum.<br />
Question Five:<br />
From your results suggest alternative def<strong>in</strong>itions of the resonant frequency of<br />
an RLC series circuit.<br />
F<strong>in</strong>al Conclusions<br />
At the end of your Lab Report, cover the follow<strong>in</strong>g topics <strong>in</strong> separate, concise paragraphs<br />
1. The Experimental Results, <strong>in</strong>clud<strong>in</strong>g the measurement uncerta<strong>in</strong>ties ('errors').<br />
2. The Sources contribut<strong>in</strong>g to the Uncerta<strong>in</strong>ty <strong>in</strong> the f<strong>in</strong>al result(s), <strong>in</strong>clud<strong>in</strong>g<br />
estimates for the magnitudes and sources of systematic and random errors.<br />
3. Summary of what you have leant from this experiment, and how it relates to the<br />
Objectives and Theory beh<strong>in</strong>d the experiment.<br />
END OF <strong>EXPERIMENT</strong><br />
v.2004-sep-10 (IMG)<br />
4
Physics 112 Laboratory Exp. 5 – <strong>Series</strong> <strong>Resonance</strong> <strong>in</strong> <strong>AC</strong> <strong>Circuits</strong> (2004 Fall)<br />
DATA SHEET #1<br />
Name:(Last/First)<br />
Date<br />
T.A. signature<br />
Section<br />
v.2004-sep-10 (IMG)<br />
5