Soft Matter - User Web Pages - Monash University
Soft Matter - User Web Pages - Monash University
Soft Matter - User Web Pages - Monash University

Create successful ePaper yourself
Turn your PDF publications into a flip-book with our unique Google optimized e-Paper software.
<strong>Soft</strong> <strong>Matter</strong><br />
View Article Online<br />
Paper<br />
Downloaded by <strong>Monash</strong> <strong>University</strong> on 13 March 2013<br />
Published on 22 February 2013 on http://pubs.rsc.org | doi:10.1039/C3SM00016H<br />
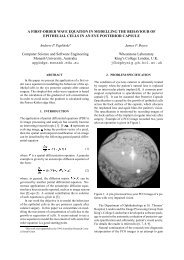
Fig. 3 Scanning electron micrographs at higher magnifications that provide a<br />
clearer picture of the (a) granular and (b) dendritic structures developed.<br />
grew in size with longer immersion times until about 10–20<br />
seconds. At the 20 seconds mark, the granules appeared to<br />
shrink slightly in size whilst exhibiting greater dendritic growth<br />
from the surface of each granule. From then onwards, the<br />
dendritic structures began to proliferate on the existing granular<br />
structures, developing later into fern-like foliage. The<br />
distinct differences between these two types of structures<br />
(granular and dendritic) are shown more clearly in the higher<br />
magnication micrographs provided in Fig. 3.<br />
The time dependent morphology changes appear to indicate<br />
that granular growth beyond a certain size was not feasible,<br />
although granular structures were more preferentially formed<br />
just aer nucleation. This is likely due to the natural tendency<br />
of the process to maintain or increase the surface area to<br />
volume ratio in order not to limit the rate of deposition. Taking<br />
a sphere for example, the surface area to volume ratio scales<br />
according to 3/r, where r is the radius, inferring that the surface<br />
area to volume ratio reduces as the sphere increases in size.<br />
Thus, the formation of dendritic structures offers an avenue by<br />
nature to circumvent this obstacle. This argument is supported<br />
somewhat by the XRD maps obtained that revealed no signicant<br />
elemental changes in the structures.<br />
Aer the surfaces were treated with the modier, we found<br />
that immersion for at least 7 seconds into the silver nitrate<br />
solution was all that was needed to ensure superhydrophobicity<br />
of the surfaces. At this stage, the structures appeared to be<br />
predominantly granular. Previous studies have shown that<br />
granular structures alone were sufficient to cause superhydrophobicity.<br />
26 Hence, we were able to conclude that the<br />
subsequent dendritic structures were not needed to maintain<br />
the non-wetting characteristic, although they seemed not to<br />
have a role in modifying it. The micrograph at 5 seconds<br />
immersion also showed signicant coverage of granular structures<br />
over the substrate. This presented an interesting conundrum<br />
as to why superhydrophobicity could not be sustained at<br />
this stage. On more careful examination, we found that there<br />
were regions on the substrate surface where the granular<br />
structures were not fully developed. It appears then that the<br />
superhydrophobic state requires not just signicant numbers of<br />
the granular structures to be present on the surface but also<br />
uninterrupted structure coverage.<br />
We move now to discuss the experimentation results in<br />
obtaining the drops. During each run on liquid deposition, the<br />
nebulizer was cyclically pulsed on for 5 seconds and off for 5<br />
seconds. This was done to accommodate the response time of<br />
the weighing scale. Fig. 4 presents results of the mass recorded<br />
in relation to time in which the nebulizer was operated for three<br />
typical runs. Highly linear trends are observed, indicating that<br />
xed quanta of liquid were dispensed with each pulsed operation<br />
of the nebulizer for a specic run. While the data for two of<br />
the runs were almost identical, the gradient for a third run was<br />
signicantly altered. This was due to the process that happens<br />
in the tissue as it served to draw liquid out from the reservoir<br />
before perturbations from the SAW device are able to dislodge it<br />
for delivery. In the course of this process, factors that affect the<br />
transfer of liquid in and out of the tissue (such as temperature<br />
and airborne particles attaching to the bers) likely caused the<br />
ow rate to vary with each run.<br />
This result implied that an open-loop operation using precalibration<br />
without using the weighing scale was not feasible.<br />
Due to the ability of the SAW driven nebulizer to operate nearly<br />
instantly, from zero to full power and to zero power again in<br />
Fig. 4 Plots of the readings from the weighing scale against the operation time of the nebulizer. The trends from each run are highly linear, albeit the slope variation<br />
indicates that pre-calibrated operation without the weighing scale was not feasible.<br />
3634 | <strong>Soft</strong> <strong>Matter</strong>, 2013, 9, 3631–3639 This journal is ª The Royal Society of Chemistry 2013