Annual Report 2007 - Publications Unit - The University of Western ...
Annual Report 2007 - Publications Unit - The University of Western ...
Annual Report 2007 - Publications Unit - The University of Western ...

Create successful ePaper yourself
Turn your PDF publications into a flip-book with our unique Google optimized e-Paper software.
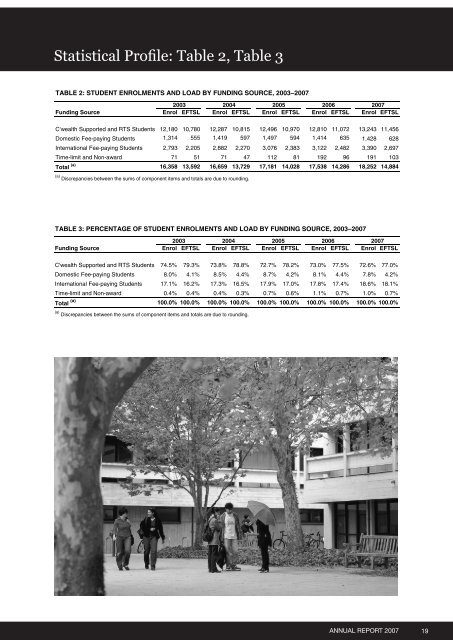
Statistical Pr<strong>of</strong>ile: Table 2, Table 3<br />
TABLE 2: STUDENT ENROLMENTS AND LOAD BY FUNDING SOURCE, 2003–<strong>2007</strong><br />
2003 2004 2005 2006 <strong>2007</strong><br />
Funding Source Enrol EFTSL Enrol EFTSL Enrol EFTSL Enrol EFTSL Enrol EFTSL<br />
TABLE 2: STUDENT ENROLMENTS AND LOAD BY FUNDING SOURCE, 2003–<strong>2007</strong><br />
C'wealth Supported and RTS Students 12,180 10,780 12,287 10,815 12,496 10,970 12,810 11,072 13,243 11,456<br />
2003 2004 2005 2006 <strong>2007</strong><br />
Funding Domestic Source Fee-paying Students Enrol 1,314 EFTSL 555 Enrol 1,419 EFTSL 597 Enrol 1,497 EFTSL 594 Enrol 1,414 EFTSL 635 Enrol 1,428 EFTSL 628<br />
International Fee-paying Students 2,793 2,205 2,882 2,270 3,076 2,383 3,122 2,482 3,390 2,697<br />
C'wealth Time-limit Supported and Non-award and RTS Students 12,180 71 10,780 51 12,287 71 10,815 47 12,496 112 10,970 81 12,810 192 11,072 96 13,243 191 11,456 103<br />
Domestic Total (a) Fee-paying Students 16,358 1,314 13,592 555 16,659 1,419 13,729 597 17,181 1,497 14,028 594 17,538 1,414 14,286 635 18,252 1,428 14,884 628<br />
International (a) Fee-paying Students 2,793 2,205 2,882 2,270 3,076 2,383 3,122 2,482 3,390 2,697<br />
Discrepancies between the sums <strong>of</strong> component items and totals are due to rounding.<br />
Time-limit and Non-award 71 51 71 47 112 81 192 96 191 103<br />
Total (a) 16,358 13,592 16,659 13,729 17,181 14,028 17,538 14,286 18,252 14,884<br />
(a) TABLE 3: PERCENTAGE OF STUDENT ENROLMENTS AND LOAD BY FUNDING SOURCE, 2003–<strong>2007</strong><br />
Discrepancies between the sums <strong>of</strong> component items and totals are due to rounding.<br />
2003 2004 2005 2006 <strong>2007</strong><br />
Funding Source Enrol EFTSL Enrol EFTSL Enrol EFTSL Enrol EFTSL Enrol EFTSL<br />
TABLE 3: PERCENTAGE OF STUDENT ENROLMENTS AND LOAD BY FUNDING SOURCE, 2003–<strong>2007</strong><br />
C'wealth Supported and RTS Students 74.5% 79.3%<br />
2003<br />
73.8% 78.8%<br />
2004<br />
72.7% 78.2%<br />
2005<br />
73.0% 77.5%<br />
2006<br />
72.6% 77.0%<br />
<strong>2007</strong><br />
Funding Domestic Source Fee-paying Students Enrol 8.0% EFTSL 4.1% Enrol 8.5% EFTSL 4.4% Enrol 8.7% EFTSL 4.2% Enrol 8.1% EFTSL 4.4% Enrol 7.8% EFTSL 4.2%<br />
International Fee-paying Students 17.1% 16.2% 17.3% 16.5% 17.9% 17.0% 17.8% 17.4% 18.6% 18.1%<br />
C'wealth Time-limit Supported and Non-award and RTS Students 74.5% 0.4% 79.3% 0.4% 73.8% 0.4% 78.8% 0.3% 72.7% 0.7% 78.2% 0.6% 73.0% 1.1% 77.5% 0.7% 72.6% 1.0% 77.0% 0.7%<br />
Domestic Total (a) Fee-paying Students 100.0% 8.0% 100.0% 4.1% 100.0% 8.5% 100.0% 4.4% 100.0% 8.7% 100.0% 4.2% 100.0% 8.1% 100.0% 4.4% 100.0% 7.8% 100.0% 4.2%<br />
International (a) Fee-paying Students 17.1% 16.2% 17.3% 16.5% 17.9% 17.0% 17.8% 17.4% 18.6% 18.1%<br />
Discrepancies between the sums <strong>of</strong> component items and totals are due to rounding.<br />
Time-limit and Non-award 0.4% 0.4% 0.4% 0.3% 0.7% 0.6% 1.1% 0.7% 1.0% 0.7%<br />
Total (a) 100.0% 100.0% 100.0% 100.0% 100.0% 100.0% 100.0% 100.0% 100.0% 100.0%<br />
(a) Discrepancies between the sums <strong>of</strong> component items and totals are due to rounding.<br />
<strong>The</strong> ANNUAL <strong>University</strong> REPORT <strong>of</strong> <strong>Western</strong> <strong>2007</strong>Australia19