Annual Report 2007 - Publications Unit - The University of Western ...
Annual Report 2007 - Publications Unit - The University of Western ...
Annual Report 2007 - Publications Unit - The University of Western ...

You also want an ePaper? Increase the reach of your titles
YUMPU automatically turns print PDFs into web optimized ePapers that Google loves.
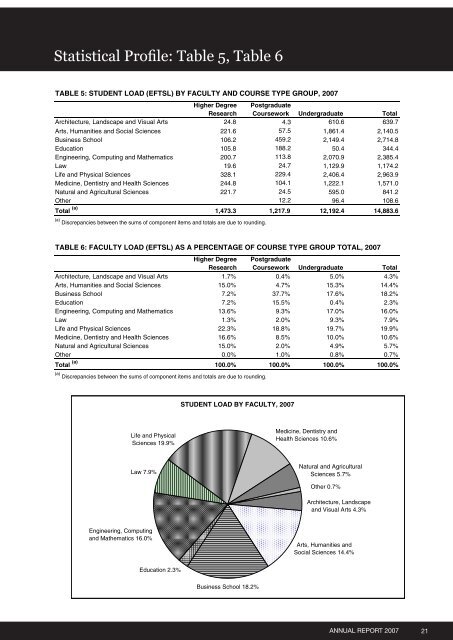
Statistical Pr<strong>of</strong>ile: Table 5, Table 6<br />
TABLE 5: STUDENT LOAD (EFTSL) BY FACULTY AND COURSE TYPE GROUP, <strong>2007</strong><br />
Higher Degree Postgraduate<br />
TABLE 5: STUDENT LOAD (EFTSL) BY FACULTY Research AND COURSE Coursework TYPE GROUP, Undergraduate <strong>2007</strong><br />
Total<br />
Architecture, Landscape and Visual Arts Higher Degree 24.8 Postgraduate 4.3 610.6 639.7<br />
Arts, TABLE Humanities 5: STUDENT and Social LOAD Sciences (EFTSL) BY FACULTY Research 221.6 AND COURSE Coursework TYPE 57.5 GROUP, Undergraduate <strong>2007</strong> 1,861.4 2,140.5 Total<br />
Architecture, Business Landscape School and Visual Arts Higher Degree 24.8 106.2 Postgraduate 459.2 4.3 2,149.4 610.6 2,714.8 639.7<br />
Arts, Humanities Education and Social Sciences Research 221.6 105.8 Coursework 188.2 57.5 Undergraduate 1,861.4 50.4 2,140.5 Total 344.4<br />
Business<br />
Engineering, Architecture, School<br />
Computing Landscape and Mathematics Visual Arts 106.2<br />
200.7 24.8 459.2<br />
113.8 4.3 2,070.9<br />
2,149.4 610.6 2,385.4<br />
2,714.8 639.7<br />
Education Arts, Law Humanities and Social Sciences 105.8 221.6 19.6<br />
188.2 57.5 24.7 1,861.4 1,129.9<br />
50.4 2,140.5 1,174.2<br />
344.4<br />
Engineering, Business Life and Physical<br />
Computing School Sciences<br />
and Mathematics 200.7 106.2 328.1<br />
113.8 459.2 229.4 2,149.4 2,406.4<br />
2,070.9 2,714.8 2,963.9<br />
2,385.4<br />
Education Medicine, Dentistry and Health Sciences 105.8 244.8 188.2 104.1 1,222.1<br />
Law 19.6 24.7<br />
50.4 1,571.0 344.4<br />
1,129.9 1,174.2<br />
Engineering, Natural and Agricultural Computing Sciences and Mathematics 200.7 221.7 113.8 24.5 2,070.9 595.0 2,385.4 841.2<br />
Life and Physical Sciences 328.1 229.4 2,406.4 2,963.9<br />
Law Other 19.6 12.2 24.7 1,129.9 96.4 1,174.2 108.6<br />
Medicine, Dentistry and Health Sciences 244.8 104.1 1,222.1 1,571.0<br />
Total Life and (a) Physical Sciences 1,473.3 328.1 1,217.9 229.4 12,192.4 2,406.4 14,883.6 2,963.9<br />
Natural and Agricultural Sciences 221.7 24.5 595.0 841.2<br />
(a) Medicine, Dentistry and Health Sciences 244.8 104.1 1,222.1 1,571.0<br />
Other Discrepancies between the sums <strong>of</strong> component items and totals are due to rounding.<br />
12.2<br />
Natural and Agricultural Sciences 221.7 24.5 595.0<br />
96.4<br />
841.2<br />
108.6<br />
Total (a) Other 1,473.3 1,217.9 12.2 12,192.4 96.4 14,883.6 108.6<br />
(a) Discrepancies Total TABLE (a) 6: between FACULTY the sums LOAD <strong>of</strong> component (EFTSL) items AS and A PERCENTAGE totals are 1,473.3 due to rounding. OF COURSE 1,217.9TYPE GROUP 12,192.4 TOTAL, <strong>2007</strong> 14,883.6<br />
(a) Discrepancies between the sums <strong>of</strong> component items and totals are due to rounding.<br />
Higher Degree Postgraduate<br />
Research Coursework Undergraduate Total<br />
TABLE Architecture, 6: FACULTY Landscape LOAD and (EFTSL) Visual ArtsAS A PERCENTAGE 1.7% OF COURSE 0.4% TYPE GROUP 5.0% TOTAL, <strong>2007</strong>4.3%<br />
Arts, TABLE Humanities 6: FACULTY and Social LOAD Sciences (EFTSL) AS A PERCENTAGE 15.0% OF COURSE 4.7% TYPE GROUP 15.3% TOTAL, <strong>2007</strong>14.4%<br />
Higher Degree Postgraduate<br />
Business School Higher Research Degree 7.2%<br />
Coursework Postgraduate 37.7% 17.6% 18.2%<br />
Undergraduate Total<br />
Education<br />
Architecture, Landscape and Visual Arts<br />
Research 7.2%<br />
1.7%<br />
Coursework 15.5%<br />
0.4%<br />
Undergraduate 0.4%<br />
5.0%<br />
Total 2.3%<br />
4.3%<br />
Engineering, Architecture, Computing Landscape and Mathematics Visual Arts 13.6% 1.7% 9.3% 0.4% 17.0% 5.0% 16.0% 4.3%<br />
Arts, Humanities and Social Sciences 15.0% 4.7% 15.3% 14.4%<br />
Arts, Law Humanities and Social Sciences 15.0% 1.3% 4.7% 2.0% 15.3% 9.3% 14.4% 7.9%<br />
Business School 7.2% 37.7% 17.6% 18.2%<br />
Business Life and Physical School Sciences 22.3% 7.2% 18.8% 37.7% 19.7% 17.6% 19.9% 18.2%<br />
Education Medicine, 7.2% 15.5% 0.4% 2.3%<br />
EducationDentistry and Health Sciences 16.6% 7.2% 15.5% 8.5% 10.0% 0.4% 10.6% 2.3%<br />
Engineering, Natural Computing and Mathematics 13.6% 9.3% 17.0% 16.0%<br />
Engineering, and Agricultural Computing Sciences and Mathematics 15.0% 13.6% 2.0% 9.3% 17.0% 4.9% 16.0% 5.7%<br />
Law Other Law<br />
1.3% 0.0% 1.3%<br />
2.0% 1.0% 2.0% 0.8% 9.3%<br />
9.3% 0.7% 7.9%<br />
7.9%<br />
Life and Total Life Physical and Physical Sciences Sciences 22.3% 100.0% 22.3% 100.0% 18.8% 18.8% 100.0% 19.7% 100.0% 19.9% 19.9%<br />
Medicine, (a) Medicine, Dentistry Dentistry and Health and Health Sciences Sciences 16.6% Discrepancies between the sums <strong>of</strong> component items and totals are<br />
16.6% due to rounding.<br />
8.5% 10.0% 10.6% 10.6%<br />
Natural Natural and Agricultural and Agricultural Sciences Sciences 15.0% 15.0% 2.0% 4.9% 5.7% 5.7%<br />
Other Other 0.0% 0.0% 1.0% 0.8% 0.7%<br />
Total (a) Total (a) 100.0% 100.0% 100.0% 100.0%<br />
(a) (a) STUDENT LOAD BY FACULTY, <strong>2007</strong><br />
Discrepancies Discrepancies between between the sums the sums <strong>of</strong> component <strong>of</strong> component items items and and totals totals are are due due to to rounding.<br />
Medicine, Dentistry and<br />
Life and Physical<br />
STUDENT LOAD BY FACULTY, Health <strong>2007</strong>Sciences 10.6%<br />
Sciences 19.9% STUDENT LOAD BY FACULTY, <strong>2007</strong><br />
Law<br />
Life and<br />
7.9%<br />
Physical<br />
Life and Sciences Physical 19.9%<br />
Sciences 19.9%<br />
Law 7.9%<br />
Law 7.9%<br />
Engineering, Computing<br />
and Mathematics 16.0%<br />
Engineering, Computing<br />
and Mathematics 16.0% Education 2.3%<br />
Engineering, Computing<br />
and Mathematics 16.0%<br />
Education 2.3%<br />
Education 2.3%<br />
Business School 18.2%<br />
Business School 18.2%<br />
Business School 18.2%<br />
Medicine, Natural Dentistry and and Agricultural<br />
Medicine, Health Sciences Dentistry 10.6% and<br />
Sciences 5.7%<br />
Health Sciences 10.6%<br />
Other 0.7%<br />
Natural Architecture, and Agricultural Landscape<br />
Natural Sciences and and Visual Agricultural 5.7% Arts 4.3%<br />
Sciences 5.7%<br />
Other 0.7%<br />
Other 0.7%<br />
Architecture, Landscape<br />
Arts, Architecture, Humanities and Visual Arts 4.3%<br />
Landscape<br />
Social and Sciences Visual 14.4% Arts 4.3%<br />
Arts, Humanities and<br />
Social Sciences 14.4%<br />
Arts, Humanities and<br />
Social Sciences 14.4%<br />
<strong>The</strong> ANNUAL <strong>University</strong> REPORT <strong>of</strong> <strong>Western</strong> <strong>2007</strong>Australia21