Q2 2009 Report to Unitholders - English version (PDF 1.78 ... - RioCan
Q2 2009 Report to Unitholders - English version (PDF 1.78 ... - RioCan
Q2 2009 Report to Unitholders - English version (PDF 1.78 ... - RioCan

Create successful ePaper yourself
Turn your PDF publications into a flip-book with our unique Google optimized e-Paper software.
MANAGEMENT’S DISCUSSION AND ANALYSIS<br />
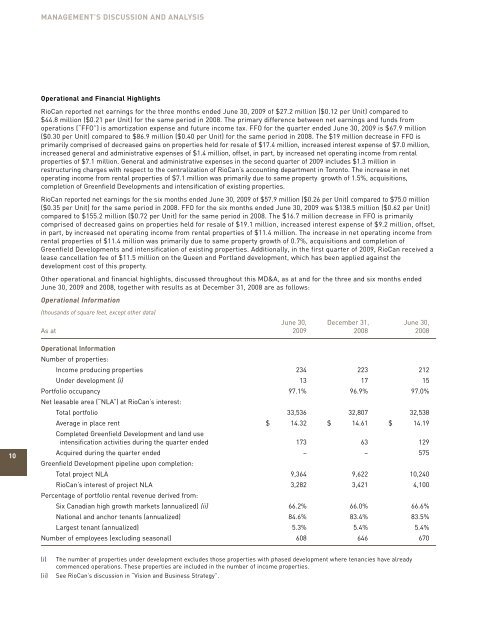
Operational and Financial Highlights<br />
<strong>RioCan</strong> reported net earnings for the three months ended June 30, <strong>2009</strong> of $27.2 million ($0.12 per Unit) compared <strong>to</strong><br />
$44.8 million ($0.21 per Unit) for the same period in 2008. The primary difference between net earnings and funds from<br />
operations (“FFO”) is amortization expense and future income tax. FFO for the quarter ended June 30, <strong>2009</strong> is $67.9 million<br />
($0.30 per Unit) compared <strong>to</strong> $86.9 million ($0.40 per Unit) for the same period in 2008. The $19 million decrease in FFO is<br />
primarily comprised of decreased gains on properties held for resale of $17.4 million, increased interest expense of $7.0 million,<br />
increased general and administrative expenses of $1.4 million, offset, in part, by increased net operating income from rental<br />
properties of $7.1 million. General and administrative expenses in the second quarter of <strong>2009</strong> includes $1.3 million in<br />
restructuring charges with respect <strong>to</strong> the centralization of <strong>RioCan</strong>’s accounting department in Toron<strong>to</strong>. The increase in net<br />
operating income from rental properties of $7.1 million was primarily due <strong>to</strong> same property growth of 1.5%, acquisitions,<br />
completion of Greenfield Developments and intensification of existing properties.<br />
<strong>RioCan</strong> reported net earnings for the six months ended June 30, <strong>2009</strong> of $57.9 million ($0.26 per Unit) compared <strong>to</strong> $75.0 million<br />
($0.35 per Unit) for the same period in 2008. FFO for the six months ended June 30, <strong>2009</strong> was $138.5 million ($0.62 per Unit)<br />
compared <strong>to</strong> $155.2 million ($0.72 per Unit) for the same period in 2008. The $16.7 million decrease in FFO is primarily<br />
comprised of decreased gains on properties held for resale of $19.1 million, increased interest expense of $9.2 million, offset,<br />
in part, by increased net operating income from rental properties of $11.4 million. The increase in net operating income from<br />
rental properties of $11.4 million was primarily due <strong>to</strong> same property growth of 0.7%, acquisitions and completion of<br />
Greenfield Developments and intensification of existing properties. Additionally, in the first quarter of <strong>2009</strong>, <strong>RioCan</strong> received a<br />
lease cancellation fee of $11.5 million on the Queen and Portland development, which has been applied against the<br />
development cost of this property.<br />
Other operational and financial highlights, discussed throughout this MD&A, as at and for the three and six months ended<br />
June 30, <strong>2009</strong> and 2008, <strong>to</strong>gether with results as at December 31, 2008 are as follows:<br />
Operational Information<br />
(thousands of square feet, except other data)<br />
June 30, December 31, June 30,<br />
As at <strong>2009</strong> 2008 2008<br />
10<br />
Operational Information<br />
Number of properties:<br />
Income producing properties 234 223 212<br />
Under development (i) 13 17 15<br />
Portfolio occupancy 97.1% 96.9% 97.0%<br />
Net leasable area (“NLA”) at <strong>RioCan</strong>’s interest:<br />
Total portfolio 33,536 32,807 32,538<br />
Average in place rent $ 14.32 $ 14.61 $ 14.19<br />
Completed Greenfield Development and land use<br />
intensification activities during the quarter ended 173 63 129<br />
Acquired during the quarter ended – – 575<br />
Greenfield Development pipeline upon completion:<br />
Total project NLA 9,364 9,622 10,240<br />
<strong>RioCan</strong>’s interest of project NLA 3,282 3,421 4,100<br />
Percentage of portfolio rental revenue derived from:<br />
Six Canadian high growth markets (annualized) (ii) 66.2% 66.0% 66.6%<br />
National and anchor tenants (annualized) 84.6% 83.4% 83.5%<br />
Largest tenant (annualized) 5.3% 5.4% 5.4%<br />
Number of employees (excluding seasonal) 608 646 670<br />
(i)<br />
(ii)<br />
The number of properties under development excludes those properties with phased development where tenancies have already<br />
commenced operations. These properties are included in the number of income properties.<br />
See <strong>RioCan</strong>’s discussion in “Vision and Business Strategy”.