Q2 2009 Report to Unitholders - English version (PDF 1.78 ... - RioCan
Q2 2009 Report to Unitholders - English version (PDF 1.78 ... - RioCan
Q2 2009 Report to Unitholders - English version (PDF 1.78 ... - RioCan

Create successful ePaper yourself
Turn your PDF publications into a flip-book with our unique Google optimized e-Paper software.
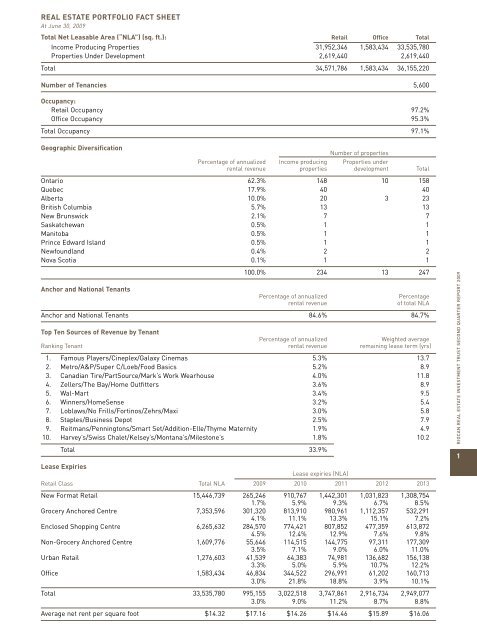
REAL ESTATE PORTFOLIO FACT SHEET<br />
At June 30, <strong>2009</strong><br />
Total Net Leasable Area (“NLA”) (sq. ft.): Retail Office Total<br />
Income Producing Properties 31,952,346 1,583,434 33,535,780<br />
Properties Under Development 2,619,440 2,619,440<br />
Total 34,571,786 1,583,434 36,155,220<br />
Number of Tenancies 5,600<br />
Occupancy:<br />
Retail Occupancy 97.2%<br />
Office Occupancy 95.3%<br />
Total Occupancy 97.1%<br />
Geographic Diversification<br />
Number of properties<br />
Percentage of annualized Income producing Properties under<br />
rental revenue properties development Total<br />
Ontario 62.3% 148 10 158<br />
Quebec 17.9% 40 40<br />
Alberta 10.0% 20 3 23<br />
British Columbia 5.7% 13 13<br />
New Brunswick 2.1% 7 7<br />
Saskatchewan 0.5% 1 1<br />
Mani<strong>to</strong>ba 0.5% 1 1<br />
Prince Edward Island 0.5% 1 1<br />
Newfoundland 0.4% 2 2<br />
Nova Scotia 0.1% 1 1<br />
100.0% 234 13 247<br />
Anchor and National Tenants<br />
Percentage of annualized<br />
Percentage<br />
rental revenue<br />
of <strong>to</strong>tal NLA<br />
Anchor and National Tenants 84.6% 84.7%<br />
Top Ten Sources of Revenue by Tenant<br />
Percentage of annualized<br />
Weighted average<br />
Ranking Tenant rental revenue remaining lease term (yrs)<br />
1. Famous Players/Cineplex/Galaxy Cinemas 5.3% 13.7<br />
2. Metro/A&P/Super C/Loeb/Food Basics 5.2% 8.9<br />
3. Canadian Tire/PartSource/Mark’s Work Wearhouse 4.0% 11.8<br />
4. Zellers/The Bay/Home Outfitters 3.6% 8.9<br />
5. Wal-Mart 3.4% 9.5<br />
6. Winners/HomeSense 3.2% 5.4<br />
7. Loblaws/No Frills/Fortinos/Zehrs/Maxi 3.0% 5.8<br />
8. Staples/Business Depot 2.5% 7.9<br />
9. Reitmans/Penning<strong>to</strong>ns/Smart Set/Addition-Elle/Thyme Maternity 1.9% 4.9<br />
10. Harvey’s/Swiss Chalet/Kelsey’s/Montana’s/Miles<strong>to</strong>ne’s 1.8% 10.2<br />
Total 33.9%<br />
Lease Expiries<br />
Lease expiries (NLA)<br />
Retail Class Total NLA <strong>2009</strong> 2010 2011 2012 2013<br />
New Format Retail 15,446,739 265,246 910,767 1,442,301 1,031,823 1,308,754<br />
1.7% 5.9% 9.3% 6.7% 8.5%<br />
Grocery Anchored Centre 7,353,596 301,320 813,910 980,961 1,112,357 532,291<br />
4.1% 11.1% 13.3% 15.1% 7.2%<br />
Enclosed Shopping Centre 6,265,632 284,570 774,421 807,852 477,359 613,872<br />
4.5% 12.4% 12.9% 7.6% 9.8%<br />
Non-Grocery Anchored Centre 1,609,776 55,646 114,515 144,775 97,311 177,309<br />
3.5% 7.1% 9.0% 6.0% 11.0%<br />
Urban Retail 1,276,603 41,539 64,383 74,981 136,682 156,138<br />
3.3% 5.0% 5.9% 10.7% 12.2%<br />
Office 1,583,434 46,834 344,522 296,991 61,202 160,713<br />
3.0% 21.8% 18.8% 3.9% 10.1%<br />
Total 33,535,780 995,155 3,022,518 3,747,861 2,916,734 2,949,077<br />
3.0% 9.0% 11.2% 8.7% 8.8%<br />
Average net rent per square foot $14.32 $17.16 $14.26 $14.46 $15.89 $16.06<br />
RIOCAN REAL ESTATE INVESTMENT TRUST SECOND QUARTER REPORT <strong>2009</strong><br />
1