April 2008 Report - Central Bank of Trinidad and Tobago
April 2008 Report - Central Bank of Trinidad and Tobago
April 2008 Report - Central Bank of Trinidad and Tobago

You also want an ePaper? Increase the reach of your titles
YUMPU automatically turns print PDFs into web optimized ePapers that Google loves.
CENTRAL BANK OF TRINIDAD AND TOBAGO MONETARY POLICY REPORT APRIL <strong>2008</strong><br />
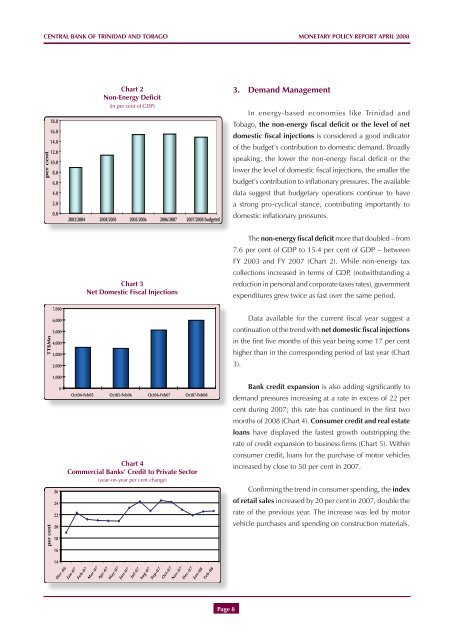
Chart 2<br />
Non-Energy Deficit<br />
(in per cent <strong>of</strong> GDP)<br />
3. Dem<strong>and</strong> Management<br />
In energy-based economies like <strong>Trinidad</strong> <strong>and</strong><br />
<strong>Tobago</strong>, the non-energy fiscal deficit or the level <strong>of</strong> net<br />
domestic fiscal injections is considered a good indicator<br />
<strong>of</strong> the budget’s contribution to domestic dem<strong>and</strong>. Broadly<br />
speaking, the lower the non-energy fiscal deficit or the<br />
lower the level <strong>of</strong> domestic fiscal injections, the smaller the<br />
budget’s contribution to inflationary pressures. The available<br />
data suggest that budgetary operations continue to have<br />
a strong pro-cyclical stance, contributing importantly to<br />
domestic inflationary pressures.<br />
Chart 3<br />
Net Domestic Fiscal Injections<br />
The non-energy fiscal deficit more that doubled – from<br />
7.6 per cent <strong>of</strong> GDP to 15.4 per cent <strong>of</strong> GDP – between<br />
FY 2003 <strong>and</strong> FY 2007 (Chart 2). While non-energy tax<br />
collections increased in terms <strong>of</strong> GDP, (notwithst<strong>and</strong>ing a<br />
reduction in personal <strong>and</strong> corporate taxes rates), government<br />
expenditures grew twice as fast over the same period.<br />
TT$Mn<br />
7,000<br />
6,000<br />
5,000<br />
4,000<br />
3,000<br />
2,000<br />
1,000<br />
0<br />
Oct04-Feb05 Oct05-Feb06 Oct06-Feb07 Oct07-Feb08<br />
Chart 4<br />
Commercial <strong>Bank</strong>s’ Credit to Private Sector<br />
(year-on-year per cent change)<br />
Data available for the current fiscal year suggest a<br />
continuation <strong>of</strong> the trend with net domestic fiscal injections<br />
in the first five months <strong>of</strong> this year being some 17 per cent<br />
higher than in the corresponding period <strong>of</strong> last year (Chart<br />
3).<br />
<strong>Bank</strong> credit expansion is also adding significantly to<br />
dem<strong>and</strong> pressures increasing at a rate in excess <strong>of</strong> 22 per<br />
cent during 2007; this rate has continued in the first two<br />
months <strong>of</strong> <strong>2008</strong> (Chart 4). Consumer credit <strong>and</strong> real estate<br />
loans have displayed the fastest growth outstripping the<br />
rate <strong>of</strong> credit expansion to business firms (Chart 5). Within<br />
consumer credit, loans for the purchase <strong>of</strong> motor vehicles<br />
increased by close to 50 per cent in 2007.<br />
Confirming the trend in consumer spending, the index<br />
<strong>of</strong> retail sales increased by 20 per cent in 2007, double the<br />
rate <strong>of</strong> the previous year. The increase was led by motor<br />
vehicle purchases <strong>and</strong> spending on construction materials.<br />
Page 8