April 2008 Report - Central Bank of Trinidad and Tobago
April 2008 Report - Central Bank of Trinidad and Tobago
April 2008 Report - Central Bank of Trinidad and Tobago

Create successful ePaper yourself
Turn your PDF publications into a flip-book with our unique Google optimized e-Paper software.
CENTRAL BANK OF TRINIDAD AND TOBAGO MONETARY POLICY REPORT APRIL <strong>2008</strong><br />
• The UN has estimated that food prices have increased by 73<br />
per cent since the beginning <strong>of</strong> 2007. The increase in food<br />
prices <strong>and</strong> looming food shortages have already provoked<br />
social unrest in many developing countries.<br />
• In 2007, the US dollar depreciated by 11 per cent against<br />
the Euro <strong>and</strong> 6 per cent against the Japanese Yen. The dollar<br />
depreciation has contributed to the rise in commodity prices<br />
which are now being used as hedging mechanisms.<br />
• Oil prices reached US$117 per barrel on <strong>April</strong> 19, <strong>2008</strong>,<br />
compared with US$62 per barrel at the beginning <strong>of</strong><br />
2007.<br />
Against this global background, the following section<br />
analyses the inflation performance in <strong>Trinidad</strong> <strong>and</strong> <strong>Tobago</strong>.<br />
2. Domestic Developments<br />
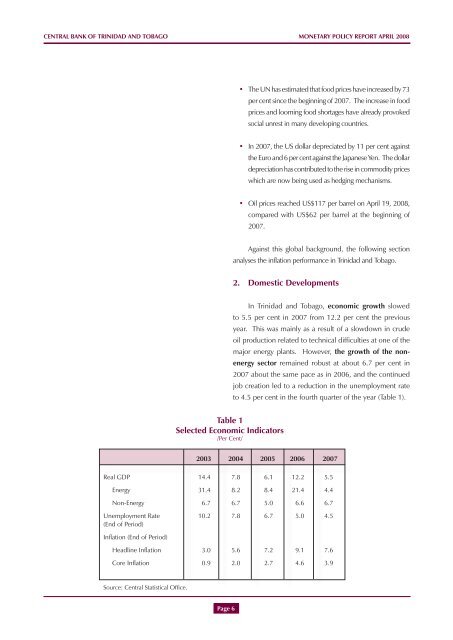
In <strong>Trinidad</strong> <strong>and</strong> <strong>Tobago</strong>, economic growth slowed<br />
to 5.5 per cent in 2007 from 12.2 per cent the previous<br />
year. This was mainly as a result <strong>of</strong> a slowdown in crude<br />
oil production related to technical difficulties at one <strong>of</strong> the<br />
major energy plants. However, the growth <strong>of</strong> the nonenergy<br />
sector remained robust at about 6.7 per cent in<br />
2007 about the same pace as in 2006, <strong>and</strong> the continued<br />
job creation led to a reduction in the unemployment rate<br />
to 4.5 per cent in the fourth quarter <strong>of</strong> the year (Table 1).<br />
Table 1<br />
Selected Economic Indicators<br />
/Per Cent/<br />
2003 2004 2005 2006 2007<br />
Real GDP 14.4 7.8 6.1 12.2 5.5<br />
Energy 31.4 8.2 8.4 21.4 4.4<br />
Non-Energy 6.7 6.7 5.0 6.6 6.7<br />
Unemployment Rate 10.2 7.8 6.7 5.0 4.5<br />
(End <strong>of</strong> Period)<br />
Inflation (End <strong>of</strong> Period)<br />
Headline Inflation 3.0 5.6 7.2 9.1 7.6<br />
Core Inflation 0.9 2.0 2.7 4.6 3.9<br />
Source: <strong>Central</strong> Statistical Office.<br />
Page 6