The cost index - Fokker
The cost index - Fokker
The cost index - Fokker

You also want an ePaper? Increase the reach of your titles
YUMPU automatically turns print PDFs into web optimized ePapers that Google loves.
<strong>The</strong> <strong>cost</strong> <strong>index</strong>
2<br />
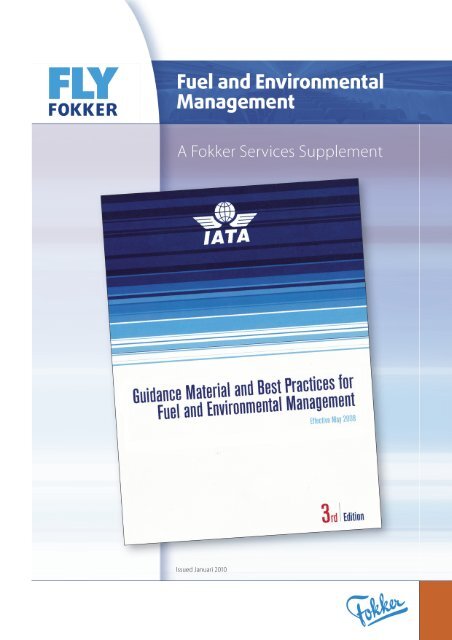
Fuel and Environmental Management
Fuel and Environmental Management<br />
Table of Contents<br />
1 FOREWORD....................................................................................................................................9<br />
2 FUEL MANAGEMENT CONCEPTS .............................................................................................11<br />
2.1 FUEL MANAGEMENT AND SAFETY....................................................................................11<br />
2.2 CHANGE MANAGEMENT AND AIRLINE CULTURE............................................................11<br />
2.3 FUEL MANAGEMENT AND THE ENVIRONMENT ...............................................................11<br />
2.3.1 <strong>The</strong> Environment .............................................................................................................11<br />
2.3.2 Emissions ........................................................................................................................11<br />
2.3.2.1 CO2 and H2O Emissions ..........................................................................................................11<br />
2.3.2.2 NOX and Other Emissions ........................................................................................................11<br />
2.3.3 Emission Calculations .....................................................................................................11<br />
2.3.3.1 Top-Down Approach: Estimates of CO2 and H2O ....................................................................11<br />
2.3.3.2 Calculation of NOx Emissions ...................................................................................................11<br />
2.3.3.3 Detailed Approach: Estimates of other Emissions.....................................................................11<br />
2.3.3.4 Sample Airline Pollution ............................................................................................................11<br />
2.4 ECONOMIC IMPACT OF EFFICIENT FUEL MANAGEMENT ..............................................11<br />
2.5 BASIC FACTS REGARDING FUEL CONSUMPTION...........................................................11<br />
2.6 THE IATA FUEL EFFICIENCY GAP ANALYSIS (FEGA) GREEN TEAMS...........................11<br />
2.7 AIRLINE BENCHMARKING ...................................................................................................11<br />
2.8 FUEL MANAGEMENT INFORMATION SYSTEM (FUEL MI)................................................11<br />
2.8.1 Monitoring the accuracy of the flight planning system ....................................................11<br />
2.8.2 Tracking of each aircraft fuel burn accurately .................................................................11<br />
2.8.3 Monitoring Fuel on Board (FOB) and fuel uplift...............................................................11<br />
2.8.4 Monitor the Fuel over Destination (FOD) ........................................................................11<br />
2.8.5 Monitor fuel performance of Flight Crews .......................................................................11<br />
2.8.6 Monitor the planning efficiency of Flight Dispatchers......................................................11<br />
2.8.7 Monitor Estimated Zero Fuel Weight (EZFW) and payload optimization........................11<br />
2.8.8 Develop efficient fuel saving procedures and monitor their effectiveness ......................11<br />
2.8.9 Monitor fuel <strong>cost</strong> for the various routes ...........................................................................11<br />
2.8.10 Taxi delays and gate hold including taxi fuel...................................................................12<br />
2.8.11 Sensitize Managers to Efficient Fuel Usage ...................................................................12<br />
2.9 HIGH COST OF FULL THRUST TAKEOFF...........................................................................12<br />
2.10 COST INDEX MANAGEMENT...............................................................................................12<br />
2.11 DYNAMIC COST INDEX ........................................................................................................12<br />
2.12 GENERIC AIRLINE ................................................................................................................12<br />
2.12.1 Generic Airline Fleet........................................................................................................12<br />
2.12.2 Cost of Weight.................................................................................................................12<br />
2.13 OVERVIEW OF POTENTIAL FUEL SAVINGS......................................................................12<br />
2.13.1 Air Traffic Control.............................................................................................................12<br />
2.13.2 Pilot Technique................................................................................................................12<br />
2.13.3 Cost Index Flying.............................................................................................................12<br />
3
Fuel and Environmental Management<br />
2.13.4 Accurate Flight Planning .................................................................................................12<br />
2.13.5 Using Statistics for Fuel Optimization .............................................................................12<br />
2.13.6 Alternate Selection ..........................................................................................................12<br />
2.13.7 No Alternate Airport- IFR Operations ..............................................................................12<br />
2.13.8 Contingency Fuel Calculation..........................................................................................12<br />
2.13.9 Aircraft Fuel Burn Management ......................................................................................12<br />
2.13.10 Tankering.........................................................................................................................12<br />
2.13.11 Zero Fuel Weight Management.......................................................................................12<br />
2.13.12 Center of Gravity Management .......................................................................................12<br />
2.13.13 Maintenance....................................................................................................................12<br />
2.13.14 Other Savings..................................................................................................................12<br />
2.13.15 Total Potential Savings....................................................................................................12<br />
2.14 GENERIC AIRLINE SUMMARY OF POTENTIAL SAVINGS ................................................12<br />
2.15 GENERIC AIRLINE EMISSION REDUCTION POTENTIAL ..................................................................12<br />
3 FLIGHT DISPATCH.......................................................................................................................12<br />
3.1 FLIGHT DISPATCHER - PILOT RELATIONSHIP .................................................................12<br />
3.2 FLIGHT PLANNING................................................................................................................12<br />
3.2.1 Flight planning considerations.........................................................................................12<br />
3.2.2 Route selection and planning..........................................................................................13<br />
3.3 PRINCIPLES OF COST INDEX FLIGHT ...............................................................................13<br />
3.3.1 Cost Index Calculation Methods......................................................................................13<br />
3.4 LIMITATIONS OF LEGACY FLIGHT PLANNING SYSTEMS................................................13<br />
3.5 FLIGHT PLANNING SYSTEM INVESTMENT .......................................................................13<br />
3.6 EFFICIENT FLIGHT PLANNING............................................................................................13<br />
3.7 COST INDEX OPTIMIZATION ...............................................................................................13<br />
3.7.1 Dynamic Cost Index Optimization ...................................................................................13<br />
3.7.2 Impact of non-Optimized Cost Index Operation ..............................................................13<br />
3.8 COST INDEX CALCULATIONS .............................................................................................13<br />
3.8.1 Time Dependent Maintenance Cost................................................................................13<br />
3.8.2 Crew Cost........................................................................................................................13<br />
3.8.3 Cost Index Calculations...................................................................................................13<br />
3.9 COST INDEX FLIGHT............................................................................................................13<br />
3.10 MISSION MANAGEMENT......................................................................................................13<br />
3.10.1 <strong>The</strong> schedule...................................................................................................................13<br />
3.10.2 On-Time performance .....................................................................................................14<br />
3.10.3 Managing the mission .....................................................................................................14<br />
3.11 FLIGHT SCHEDULE IMPACT ON FUEL EFFICIENCY ........................................................14<br />
3.12 FLIGHT WATCH.....................................................................................................................15<br />
3.13 FUEL MANAGEMENT INFORMATION .................................................................................15<br />
3.14 CONTINGENCY FUEL...........................................................................................................15<br />
3.14.1 FAR Part 121 Regulations Domestic Operations............................................................15<br />
3.14.2 FAR Part 121 Regulations International Operations.......................................................15<br />
3.14.2.1 Operations Specification Amendments .....................................................................................15<br />
3.14.3 Contingency Fuel JAR-OPS............................................................................................15<br />
4
Fuel and Environmental Management<br />
3.15 STATISTICAL EXTRA (COMPANY) FUEL............................................................................15<br />
3.16 ALTERNATE SELECTION .....................................................................................................15<br />
3.17 NO ALTERNATE OPERATIONS – IFR..................................................................................15<br />
3.17.1 Federal Air Regulations (FAR) No Alternate Operations ................................................15<br />
3.17.1.1 Part 121.619 Alternate Airport for destination IFR Domestic Operations ..................................15<br />
3.17.1.2 Part 121.619 Alternate Airport for destination IFR Domestic Operations ..................................15<br />
3.17.1.3 JAR-OPS 1.295 Selection of Aerodromes.................................................................................15<br />
3.18 RE-DISPATCH OPERATIONS...............................................................................................15<br />
3.18.1 Re-Dispatch under FAA FAR Regulations ......................................................................15<br />
3.18.2 JAR-OPS 1.255 Reduced Contingency Fuel Option.......................................................15<br />
3.19 FUEL BIAS - FLIGHT PLANNING SYSTEM..........................................................................15<br />
3.20 FUELTANKERING..................................................................................................................15<br />
3.21 LOAD PLANNING...................................................................................................................15<br />
3.21.1 Center of Gravity Management .......................................................................................15<br />
3.21.2 ZFW Planning Variance ..................................................................................................18<br />
4 FLIGHT OPERATIONS .................................................................................................................18<br />
4.1 PRE-DEPARTURE PLANNING .............................................................................................18<br />
4.1.1 Complexity of Flight Planning..........................................................................................19<br />
4.1.2 Flight Plan Format ...........................................................................................................19<br />
4.1.3 Graphics and Internet accessibility .................................................................................19<br />
4.1.4 Communications at Airports ............................................................................................19<br />
4.1.5 In-Flight Communications................................................................................................19<br />
4.1.6 Conclusion.......................................................................................................................19<br />
4.2 FLIGHT CREW AND TACTICAL MISSION MANAGEMENT.................................................19<br />
4.3 STATISTICAL DISCRETIONARY FUELS..............................................................................19<br />
4.4 FLIGHT MANAGEMENT SYSTEM PROGRAMMING...........................................................19<br />
4.5 AUXILIARY POWER UNIT MANAGEMENT..........................................................................19<br />
4.5.1 Single Pack APU Air Conditioning Optimized Operation ................................................19<br />
4.6 ENGINE START-UP AND TAXI .............................................................................................19<br />
4.6.1 Taxi speeds .....................................................................................................................19<br />
4.6.2 Choice of Departure Runway vs. Taxi times...................................................................19<br />
4.7 REDUCED THRUST TAKEOFF.............................................................................................20<br />
4.8 REDUCED TAKEOFF FLAPS................................................................................................20<br />
4.9 INITIAL CLIMB OUT PROFILE MANAGEMENT ...................................................................20<br />
4.9.1 Climb-out Considerations ................................................................................................20<br />
4.10 LATERAL TRACK MANAGEMENT........................................................................................20<br />
4.11 VERTICAL PROFILE MANAGEMENT IN CRUISE ...............................................................20<br />
4.12 CRUISE SPEED MANAGEMENT ..........................................................................................20<br />
4.13 FMS DESCENT PROFILE MANAGEMENT...........................................................................20<br />
4.14 FMS DESCENT PROFILE .....................................................................................................20<br />
4.14.1 Energy Management and Trade off ................................................................................20<br />
4.14.2 Distance, speed and altitude trade off.............................................................................20<br />
4.14.3 Descent Profile Wind Corrections ...................................................................................21<br />
5
Fuel and Environmental Management<br />
4.14.4 Landing Weight................................................................................................................21<br />
4.14.5 Engine Anti-Ice ................................................................................................................21<br />
4.14.6 ATC Restrictions..............................................................................................................21<br />
4.14.7 Penalties for Early/Late Descent.....................................................................................21<br />
4.15 PILOT TECHNIQUE AND FUEL EFFICIENCY...................................................................................21<br />
4.16 DESCENT PROFILE MANAGEMENT FOR NON-FMS AIRCRAFT .....................................21<br />
4.17 BASIC PRINCIPLES OF THE DECELERATED APPROACH ...............................................21<br />
4.17.1 FMS Arrivals....................................................................................................................21<br />
4.17.2 Decelerated Approaches (Low Noise Low Drag)............................................................21<br />
4.17.3 High Head Winds on Final will result in long final legs....................................................21<br />
4.18 REDUCED FLAP LANDING...................................................................................................21<br />
4.19 IDLE ENGINE REVERSE ON LANDING ...............................................................................22<br />
4.20 ENGINE-OUT TAXI-IN ...........................................................................................................22<br />
5 AIR TRAFFIC CONTROL..............................................................................................................22<br />
5.1 OVERVIEW ............................................................................................................................22<br />
5.1.1 Fuel is burned to carry fuel..............................................................................................22<br />
5.1.2 Strategic management ....................................................................................................22<br />
5.1.3 Possible Environment and Fuel Champion Accountabilities...........................................22<br />
5.2 AT THE GATE ........................................................................................................................22<br />
5.3 TAXIING AND DEPARTURE .................................................................................................22<br />
5.4 CLIMB.....................................................................................................................................22<br />
5.5 CRUISE ..................................................................................................................................22<br />
5.6 SPEED CONTROL AND HEADING VECTORING ................................................................22<br />
5.7 DIRECT ROUTING.................................................................................................................22<br />
5.8 DESCENT...............................................................................................................................22<br />
5.9 HOLDING ...............................................................................................................................22<br />
5.10 APPROACH AND LANDING..................................................................................................23<br />
5.11 WHAT CAN AIR NAVIGATION SERVICE PROVIDERS DO...............................................23<br />
5.12 WHAT CAN AIR TRAFFIC CONTROLLERS DO.................................................................23<br />
6 MAINTENANCE AND ENGINEERING (M&E)..............................................................................23<br />
6.1 GENERAL...............................................................................................................................23<br />
6.2 FUEL PENALTY CALCULATION...........................................................................................23<br />
6.3 AIRCRAFT WEIGHTS............................................................................................................23<br />
6.3.1 Weight & Balance - ATA 8...............................................................................................24<br />
6.3.2 Fly Away Kits or Flight Spares ........................................................................................24<br />
6.3.3 Aircraft Refueling - ATA 28..............................................................................................24<br />
6.4 AERODYNAMIC DETERIORATION ......................................................................................24<br />
6.4.1 Effect of drag on fuel consumption..................................................................................24<br />
6.4.2 Aerodynamic critical areas ..............................................................................................25<br />
6.5 AIRCRAFT PERFORMANCE MONITORING (APM).............................................................27<br />
6.6 ENGINES................................................................................................................................27<br />
6.6.1 Engine Water Wash ........................................................................................................27<br />
6
Fuel and Environmental Management<br />
6.6.2 Engine Build Standards...................................................................................................28<br />
6.6.2.1 Refurbishment of Engines for Fuel Efficiency............................................................................28<br />
6.6.3 Engine on wing monitoring ..............................................................................................28<br />
6.6.4 Engine handling while aircraft is in maintenance ............................................................28<br />
6.6.5 Recommendations ..........................................................................................................28<br />
6.7 APU.........................................................................................................................................28<br />
6.7.1 Ground Support Equipment (GSE) .................................................................................28<br />
6.7.2 Recommendations ..........................................................................................................28<br />
6.8 AIRFRAME SYSTEMS...........................................................................................................28<br />
6.8.1 Environmental Control System - ATA 21 ........................................................................28<br />
6.8.2 Flight Controls - ATA 27 ..................................................................................................28<br />
6.8.3 Fuel System (Airframe) - ATA 28 ....................................................................................28<br />
6.8.4 Instruments - ATA 31 ......................................................................................................28<br />
6.8.5 Pneumatic System - ATA 36 ...........................................................................................28<br />
6.8.6 Structure and Doors - ATA 51-57....................................................................................28<br />
6.8.6.1 Skin roughness..........................................................................................................................29<br />
6.8.6.2 Gaps and Mismatches...............................................................................................................33<br />
6.8.6.3 Missing or damaged seals (leakage)........................................................................................36<br />
6.8.6.4 Mis-rigging and mis-alignment...................................................................................................39<br />
6.8.6.5 MMEL items and Configuration Deviations ...............................................................................39<br />
6.8.7 Recommendations ..........................................................................................................40<br />
6.9 MAINTENANCE PLANNING ..................................................................................................40<br />
6.10 MAINTENANCE TRAINING ...................................................................................................40<br />
6.10.1 Recommendations ..........................................................................................................40<br />
6.11 FUEL CONSERVATION DOCUMENTATION........................................................................40<br />
7 MARKETING AND SALES ...........................................................................................................40<br />
7.1 GENERAL..................................................................................................................................40<br />
7.1.1 Cost of Weight.................................................................................................................40<br />
7.1.1.1 Recommendations ....................................................................................................................40<br />
7.1.2 Cabin Furnishings and Emergency Equipment - ATA 25 ...............................................40<br />
7.1.2.1 Recommendations ....................................................................................................................40<br />
7.1.3 Potable Water - ATA 38 ..................................................................................................40<br />
7.1.3.1 Recommendations ....................................................................................................................40<br />
7.1.4 Aircraft Utilization / Timetable..........................................................................................40<br />
7.1.4.1 Recommendations ....................................................................................................................40<br />
8 IATA FUEL SERVICES: FUEL STANDARDS & QUALITY.........................................................41<br />
8.1 COLLABORATION FOR REAL RESULTS ............................................................................41<br />
8.2 OBJECTIVES OF THE IATA TECHNICAL FUEL GROUP (TFG) .........................................41<br />
8.3 IATA FUEL QUALITY POOL (IFQP) ......................................................................................41<br />
8.4 IMPROVING SAFETY AND QUALITY CONTROL ................................................................41<br />
8.5 COMMON OBJECTIVES .......................................................................................................41<br />
9 GLOSSARY...................................................................................................................................41<br />
7
Fuel and Environmental Management<br />
A. THE COST INDEX EXPLAINED .....................................................................................................1<br />
A.1 MINIMIZING THE COST PER FLIGHT................................................................................................2<br />
A.2 COST INDEX AND ITS USE BY FMS................................................................................................4<br />
A.3 SAMPLE CALCULATION OF THE COST INDEX..................................................................................6<br />
8
Fuel and Environmental Management<br />
1 FOREWORD<br />
As fuel <strong>cost</strong>s are a significant part of the operating <strong>cost</strong> of an aircraft, and with the dramatic rise of<br />
fuel prices over the past decennia, more and more emphasis is being put on fuel conservation by<br />
airlines.<br />
With the upcoming introduction of the European Emission Trading Scheme (ETS), aimed at reducing<br />
the emission of greenhouse gasses, fuel conservation becomes even more important as there is a<br />
direct relation between CO 2 emission and fuel burn.<br />
It is not surprising therefore that many airframe manufacturers, airlines and aviation related<br />
organizations have published many articles, manuals, presentations, etc on the subject of fuel<br />
conservation.<br />
<strong>Fokker</strong> Services shares this intention, however without reinventing the wheel. <strong>The</strong>re are so many<br />
generic methods to save fuel, independent of aircraft type, that have been described and explained<br />
by others, that there is no reason to add more of the same.<br />
<strong>Fokker</strong> Services considers the IATA "Guidance Material and Best Practices for Fuel and<br />
Environmental Management" (also known as the IATA Fuelbook) as one of the global standards on<br />
this subject.<br />
It is a manual that is regularly updated (the 4 th Edition has just been issued) and it is written especially<br />
for aircraft operators, which is the audience <strong>Fokker</strong> Services is focused on as well.<br />
Furthermore, this manual is being used as a reference by the IATA Green Teams - experts that<br />
consult with airlines to implement recognized fuel conservation techniques. <strong>The</strong> experience gained<br />
during these campaigns will be used to improve the manual on a regular basis.<br />
This manual already contains many recommendations that are applicable to all types of aircraft,<br />
including the <strong>Fokker</strong> aircraft. Many of these recommendations will require some kind of effort to<br />
implement in the day-to-day operation or maintenance activities of an aircraft operator. It is therefore<br />
essential to know what the quantitative effect of the implementation of such measures is in terms of<br />
fuel conservation. In this way an aircraft operator can make the proper trade off between the<br />
implementation <strong>cost</strong> and the result in terms of fuel conservation.<br />
Considering the above, <strong>Fokker</strong> Services has come to the conclusion that it would be worthwhile for<br />
<strong>Fokker</strong> aircraft operators, to have a supplement to the IATA Fuelbook, that specifies the particular<br />
characteristics of the <strong>Fokker</strong> aircraft with respect to fuel conservation measures.<br />
Also additional remarks or different points of view will be provided in this supplement where relevant.<br />
This supplement has been written for flight planning, maintenance and operations personnel of<br />
<strong>Fokker</strong> aircraft operators. It has the same layout as the IATA Fuelbook for easy reference. <strong>The</strong><br />
contents page of this Supplement is identical to the IATA Fuelbook, apart from the page numbering.<br />
9
Fuel and Environmental Management<br />
Each paragraph is adopted in the body also, even if it does not contain additional information. This<br />
has been done in anticipation of future updates. <strong>The</strong>se empty paragraphs have been shaded grey in<br />
this document.<br />
This Supplement to the IATA Fuelbook will be updated regularly when new experience or knowledge<br />
is gained. Research is going on all over the world by many organizations to reduce fuel consumption.<br />
In addition, regulatory changes that affect fuel consumption may become effective in the near future.<br />
<strong>Fokker</strong> Services has the intention to gather the results of these developments and to present it in this<br />
publication through these updates.<br />
<strong>The</strong>refore, any suggestions or comments regarding this publication are more than welcome.<br />
Please contact us via www.myfokkerfleet.com : “Knowledge - Q&A database – Post new Question”<br />
on and select “Question Type“ : Technical/ Operational”<br />
<strong>Fokker</strong> Services is confident that this document will contribute to the continuous and competitive<br />
operation of your <strong>Fokker</strong> aircraft.<br />
Disclaimer:<br />
In case of any discrepancy between this article and a <strong>Fokker</strong> Services issued document such<br />
as Airplane Flight Manual, Airplane Operating Manual, Aircraft Maintenance Manual, Service<br />
Letter, All Operators Message, etc, the latter group of documents are leading.<br />
10
Fuel and Environmental Management<br />
2 FUEL MANAGEMENT CONCEPTS<br />
2.1 FUEL MANAGEMENT AND SAFETY<br />
2.2 CHANGE MANAGEMENT AND AIRLINE CULTURE<br />
2.3 FUEL MANAGEMENT AND THE ENVIRONMENT<br />
2.3.1 <strong>The</strong> Environment<br />
2.3.2 Emissions<br />
2.3.2.1 CO2 and H2O Emissions<br />
2.3.2.2 NOX and Other Emissions<br />
Links to the individual Engine Exhaust Emissions Data Sheets for the engines of the <strong>Fokker</strong> 70 and<br />
<strong>Fokker</strong> 100 are given below. For the <strong>Fokker</strong> 50, no datasheets are available as turboprop engines are<br />
not included in the database.<br />
<strong>Fokker</strong> 70 and <strong>Fokker</strong> 100 with TAY 620 engines :<br />
http://www.caa.co.uk/docs/702/1RR020_01102004.pdf<br />
<strong>Fokker</strong> 100 with TAY 650 engines :<br />
http://www.caa.co.uk/docs/702/1RR021_01102004.pdf<br />
2.3.3 Emission Calculations<br />
2.3.3.1 Top-Down Approach: Estimates of CO2 and H2O<br />
2.3.3.2 Calculation of NOx Emissions<br />
2.3.3.3 Detailed Approach: Estimates of other Emissions<br />
2.3.3.4 Sample Airline Pollution<br />
2.4 ECONOMIC IMPACT OF EFFICIENT FUEL MANAGEMENT<br />
2.5 BASIC FACTS REGARDING FUEL CONSUMPTION<br />
2.6 THE IATA FUEL EFFICIENCY GAP ANALYSIS (FEGA) GREEN TEAMS<br />
2.7 AIRLINE BENCHMARKING<br />
2.8 FUEL MANAGEMENT INFORMATION SYSTEM (FUEL MI)<br />
2.8.1 Monitoring the accuracy of the flight planning system<br />
2.8.2 Tracking of each aircraft fuel burn accurately<br />
2.8.3 Monitoring Fuel on Board (FOB) and fuel uplift<br />
2.8.4 Monitor the Fuel over Destination (FOD)<br />
2.8.5 Monitor fuel performance of Flight Crews<br />
2.8.6 Monitor the planning efficiency of Flight Dispatchers<br />
2.8.7 Monitor Estimated Zero Fuel Weight (EZFW) and payload optimization<br />
2.8.8 Develop efficient fuel saving procedures and monitor their effectiveness<br />
2.8.9 Monitor fuel <strong>cost</strong> for the various routes<br />
11
Fuel and Environmental Management<br />
2.8.10 Taxi delays and gate hold including taxi fuel<br />
2.8.11 Sensitize Managers to Efficient Fuel Usage<br />
2.9 HIGH COST OF FULL THRUST TAKEOFF<br />
2.10 COST INDEX MANAGEMENT<br />
2.11 DYNAMIC COST INDEX<br />
2.12 GENERIC AIRLINE<br />
2.12.1 Generic Airline Fleet<br />
2.12.2 Cost of Weight<br />
2.13 OVERVIEW OF POTENTIAL FUEL SAVINGS<br />
2.13.1 Air Traffic Control<br />
2.13.2 Pilot Technique<br />
2.13.3 Cost Index Flying<br />
2.13.4 Accurate Flight Planning<br />
2.13.5 Using Statistics for Fuel Optimization<br />
2.13.6 Alternate Selection<br />
2.13.7 No Alternate Airport- IFR Operations<br />
2.13.8 Contingency Fuel Calculation<br />
2.13.9 Aircraft Fuel Burn Management<br />
2.13.10 Tankering<br />
2.13.11 Zero Fuel Weight Management<br />
2.13.12 Center of Gravity Management<br />
2.13.13 Maintenance<br />
2.13.14 Other Savings<br />
2.13.15 Total Potential Savings<br />
2.14 GENERIC AIRLINE SUMMARY OF POTENTIAL SAVINGS<br />
2.15 GENERIC AIRLINE EMISSION REDUCTION POTENTIAL<br />
3 FLIGHT DISPATCH<br />
3.1 FLIGHT DISPATCHER - PILOT RELATIONSHIP<br />
3.2 FLIGHT PLANNING<br />
3.2.1 Flight planning considerations<br />
For flight planning, performance data is used that is normally provided by the aircraft manufacturer.<br />
With this performance data, block fuel and block time for a given flight can be calculated. <strong>The</strong>se<br />
important parameters depend on the climb, cruise and descent speeds, the cruise altitude for a given<br />
route, ambient conditions, and take-off weight.<br />
<strong>The</strong> trip <strong>cost</strong> of an airplane can be broadly divided into the following elements:<br />
- fixed <strong>cost</strong>s (typically <strong>cost</strong> of ownership, landing/nav charges and ground handling)<br />
- time-related <strong>cost</strong> (typically maintenance <strong>cost</strong>s, crew <strong>cost</strong>s)<br />
- fuel-related <strong>cost</strong><br />
12
Fuel and Environmental Management<br />
Flight planning can be used to find the optimum balance between the time and fuel-related <strong>cost</strong><br />
elements to minimize the trip <strong>cost</strong>. This is done by optimizing the cruise altitude and the climb, cruise<br />
and descent speeds. This optimization shall be done for the actual wind speeds per flight level as this<br />
parameter plays an important role in the determination of the optimum vertical flight profile.<br />
<strong>The</strong> Cost Index is the parameter that is often used to correlate time and fuel-related <strong>cost</strong>. A detailed<br />
explanation of it is given in Appendix A.<br />
3.2.2 Route selection and planning<br />
3.3 PRINCIPLES OF COST INDEX FLIGHT<br />
3.3.1 Cost Index Calculation Methods<br />
<strong>Fokker</strong> 70 and <strong>Fokker</strong> 100 aircraft are equipped with a Flight Management System (FMS) for efficient<br />
pre-flight and en-route flight planning. <strong>The</strong> latter is often required as either the en-route weather<br />
conditions (temperature, wind speeds, etc) deviate from the forecasted values or ATC directs the<br />
airplane to other flight levels. With the FMS it is possible for the crew to recalculate in-flight the<br />
optimum vertical profile for three different options; MINIMUM TIME, MINIMUM FUEL and ECONOMY<br />
(balanced fuel and time related <strong>cost</strong>). For the latter the Cost Index (CI) parameter is used as an input.<br />
A detailed explanation of the Cost Index is given in Appendix A.<br />
3.4 LIMITATIONS OF LEGACY FLIGHT PLANNING SYSTEMS<br />
3.5 FLIGHT PLANNING SYSTEM INVESTMENT<br />
3.6 EFFICIENT FLIGHT PLANNING<br />
<strong>The</strong> optional <strong>Fokker</strong> 50 FMS (or better Navigation Management System) does not provide en-route<br />
vertical profile calculations and fuel predictions. However, guidelines can be prepared in the form of<br />
tables or graphs for in-flight adjustments by the crew. Also, Electronic Flight Bags can be used to run<br />
software that determines the optimum profile and speeds. <strong>Fokker</strong> Services is cooperating with PACE<br />
GmbH in Germany to develop such software. More information can be found on www.pace.de under<br />
“product Highlights” “CI OPS”.<br />
3.7 COST INDEX OPTIMIZATION<br />
3.7.1 Dynamic Cost Index Optimization<br />
3.7.2 Impact of non-Optimized Cost Index Operation<br />
3.8 COST INDEX CALCULATIONS<br />
3.8.1 Time Dependent Maintenance Cost<br />
3.8.2 Crew Cost<br />
3.8.3 Cost Index Calculations<br />
3.9 COST INDEX FLIGHT<br />
3.10 MISSION MANAGEMENT<br />
3.10.1 <strong>The</strong> schedule<br />
13
Fuel and Environmental Management<br />
3.10.2 On-Time performance<br />
3.10.3 Managing the mission<br />
3.11 FLIGHT SCHEDULE IMPACT ON FUEL EFFICIENCY<br />
Cruise altitude and cruise speed play an important role in both block time and block fuel.<br />
By variation of the cruise altitude and speed schedule in flight planning software, the effects of these<br />
parameters become clear.<br />
Sophisticated flight planning software has the option to optimize these parameters as a function of the<br />
Cost Index.<br />
In the next table examples are given of the effect of flying at a flight level that is 4000 ft below the<br />
maximum operating altitude.<br />
Aircraft type<br />
Speed<br />
Schedule<br />
Distance<br />
[NM]<br />
Increment in<br />
block fuel<br />
[kg]<br />
Increment in<br />
block time<br />
[min]<br />
<strong>Fokker</strong> 50 LRC 250 14 1.0<br />
Max Cruise 250 36 -2.5<br />
<strong>Fokker</strong> 70 LRC 400 33 1.0<br />
Max Cruise 400 74 -1.0<br />
<strong>Fokker</strong> 100 LRC 400 35 2.0<br />
Max Cruise 400 68 0.0<br />
Table 3.11-1 Effect on block fuel and block time when flying 4000 ft below max. operating altitude<br />
In the table below samples are given to show the effect of flying with max cruise speed instead of<br />
long-range cruise (LRC) speed.<br />
Aircraft type<br />
Cruise<br />
Flight<br />
Level<br />
Distance<br />
[NM]<br />
Increment in<br />
block fuel<br />
[kg]<br />
Decrement in<br />
block time<br />
[min]<br />
<strong>Fokker</strong> 50 250 250 16 4.9<br />
210 250 38 8.4<br />
<strong>Fokker</strong> 70 350 400 166 5.0<br />
310 400 207 7.0<br />
<strong>Fokker</strong> 100 350 400 132 4.0<br />
310 400 165 6.0<br />
Table 3.11-2 Effect on block fuel and block time when flying at max cruise instead of long-range<br />
cruise<br />
14
Fuel and Environmental Management<br />
3.12 FLIGHT WATCH<br />
3.13 FUEL MANAGEMENT INFORMATION<br />
3.14 CONTINGENCY FUEL<br />
3.14.1 FAR Part 121 Regulations Domestic Operations<br />
3.14.2 FAR Part 121 Regulations International Operations<br />
3.14.2.1 Operations Specification Amendments<br />
3.14.3 Contingency Fuel JAR-OPS<br />
3.15 STATISTICAL EXTRA (COMPANY) FUEL<br />
In addition to the text in the IATA Fuelbook, it is emphasized that there is an interaction between the<br />
surplus of statistical and discretionary fuel and the fuel tankering policy. If it is beneficial to carry<br />
additional fuel because of economic reasons (i.e. the fuel prices at the point of departure are<br />
favorable), then there is no need for a painstaking process to determine accurate quantities of<br />
statistical and discretionary fuel. On the other hand, if the flight is to an airfield with lower fuel prices,<br />
carrying not more than the required fuel becomes even more important. In this case a surplus of fuel<br />
not only causes additional fuel consumption due to the higher aircraft weight, but also less cheap fuel<br />
can be tankered at the destination, i.e. after landing you are stuck with the expensive fuel on board<br />
the airplane!<br />
3.16 ALTERNATE SELECTION<br />
3.17 NO ALTERNATE OPERATIONS – IFR<br />
3.17.1 Federal Air Regulations (FAR) No Alternate Operations<br />
3.17.1.1 Part 121.619 Alternate Airport for destination IFR Domestic Operations<br />
3.17.1.2 Part 121.619 Alternate Airport for destination IFR Domestic Operations<br />
3.17.1.3 JAR-OPS 1.295 Selection of Aerodromes<br />
3.18 RE-DISPATCH OPERATIONS<br />
3.18.1 Re-Dispatch under FAA FAR Regulations<br />
3.18.2 JAR-OPS 1.255 Reduced Contingency Fuel Option<br />
3.19 FUEL BIAS - FLIGHT PLANNING SYSTEM<br />
3.20 FUEL TANKERING<br />
<strong>The</strong> effect of the weight of the additional fuel carried, is equivalent to that of an increase of the<br />
Operational Weight which is shown in paragraph 6.3<br />
3.21 LOAD PLANNING<br />
3.21.1 Center of Gravity Management<br />
<strong>The</strong> longitudinal position of the center of gravity (CG) affects the aerodynamic drag of the aircraft.<br />
However, the conventional wisdom of a forward CG position resulting in a higher negative tail load<br />
15
Fuel and Environmental Management<br />
and thus more drag is not always true. For the <strong>Fokker</strong> 70 and <strong>Fokker</strong> 100 an aft CG position indeed<br />
improves fuel economy as shown in the graphs below. <strong>The</strong>se graphs show the fuel saving during<br />
cruise when the CG position is shifted aft by 10%. <strong>The</strong>se values are applicable over the entire CG<br />
range.<br />
It also shows that the fuel savings become more significant at high lift coefficients, i.e. high weight,<br />
low speed and at the highest flight levels.<br />
<strong>Fokker</strong> 100<br />
Fuel Saving in percentage per 10% aft CG shift<br />
1.6<br />
1.4<br />
1.42<br />
Ma.65<br />
Ma.70<br />
1.2<br />
Ma.75<br />
1.0<br />
0.8<br />
0.6<br />
1.00<br />
0.68<br />
0.62<br />
1.00<br />
0.81<br />
0.4<br />
0.2<br />
0.0<br />
-0.2<br />
0.35<br />
0.24 0.22<br />
0.21<br />
0.00<br />
0.00<br />
W=36000kg/FL350 W=36000kg/FL250 W=40000kg/FL350 W=40000kg/FL250<br />
Figure 3-1 Fuel Savings for aft CG shift, <strong>Fokker</strong> 100<br />
16
Fuel and Environmental Management<br />
<strong>Fokker</strong> 70<br />
Fuel Saving in percentage per 10% aft CG shift<br />
1.4<br />
1.2<br />
1.15<br />
Ma.65<br />
Ma.70<br />
1.0<br />
0.8<br />
0.90<br />
0.82<br />
0.92<br />
0.84<br />
Ma.75<br />
0.6<br />
0.59<br />
0.4<br />
0.2<br />
0.28<br />
0.25<br />
0.22<br />
0.27<br />
0.12<br />
0.32<br />
0.0<br />
-0.2<br />
W=33500kg/FL350 W=33500kg/FL250 W=36500kg/FL350 W=36500kg/FL250<br />
Figure 3-2 Fuel Savings for aft CG shift, <strong>Fokker</strong> 70<br />
17
Fuel and Environmental Management<br />
For the <strong>Fokker</strong> 50 however, a forward CG position gives the best fuel economy, which is illustrated in<br />
the graph below where additional fuel burn results from an aft CG shift. This contradictory effect is<br />
caused by the complicated aerodynamic interaction of the propeller wash on the tail plane and the<br />
position of the engines.<br />
<strong>Fokker</strong> 50<br />
Fuel Saving in percentage per 10% aft CG shift<br />
0.0<br />
W=17000kg/FL250 W=20000kg/FL250 W=17000kg/FL200 W=20000kg/FL200<br />
-0.1<br />
-0.2<br />
-0.3<br />
-0.21<br />
-0.4<br />
-0.33<br />
-0.33<br />
-0.33<br />
-0.5<br />
-0.6<br />
-0.7<br />
-0.50<br />
-0.45<br />
-0.47<br />
-0.55<br />
-0.45<br />
150kEAS<br />
175 kEAS<br />
200 kEAS<br />
-0.55<br />
-0.47<br />
-0.68<br />
-0.8<br />
Figure 3-3 Fuel Savings for aft CG shift, <strong>Fokker</strong> 50<br />
Apart from its longitudinal position, the CG lateral position may also be shifted from the centerline due<br />
to fuel asymmetry and, to a lesser extent, due to asymmetrical passenger seating or cabin<br />
arrangement. This results in aileron and rudder deflection throughout the flight.<br />
Although the effect of lateral CG shifts on fuel consumption is very low, it is advised to strive for<br />
symmetrical fuel distribution.<br />
3.21.2 ZFW Planning Variance<br />
4 FLIGHT OPERATIONS<br />
4.1 PRE-DEPARTURE PLANNING<br />
18
Fuel and Environmental Management<br />
4.1.1 Complexity of Flight Planning<br />
4.1.2 Flight Plan Format<br />
4.1.3 Graphics and Internet accessibility<br />
4.1.4 Communications at Airports<br />
4.1.5 In-Flight Communications<br />
4.1.6 Conclusion<br />
4.2 FLIGHT CREW AND TACTICAL MISSION MANAGEMENT<br />
4.3 STATISTICAL DISCRETIONARY FUELS<br />
4.4 FLIGHT MANAGEMENT SYSTEM PROGRAMMING<br />
4.5 AUXILIARY POWER UNIT MANAGEMENT<br />
4.5.1 Single Pack APU Air Conditioning Optimized Operation<br />
4.6 ENGINE START-UP AND TAXI<br />
<strong>The</strong> <strong>Fokker</strong> 70 and <strong>Fokker</strong> 100, Airplane Operating Manuals (AOM) give procedures for Single<br />
Engine Taxiing (AOM 5.14.02 “Delayed Engine Start”). Keep in mind that the engine should be given<br />
sufficient time to warm-up before the take-off is initiated. (ref. AOM 70/100 5.14.01 “Engine Warm-<br />
Up”). If these warm-up times are not adhered to, increased engine wear, including a degradation of<br />
fuel efficiency, will be the result.<br />
Fuel is saved as it is more efficient to produce a certain amount of thrust with only one engine rather<br />
than two engines. In addition, at low take-off weights, idle thrust on two engines often exceeds the<br />
required thrust for taxiing. Single engine taxiing is therefore also beneficial with respect to brake life.<br />
On average, 25 kg of fuel can be saved when taxiing for 10 minutes with one engine instead of two<br />
engines.<br />
<strong>The</strong>re is always a slight risk that difficulties arise during engine start, which is very annoying and time<br />
consuming if this happens just before the take-off when the aircraft is already lined up to enter the<br />
runway.<br />
Under ground icing conditions, delayed engine start is not recommended due to the unavailability of<br />
engine anti-icing on the inlet of the inoperative engine and also because ice can build up on the fan<br />
blades causing engine vibrations at engine start.<br />
For the <strong>Fokker</strong> 50 Single Engine Taxi is not recommended due to the higher asymmetry and because<br />
the idle thrust does not exceed the required thrust for taxiing.<br />
4.6.1 Taxi speeds<br />
4.6.2 Choice of Departure Runway vs. Taxi times<br />
19
Fuel and Environmental Management<br />
4.7 REDUCED THRUST TAKEOFF<br />
For the <strong>Fokker</strong> 50, the use of reduced take-off thrust has hardly any effect on engine life. This is<br />
because the day-to-day take-off power (all-engines-operating) is already 10% below the rated take-off<br />
power. Only after an engine failure in take-off, the power is increased to Maximum Take-Off rating.<br />
In addition, block fuel will increase as a greater part of the flight is executed at low altitude.<br />
For the <strong>Fokker</strong> 70 and <strong>Fokker</strong> 100, the recommendations of the main IATA document are applicable.<br />
4.8 REDUCED TAKEOFF FLAPS<br />
<strong>The</strong> use of lower flap settings results in improved climb performance, but also in higher take-off<br />
speeds and longer take-off distances.<br />
<strong>The</strong>refore, the preferred flap setting for a take-off, based on flight safety depends on the criticality of<br />
available take-off distances and/or required climb performance due to obstacles. A higher flap setting<br />
may therefore be preferred to increase the safety margin on the take-off distance at the <strong>cost</strong> of some<br />
additional fuel.<br />
4.9 INITIAL CLIMB OUT PROFILE MANAGEMENT<br />
When taking off away from the intended course, it may sometimes be beneficial to select a low flap<br />
setting, even though this results in higher initial climb-out speeds. If the turn is to be initiated at a<br />
certain height, this point is reached earlier and closer to the brake release point than with higher flap<br />
settings as lower flap settings result in the best climb gradients.<br />
<strong>The</strong> <strong>Fokker</strong> 70 and <strong>Fokker</strong> 100 have extendable landing lights that normally are left out up to 10,000<br />
ft. Depending on company policy, operational requirements and weather conditions, this may be<br />
reduced to a lower flight level. Retracting the landing lights at 5,000 ft in lieu of 10,000 ft would<br />
typically save 3 kg per take-off.<br />
4.9.1 Climb-out Considerations<br />
On <strong>Fokker</strong> aircraft the ECS bleed selections ECON and NORM are available. If acceptable for<br />
passenger comfort, ECON is preferred above NORM as this will save fuel.<br />
For the <strong>Fokker</strong> 70/100 the fuel savings are approximately 0.5% and for the <strong>Fokker</strong> 50 this can be as<br />
high as 0.9% of the block fuel. <strong>The</strong>se figures are valid when the flight conditions are identical for<br />
ECON and NORM bleed. Under some conditions the rated thrust or power may change when ECS<br />
bleed is switched from NORM to ECON.<br />
4.10 LATERAL TRACK MANAGEMENT<br />
4.11 VERTICAL PROFILE MANAGEMENT IN CRUISE<br />
4.12 CRUISE SPEED MANAGEMENT<br />
4.13 FMS DESCENT PROFILE MANAGEMENT<br />
4.14 FMS DESCENT PROFILE<br />
4.14.1 Energy Management and Trade off<br />
4.14.2 Distance, speed and altitude trade off<br />
20
Fuel and Environmental Management<br />
4.14.3 Descent Profile Wind Corrections<br />
4.14.4 Landing Weight<br />
4.14.5 Engine Anti-Ice<br />
<strong>The</strong> <strong>Fokker</strong> 70 and <strong>Fokker</strong> 100 FMS does not take into account the effects of engine bleed off-takes<br />
on fuel flow. This may cause only small errors in fuel predictions and flight path optimization. <strong>The</strong><br />
descent idle fuel flow will increase by as much as 5% for the TAY620 engine and 10% for the TAY650<br />
engine, but as the total descent fuel is only a small part of the trip fuel, the absolute error remains<br />
small.<br />
However, if airframe anti-ice is selected during descent, the idle thrust will increase significantly. In<br />
that case the FMS uses too low idle thrust levels for the calculation of top of descent resulting in late<br />
descent initiation. In addition, to achieve required rate of descent the use of speed brakes may be<br />
required. Refer to the Airplane Operating Manuals section 5.08.01 page 2 for applicable procedures.<br />
<strong>The</strong>refore, if during descent the use of airframe anti-icing is anticipated, the descent shall be initiated<br />
earlier than calculated by FMS.<br />
For the <strong>Fokker</strong> 50 the selection of engine anti-ice has no appreciable effect on fuel consumption and<br />
descent flight path.<br />
4.14.6 ATC Restrictions<br />
4.14.7 Penalties for Early/Late Descent<br />
4.15 PILOT TECHNIQUE AND FUEL EFFICIENCY<br />
4.16 DESCENT PROFILE MANAGEMENT FOR NON-FMS AIRCRAFT<br />
4.17 BASIC PRINCIPLES OF THE DECELERATED APPROACH<br />
4.17.1 FMS Arrivals<br />
4.17.2 Decelerated Approaches (Low Noise Low Drag)<br />
4.17.3 High Head Winds on Final will result in long final legs<br />
4.18 REDUCED FLAP LANDING<br />
For the <strong>Fokker</strong> 50 the standard landing flap setting is 25. Only if required by the available landing<br />
distance, is flap setting 35 being used. <strong>The</strong>refore, no fuel savings can be obtained by means of<br />
reduced flap landings. In addition, flap setting 35 is selected at 300 ft AGL, which means that the<br />
exposure time to the high drag condition is very limited and hence the additional fuel for flaps 35 is<br />
only marginal.<br />
For the <strong>Fokker</strong> 70 and <strong>Fokker</strong> 100 however, the standard flap setting for landing is 42 degrees<br />
favored by the lower landing speeds. Leaving the flaps at 25 degrees throughout the final approach<br />
from 1300 ft AGL and including the landing if sufficient landing distance is available, reduces the fuel<br />
consumption by approximately 20-25 kg per landing. Do not use flap 25 if it is anticipated that due to<br />
21
Fuel and Environmental Management<br />
the increased landing distance the runway will be vacated later such that the fuel to taxi to the ramp<br />
will increase significantly.<br />
<strong>The</strong> <strong>Fokker</strong> 70 and 100 have extendable landing lights that normally are selected out in the descent<br />
at 10,000 ft. Depending on company policy, operational requirements, operational and weather<br />
conditions, this may be reduced to a lower flight level. Extending the landing lights at 5,000 ft in lieu of<br />
10,000 ft would typically save 2 kg per descent.<br />
4.19 IDLE ENGINE REVERSE ON LANDING<br />
On the <strong>Fokker</strong> 70 and <strong>Fokker</strong> 100 the use of idle reverse is recommended, refer to Aircraft Operating<br />
Manual Flight Techniques paragraph 7.06.01.<br />
For the <strong>Fokker</strong> 50, ground idle is recommended, which, in most situations is more than sufficient to<br />
obtain the required deceleration. Use reverse and wheel brakes as required.<br />
4.20 ENGINE-OUT TAXI-IN<br />
With the <strong>Fokker</strong> 70 and <strong>Fokker</strong> 100, taxi-in fuel can be saved by shutting off one engine as it is more<br />
efficient to produce a certain amount of thrust with only one engine rather than with two engines. In<br />
addition, at low landing weights, idle thrust on two engines is often exceeds the required thrust for<br />
taxiing. Single engine taxiing is therefore also beneficial with respect to brake life.<br />
After landing and after flaps, liftdumpers and speedbrakes are retracted, one engine may be shut<br />
down. However, observe one minute at idle for engine cool down.<br />
On average 25 kg fuel can be saved when taxiing for 10 minutes with one engine instead of two<br />
engines.<br />
For the <strong>Fokker</strong> 50 Single Engine Taxi is not recommended due to the higher asymmetry and because<br />
the idle thrust does not exceed the required thrust for taxiing.<br />
5 AIR TRAFFIC CONTROL<br />
5.1 OVERVIEW<br />
5.1.1 Fuel is burned to carry fuel<br />
5.1.2 Strategic management<br />
5.1.3 Possible Environment and Fuel Champion Accountabilities<br />
5.2 AT THE GATE<br />
5.3 TAXIING AND DEPARTURE<br />
5.4 CLIMB<br />
5.5 CRUISE<br />
5.6 SPEED CONTROL AND HEADING VECTORING<br />
5.7 DIRECT ROUTING<br />
5.8 DESCENT<br />
5.9 HOLDING<br />
22
Fuel and Environmental Management<br />
5.10 APPROACH AND LANDING<br />
5.11 WHAT CAN AIR NAVIGATION SERVICE PROVIDERS DO<br />
5.12 WHAT CAN AIR TRAFFIC CONTROLLERS DO<br />
6 MAINTENANCE AND ENGINEERING (M&E)<br />
In addition to the standard maintenance documents, you will find a wealth of information on<br />
maintenance and engineering related subjects on the www.myfokkerfleet.com website.<br />
Select “Knowledge” and then select one of the following groups for the relevant aircraft type:<br />
- Service Experience Digest<br />
- Service Letters<br />
- Technical Focus Group<br />
- All Operator Messages (aom)<br />
- Technical Operational Notices (TON)<br />
- Technical User Forum<br />
Many of these documents give “best practices” to keep your aircraft in optimum condition, also with<br />
respect to fuel consumption.<br />
6.1 GENERAL<br />
6.2 FUEL PENALTY CALCULATION<br />
6.3 AIRCRAFT WEIGHTS<br />
Block fuel increases with increasing aircraft weight. <strong>The</strong> aircraft weight is composed of the<br />
Operational Empty Weight (OEW), the fuel on board and the payload. To save fuel, it is important that<br />
the OEW is kept as low as possible.<br />
Apart from the lower fuel consumption, a low OEW has additional advantages, namely:<br />
- Increase of the maximum payload when limited by the Maximum Zero Fuel Weight (MZFW)<br />
- Increases of the maximum fuel to be loaded when limited by maximum take-off weight and by that<br />
either the range is increased or more fuel can be uploaded for fuel tankering purposes.<br />
In Table 6.3-1, the increase in block fuel and fuel <strong>cost</strong> is given for an increase of 100kg OEW. An<br />
average fuel price of € 0.50/kg has been applied, which is equivalent to approximately 0.73 US$/kg<br />
(Nov.2009) or 2.20 US$ /US Gallon as used in the IATA Fuelbook.<br />
In this scenario an average number of 2000 flights per aircraft per year is assumed for all <strong>Fokker</strong><br />
aircraft types. <strong>The</strong> assumed stage length for the <strong>Fokker</strong> 70 and <strong>Fokker</strong> 100 is 400 NM and 250 NM<br />
for the <strong>Fokker</strong> 50. An average block time of 1.2 hours is assumed for all <strong>Fokker</strong> aircraft types.<br />
23
Fuel and Environmental Management<br />
Aircraft type<br />
Speed<br />
Schedule<br />
Cruise<br />
Flight<br />
Level<br />
Increment in<br />
block fuel<br />
per flight [kg]<br />
Increment in<br />
block fuel<br />
per flight [%]<br />
Increment in<br />
annual fuel <strong>cost</strong><br />
per aircraft [€]<br />
<strong>Fokker</strong> 50 LRC 200 1.8 0.30 1,800<br />
250 2.1 0.36 2,100<br />
Max Cruise 200 1.0 0.16 1,000<br />
250 1.5 0.25 1,500<br />
<strong>Fokker</strong>70/100 LRC 250 3.8 0.15 3,800<br />
350 4.5 0.19 4,500<br />
Max Cruise 250 2.5 0.09 2,500<br />
350 4.2 0.16 3,500<br />
Table 6.3-1. Increment in block-fuel for 100 kg additional OEW.<br />
6.3.1 Weight & Balance - ATA 8<br />
<strong>Fokker</strong> aircraft Service Bulletins often have an effect on the weight of the aircraft. It may be<br />
worthwhile to take this aspect also into account in deciding to install or remove a Service Bulletin.<br />
One recently developed Service Bulletin is of particular interest, i.e. SBF100-25-110, which<br />
introduces of DRYLINER TM to reduce the formation of moisture and ice buildup in insulation blankets,<br />
eliminating significant weight. <strong>The</strong> details of this SB will be made available soon.<br />
6.3.2 Fly Away Kits or Flight Spares<br />
6.3.3 Aircraft Refueling - ATA 28<br />
6.4 AERODYNAMIC DETERIORATION<br />
6.4.1 Effect of drag on fuel consumption<br />
<strong>The</strong> effect of additional drag on block fuel depends on such parameters like aircraft weight, speed<br />
schedule, trip length and cruise altitude.<br />
<strong>The</strong>se parameters have been used to define four representative flight profiles for which the increase<br />
in block fuel as a result of a drag increment is determined.<br />
Based on these scenarios, it was concluded that the difference between the scenarios and the<br />
influence of aircraft weight are both small and that a general rule of thumb regarding the increase in<br />
block fuel due to a drag increment can be described by:<br />
∆F [%] = 0.45 * ∆C D for the <strong>Fokker</strong> 70 and <strong>Fokker</strong> 100 and<br />
∆F [%] = 0.20 * ∆C D for the <strong>Fokker</strong> 50<br />
24
Fuel and Environmental Management<br />
where ∆F is the relative increase in block fuel and ∆C D is the drag increment in counts.<br />
In the following sections examples will be given for the <strong>Fokker</strong> 50, 70 and 100 regarding the effect of<br />
drag increasing items.<br />
6.4.2 Aerodynamic critical areas<br />
In service, wear and tear inevitably leads to deterioration of the aerodynamic characteristics resulting<br />
in an increase in drag. When drag increases, more engine power or thrust is required, and hence the<br />
fuel consumption increases too. Reducing the aircraft’s drag whenever possible, is therefore an<br />
effective way to reduce the fuel consumption.<br />
<strong>The</strong> figures below mark the areas for the <strong>Fokker</strong> 50 and <strong>Fokker</strong> 70/100, where mismatches and<br />
surface roughness have the largest impact on the aircraft drag. <strong>The</strong>se critical and semi-critical areas<br />
are the so-called aerodynamic Class A (light colored areas) and Class B (dark colored areas).<br />
Especially in these areas, optimal surface quality and smoothness should be strived for.<br />
25
Fuel and Environmental Management<br />
Figure 6-1: left: Aerodynamic critical areas of the <strong>Fokker</strong> 70/F100<br />
right: Aerodynamic critical areas of the <strong>Fokker</strong> 50<br />
Important:<br />
mismatches or roughness on the leading edges of the wing and stabilizer<br />
should be avoided at all times. This is not only because of the increased drag,<br />
but because the aircraft’s stall speeds and characteristics will be negatively<br />
affected.<br />
26
Fuel and Environmental Management<br />
Aerodynamic smoothness in relation to Boundary Layer Flow:<br />
<strong>The</strong> boundary layer thickness of the airflow, together with the local pressure at a certain point<br />
of the body, determines mainly the area’s sensitivity to drag due to disturbances.<br />
As the boundary layer thickness of the airflow increases when moving more downstream,<br />
surface imperfections get more submerged in the boundary layer such that the impact on<br />
aerodynamic drag is less. On the other hand, surfaces that face the ‘undisturbed’ airflow, like<br />
the wing leading edges, stabilizer leading edges and the forward section of the fuselage, are<br />
aerodynamically critical areas where the boundary layer is still thin, and disturbances on the<br />
aircraft skin have a large impact on drag.<br />
As described above, the fuel burn penalty caused by drag-inducing items does not only depend on<br />
the irregularity itself, but also on its location. In the followings sections, items are presented to give<br />
insight in the various types of aerodynamic deterioration and their effect on the fuel consumption. <strong>The</strong><br />
values presented are mainly based on analysis using aerodynamic principles. <strong>The</strong> effects are often<br />
too small to measure during flight-testing.<br />
<strong>The</strong> drag increasing items will be discussed in more detail in chapter 6.8.6.<br />
6.5 AIRCRAFT PERFORMANCE MONITORING (APM)<br />
6.6 ENGINES<br />
It is sometimes overlooked that engine ground running also requires fuel. On many occasions<br />
alternatives are available for ground running. (e.g. <strong>Fokker</strong> 70/100 P3 Static Leak Test see RR NTO<br />
88 or in-flight checks during revenue flights). If ground running cannot be avoided, prepare the tests<br />
carefully such that no time is wasted with running engines.<br />
6.6.1 Engine Water Wash<br />
For the <strong>Fokker</strong> 70 and <strong>Fokker</strong> 100, engine water washing provides the best means of restoring<br />
engine efficiency between shop visits.<br />
Rolls-Royce has issued a (Repeater) Technical Variance 95279R “Alternative Compressor Wash<br />
procedure”. <strong>The</strong> on-wing engine wash is performed with EcoPower of which a presentation is<br />
available through our My<strong>Fokker</strong>Fleet.com website / Knowledge / Fo70/100 / TFG / TFG23 / 2008-04-<br />
15-On-Wing-Engine-Water-wash.<br />
One operator performed several trials with EcoPower to establish the associated fuel burn<br />
improvement. Preliminary results indicate a reduction of up to 2% fuel burn. Available data however is<br />
very scattered. Reported experience indicates a typical repeat wash interval of around 500FH.<br />
However, the optimum engine water wash interval is operator-specific and dependent on the<br />
operational environment.<br />
27
Fuel and Environmental Management<br />
For the <strong>Fokker</strong> 50 no trials have been executed so far. However, provisions are available for the<br />
<strong>Fokker</strong> 50 to enable the use of EcoPower. Operators are invited to start a compressor wash trial with<br />
EcoPower.<br />
6.6.2 Engine Build Standards<br />
6.6.2.1 Refurbishment of Engines for Fuel Efficiency<br />
Fuel efficiency of the Tay engines on the <strong>Fokker</strong> 70 and <strong>Fokker</strong> 100 can sometimes be improved with<br />
Rolls Royce Service Bulletin TAY-72-1603 - “Instructions for a repair to the LP compressor (fan)<br />
blade leading edge profile”<br />
6.6.3 Engine on wing monitoring<br />
6.6.4 Engine handling while aircraft is in maintenance<br />
6.6.5 Recommendations<br />
6.7 APU<br />
<strong>The</strong> APU on the <strong>Fokker</strong> 70/100 has an average fuel consumption of:<br />
Garrett RR type : 87 kg/hr (191 lb/hr)<br />
Garrett R type : 73 kg/hr (160 lb/hr)<br />
For those <strong>Fokker</strong> 50/60 aircraft equipped with an APU an average fuel consumption of 107 kg/hr (236<br />
lb/hr) is typical.<br />
6.7.1 Ground Support Equipment (GSE)<br />
6.7.2 Recommendations<br />
6.8 AIRFRAME SYSTEMS<br />
6.8.1 Environmental Control System - ATA 21<br />
6.8.2 Flight Controls - ATA 27<br />
6.8.3 Fuel System (Airframe) - ATA 28<br />
6.8.4 Instruments - ATA 31<br />
6.8.5 Pneumatic System - ATA 36<br />
6.8.6 Structure and Doors - ATA 51-57<br />
In this section examples are given of roughness, mismatches, leakages and mis-rigging and their<br />
effect on fuel consumption. <strong>The</strong> Structural Repair Manual (SRM) and the Aircraft Maintenance<br />
Manual (AMM) give maximum values that are based on flight safety (deterioration of flight handling<br />
and performance). It is emphasized that for fuel conservation reasons more restrictive values are<br />
recommended.<br />
28
Fuel and Environmental Management<br />
At all times, the wing leading edges should be kept (aerodynamically) clean, not only from the point of<br />
increased fuel consumption, but because a contaminated leading edge adversely affects the stall<br />
speed and stall characteristics of the aircraft, and hence reduces flight safety.<br />
6.8.6.1 Skin roughness<br />
In order to minimize the consumption of fuel, the aircraft skin roughness should be minimized as<br />
much as possible. Roughness may be present in various forms such as damaged paint, non-flush<br />
rivets, dirt and waviness.<br />
Paint Peeling and Erosion<br />
<strong>The</strong> wings as well as the nose section of the fuselage and stabilizer are typically Class A and B<br />
aerodynamic areas, where skin roughness has the strongest impact on fuel consumption. <strong>The</strong><br />
following table gives rough estimates of the increase in fuel consumption due to light and heavily<br />
deteriorated skin paint on the wings and stabilizer, followed by some examples of such paint<br />
deterioration.<br />
Paint condition<br />
Lightly damaged paint<br />
<strong>Fokker</strong> 50 <strong>Fokker</strong> 70/100<br />
Increase in Block Fuel<br />
[∆%/m 2 ]<br />
Increase in Block Fuel<br />
[∆ %/m 2 ]<br />
Class A 0.014 0.014<br />
Class B 0.009 0.009<br />
Heavily damaged paint<br />
Class A 0.050 0.050<br />
Class B 0.014 0.015<br />
Table 6.8-1: Effect of rough paint on the fuel consumption<br />
<strong>The</strong> above values are rough estimates for average cruise conditions. Also, within the defined critical<br />
areas (Class A and B) the effect may vary. For roughness close to the leading edges of the wings or<br />
stabilizer, the increase in block fuel may even double because of the high overspeeds and local<br />
pressures.<br />
<strong>The</strong> de-icing boots of the <strong>Fokker</strong> 50 on the leading edges of the wings may become damaged<br />
(swelling and ballooning) which is comparable to heavily damaged paint.<br />
For the <strong>Fokker</strong> 50, areas that are in the slipstream of the propellers are particularly important. <strong>The</strong><br />
slipstream causes an increase of the dynamic pressure ratio (local over free stream dynamic<br />
pressure) over the wing, and in some part on the horizontal stabilizer. Since drag is closely related to<br />
this dynamic pressure ratio, skin roughness in the propeller slipstream has a significant contribution to<br />
the fuel consumption. <strong>The</strong> propeller slipstream also affects the outboard side of the left hand nacelle,<br />
29
Fuel and Environmental Management<br />
and inboard side of the right hand nacelle. <strong>The</strong> front section of the nacelle is a Class A area, in which<br />
(distributed) roughness should be minimized as much as possible.<br />
<strong>The</strong> propeller leading edges are prone to erosion, especially the de-icing boots. Eroded leading<br />
edges lead to lower propeller efficiency and hence higher fuel consumption. <strong>The</strong>refore the leading<br />
edges should be inspected regularly for erosion. When operating on unpaved or sandy/dusty<br />
runways, protection tape may be considered. (See also <strong>Fokker</strong> 50 Service Experience Digest 61-10)<br />
NACA inlets, such as the airco inlets, and the engine air intakes are designed as low-drag inlets.<br />
Roughness in or around the inlet does not only introduce unnecessary drag, but it may also disturb<br />
the airflow and by that the effectiveness of the inlet is reduced.<br />
Figure 6-2: Left: Heavily damaged paint on trailing edge of the flap track fairing of a <strong>Fokker</strong> 70<br />
Right: Lightly damaged paint on the vertical stabilizer of a <strong>Fokker</strong> 50<br />
Dirt<br />
Dirt adhering to the aircraft skin has only a very small contribution to aircraft drag. It is estimated that<br />
for an excessively dirty aircraft the fuel consumption rises up to 0.1%. <strong>The</strong> drag contribution comes<br />
mainly from the critical aerodynamic areas. Dirt, but also large amounts of dead bugs on the leading<br />
edges must be avoided as apart from the drag increase, it adversely affects stall speed and stalling<br />
characteristics.<br />
Although the drag-rise is small, regular cleaning of the aircraft helps in locating leakages and<br />
damages on the aircraft.<br />
30
Fuel and Environmental Management<br />
Dents<br />
Dents on strongly curved or sharp-edged surfaces such as the leading edges of the wings and<br />
stabilizer, can have a strong contribution to drag. Dents of 1 mm depth on the wing leading edges of<br />
the <strong>Fokker</strong> 70 and <strong>Fokker</strong> 100 can increase the fuel consumption by as much as 1.5%. When the<br />
dent is further downstream on the body, the dents gets more submerged in the boundary layer and its<br />
impact on drag is much smaller or even negligible.<br />
Large soft dents are interpreted as waviness. Waviness has a drag increase that is proportional to the<br />
height and length of the wave.<br />
Protruding, inset and missing fasteners<br />
Although rivets and screw are relatively small items, their contribution to drag rise when not properly<br />
installed must not be underestimated, especially fasteners located in the aerodynamically critical<br />
areas. <strong>The</strong> following figures show examples of inset fasteners on the boundary layer fence and<br />
leading edge of the wing fuselage fairing. On the left pictures, it is also shown that the seal shows<br />
cracks and dents. <strong>The</strong> cracks and dents increase the aircraft drag, but may also induce improper<br />
functioning of the seal, i.e. air can leak from one side to the other side of the boundary layer fence. A<br />
leaking boundary layer fence may affect the stalling characteristics of the aircraft. It is emphasized<br />
that clean and properly sealed leading edges should be strived for at all times.<br />
Figure 6-3: Examples of inset fasteners<br />
<strong>The</strong> drag of an inset screw as presented in the left picture having soft rounded edges can be at least<br />
5 times higher than a flush screw. <strong>The</strong> drag of an inset fastener having sharp and notch edges may<br />
be more than 20 times higher. <strong>The</strong> effect of a protruding or inset rivet is demonstrated in the following<br />
figure. In this figure, the relative drag-rise is shown of a non-flush rivet compared to that of a flush<br />
rivet.<br />
31
Fuel and Environmental Management<br />
Figure 6-4: Effect of inset or protruding rivet<br />
<strong>The</strong> notched holes in the wing fuselage fairing on the leading edge as shown in the right figure, may<br />
increase the fuel consumption by 3.3 x 10 -4 % for a single rivet. Having 5 notched holes on leading<br />
edges of both wing fuselage fairings would hence require 0.0033% additional block fuel.<br />
Figure 6-5: Example of chipped paint near static ports<br />
<strong>The</strong> above figure shows chipped-off paint in front of the static ports. Although only a small increase in<br />
drag may be expected, more important here is that the airflow is disturbed which can result in an error<br />
in speed and altitude indication. A lower speed indication of 0.01 Mach, already requires 2.3%<br />
additional fuel burn in cruising flight. <strong>The</strong> effect on fuel consumption of an error in altitude indication is<br />
less, but here flight safety may be reduced especially when operating in RVSM areas.<br />
32
Fuel and Environmental Management<br />
Waviness<br />
<strong>The</strong> fuel burn increase due to waviness is typically due to additional pressure drag. <strong>The</strong> drag of<br />
waviness is a function of the ratio of the height squared to length. It has been determined that for the<br />
<strong>Fokker</strong> 70 and <strong>Fokker</strong> 100, a waviness as shown in the following figure, would result in an average<br />
increase in fuel consumption of approximately 0.5x10 -4 % at non-critical locations.<br />
Figure 6-6: Waviness; L = 500 mm, h = 5 mm and 1 meter wide<br />
6.8.6.2 Gaps and Mismatches<br />
Mismatches may manifest themselves in various ways, not only by external repairs but also for<br />
example by sealant that protrudes from the filled area. Some of the most common mismatches, and<br />
their drag contribution are discussed in this section.<br />
<strong>The</strong> following figure shows the effect of a step out of the fuselage contour, such as a repair plate or a<br />
protruding door, etc. It shows that at the forward fuselage section the impact of external deterioration<br />
is the strongest, and to some extent close to the wings too. In the following figure, the increase in<br />
block fuel is given in percentage per meter mismatch length.<br />
Front<br />
Section<br />
Wings<br />
Figure 6-7: Increase in fuel consumption due to repair patch on fuselage (<strong>Fokker</strong> 70/100)<br />
33
Fuel and Environmental Management<br />
<strong>The</strong> figure, which is based on wind tunnel pressure measurements, can be used to illustrate the effect<br />
of repairs or mismatches on the fuselage surface. It shows that mismatches have a strong impact on<br />
the front section of the fuselage and close to the wings.<br />
For example, a main passenger door protruding 3mm, results in a fuel consumption increase of<br />
approximately 0.05%.<br />
For the <strong>Fokker</strong> 50 no wind tunnel pressure measurements are available. However, calculations have<br />
shown that a main passenger door on the <strong>Fokker</strong> 50, protruding 3mm, would also result in a fuel rise<br />
of approximately 0.05%.<br />
Figure 6-8: Example of NLG door protruding 5 mm out of fuselage skin (<strong>Fokker</strong> 70), resulting in<br />
approximately 0.05% increase in fuel consumption<br />
Figure 6-9: Protruding leading edge seal (h = 1 mm)<br />
Leading edge mismatches due to protruding sealant, may not only be created during the application<br />
of the sealant, but also due to aging and the deformation of the wing during operation. At the leading<br />
34
Fuel and Environmental Management<br />
edges high suction peaks are present and also the boundary layer thickness is still very thin.<br />
<strong>The</strong>refore protruding (or pockmarked) sealant has a strong impact on the fuel consumption, Sealant<br />
protruding 1 mm over a span of 1 meter, results in a fuel increase of approximately 0.1%. <strong>The</strong>refore,<br />
adhere to the AMM (Restoration of aerodynamic smoothness, subtask 51-14-00-320), regarding<br />
correct application of sealant.<br />
Figure 6-10: Correct and incorrect applied sealant<br />
<strong>The</strong> engine nacelles (and engine duct/intake) of both <strong>Fokker</strong> 50 and <strong>Fokker</strong> 70/100 are critical<br />
aerodynamic areas. All surface discrepancies here incur considerable drag. As a practical example a<br />
mismatch of 2 mm on the <strong>Fokker</strong> 50 cowling was discovered (see Figure 6-11, the mismatch extends<br />
to both sides of the nacelle). <strong>The</strong> front part of the engine nacelle is an aerodynamically critical area.<br />
Conservative calculations showed that the fuel consumption may increase by up to 0.1 % for such a<br />
misalignment.<br />
35
Fuel and Environmental Management<br />
Figure 6-11: Mismatch around a <strong>Fokker</strong> 50 engine air intake having a mismatch of 2 mm<br />
Repair Patches<br />
Non-flush repair patches always affect aircraft drag. However, by working the edges, the drag rise<br />
can be minimized. <strong>The</strong> next figure demonstrates the importance of rounding the repair patch’s edges.<br />
It shows that an oblique and a rectangular edge have a drag that are 2.7 times and 10 times higher,<br />
respectively, compared to that of a rounded edge. A scooping repair patch results in an even higher<br />
drag. <strong>The</strong>refore prevent buckling of the edges of the repair patch.<br />
Figure 6-12: Drag of steps relative to rounded off edge.<br />
External repair patches on the leading edges (wings, stabilizer, flaps) must be applied as wrap<br />
around repairs. By wrapping the patch around the leading edges the drag rise is minimized (only a<br />
step down at the rear of the patch), and secondly the risk of flow separation is minimized.<br />
6.8.6.3 Missing or damaged seals (leakage)<br />
Pressure leakage is an unwanted airflow from, or into, the boundary layer which affects the pressure<br />
gradient of the boundary layer. A change of the pressure gradient mostly results in a drag rise,<br />
reduced effectiveness of control surfaces and may even create turbulence. Research in wind tunnels<br />
has shown that a considerable increment of drag can be caused by all types of leaks, such as<br />
missing or damaged seals, but also cracks, gaps and holes in the aircraft skin.<br />
36
Fuel and Environmental Management<br />
Seals can be found at various locations. Examples are:<br />
- Main passenger door<br />
- Emergency exit doors<br />
- Landing gear doors<br />
- Cargo doors<br />
- Cockpit windows<br />
- Stabilizer<br />
- Engine nacelles<br />
- Control surfaces (e.g. aileron)<br />
- Flaps<br />
- Fairings and radomes<br />
- Servicing doors<br />
- Leading edges<br />
- Wing-fuselage fairing sealant<br />
- Stubwing seals<br />
- Boundary Layer Fence<br />
- Stall Promoter strip<br />
- Ice protection panels (<strong>Fokker</strong> 50 fuselage)<br />
Figure 6-13: Illustration of leakage due to misalignment (left) and missing seal (right) on the shroud<br />
door<br />
If the joints between the wings and the fuselage are not completely sealed, high-pressure air from<br />
below the wings will force its way up through the joints and create turbulence where it emerges on the<br />
top surface. Not only does this turbulence cause drag but also a reduction in lift by disturbing the<br />
upper surface airflow. Seals are applied in order to prevent such a pressure leak.<br />
Special attention must be paid to the Boundary Layer Fence (B.L.F.) (Figure 6-14) at the wing leading<br />
edges, which are used in conjunction with a stall promoter strip. Leakage of the BLF seal, or stall<br />
promoter (due to missing adhesives or loose rivets) disturbs the boundary layer and may cause<br />
undesirable stall behavior.<br />
37
Fuel and Environmental Management<br />
Joint straps<br />
Too little sealing may cause leakage of wing anti-icing bleed air to ambient, resulting in a distortion of<br />
the boundary layer.<br />
If too much sealing is applied, it will be pressed out of the gaps in flight. <strong>The</strong> resulting sealing ridges<br />
will have an unacceptable effect on the stalling characteristics of the wing and they increase fuel<br />
consumption.<br />
Figure 6-14:Loose BLF seal<br />
Cabin air leakage may result from missing and deteriorated seals on passenger doors, windows and<br />
emergency exits. <strong>The</strong> estimated increase in block fuel due to cabin seal leakage is approximately<br />
0.010% per 5 cm of missing seal for aerodynamically semi-critical areas. For less critical areas,<br />
approximately 0.006% is expected. Leakage may be discovered by the dark traces on the fuselage<br />
around doors and by inspection of the seals.<br />
<strong>The</strong> drag increase for leakage due to missing or damaged sealing, from or to non-pressurized areas,<br />
is much lower. Other studies indicate that leakage of the wing-body faring, flaps, ailerons, and nose<br />
gear doors result in a fuel consumption increase of 0.05 %/m<br />
Figure 6-15: Dark smudges indicating leaking/loose rivets<br />
38
Fuel and Environmental Management<br />
During a drag cleanup program for the <strong>Fokker</strong> 50 it was found that unsealed flaps or badly sealed<br />
flaps increase the fuel consumption with about 0.2 %. Leakage of the main landing gear doors may<br />
cause up to 0.2 % fuel consumption increase when air is vented through the main landing gear doors<br />
into the wing.<br />
6.8.6.4 Mis-rigging and misalignment<br />
A misalignment of a control surface will have an effect on the pressure distribution around the<br />
surface’s contour, resulting in additional drag and in a change of the hinge moment.<br />
For the <strong>Fokker</strong> 50 this change in hinge moment must be counterbalanced by a trim-tab deflection for<br />
the ailerons, rudder and elevator, resulting in another drag increment.<br />
<strong>The</strong>refore, the need for trimming of the rudder and ailerons may be an indication of misalignment.<br />
6.8.6.5 MMEL items and Configuration Deviations<br />
Drag characteristics based on missing Configuration Deviation List (CDL) items have been<br />
determined for the <strong>Fokker</strong> aircraft. <strong>The</strong> tables below indicate the effect of missing items on the fuel<br />
consumption. <strong>The</strong>se effects have recently been included in a revision to the CDLs and MMELs.<br />
<strong>Fokker</strong> 70 and <strong>Fokker</strong> 100<br />
CDL<br />
Seq. No<br />
Item Increase in Block Fuel [%]<br />
52-04 1 Nose wheel door 0.6<br />
52-04 2 Nose wheel doors 1.2<br />
52-05 1 Main wheel door 1.1<br />
52-05 2 Main wheel door 2.2<br />
52-07 1 Main landing gear strut bay door 0.3<br />
52-07 2 Main landing gear strut bay doors 0.6<br />
53-09 1 Speed brake 1.0<br />
53-09 2 Speed brakes 1.6<br />
Table 6.8-2: Increase in block fuel due to missing items (<strong>Fokker</strong> 70/100)<br />
In the case that landing lights are stuck in the extended position, the following increases of the block<br />
fuel may be expected:<br />
39
Fuel and Environmental Management<br />
<strong>Fokker</strong> 70 and <strong>Fokker</strong> 100<br />
MMEL<br />
ITEM<br />
Item Increase in Block Fuel [%]<br />
33-44-1 Flare-out Light/ Nose Landing Light stuck in ext. pos. 2.6<br />
33-44-1<br />
Wing landing light stuck in extended position<br />
Pre SBF100-33-14<br />
Post SBF100-33-14<br />
33-45-1 Taxi light stuck in extended position 2.6<br />
Table 6.8-3: Increase in block fuel due to landing lights stuck in extended position (<strong>Fokker</strong> 70/100)<br />
For the <strong>Fokker</strong> 50 the fuel consumption increase as a result of missing CDL items is shown below.<br />
2.6<br />
2.8<br />
<strong>Fokker</strong> 50<br />
CDL<br />
Seq. No<br />
Item Increase in Block Fuel [%]<br />
54-01 1 Rear part of tail cone 0.3<br />
54-01 Both Rear part of tail cone 0.5<br />
57-10 Wing Shroud Panel 0.3<br />
Table 6.8-4: Increase in block fuel due to missing CDL items (<strong>Fokker</strong> 50)<br />
6.8.7 Recommendations<br />
6.9 MAINTENANCE PLANNING<br />
6.10 MAINTENANCE TRAINING<br />
6.10.1 Recommendations<br />
6.11 FUEL CONSERVATION DOCUMENTATION<br />
7 MARKETING AND SALES<br />
7.1 GENERAL<br />
7.1.1 Cost of Weight<br />
7.1.1.1 Recommendations<br />
7.1.2 Cabin Furnishings and Emergency Equipment - ATA 25<br />
7.1.2.1 Recommendations<br />
7.1.3 Potable Water - ATA 38<br />
7.1.3.1 Recommendations<br />
7.1.4 Aircraft Utilization / Timetable<br />
7.1.4.1 Recommendations<br />
40
Fuel and Environmental Management<br />
8 IATA FUEL SERVICES: FUEL STANDARDS & QUALITY<br />
8.1 COLLABORATION FOR REAL RESULTS<br />
8.2 OBJECTIVES OF THE IATA TECHNICAL FUEL GROUP (TFG)<br />
8.3 IATA FUEL QUALITY POOL (IFQP)<br />
8.4 IMPROVING SAFETY AND QUALITY CONTROL<br />
8.5 COMMON OBJECTIVES<br />
9 GLOSSARY<br />
41
42<br />
Fuel and Environmental Management
<strong>The</strong> <strong>cost</strong> <strong>index</strong><br />
Appendix A<br />
<strong>The</strong> Cost Index Explained
Appendix A - <strong>The</strong> Cost Index Explained<br />
<strong>The</strong> Cost Index (CI) as explained below, plays an important role in the determination of the <strong>cost</strong><br />
optimized flight profiles. This appendix provides a brief explanation and a sample calculation of<br />
the Cost Index.<br />
A.1 MINIMIZING THE COST PER FLIGHT<br />
<strong>The</strong> total <strong>cost</strong> per flight at a given range can be considered to consist of a fixed <strong>cost</strong>, <strong>cost</strong><br />
depending on flight time, and fuel <strong>cost</strong>:<br />
in which:<br />
C = total <strong>cost</strong> per flight<br />
C 0 = fixed <strong>cost</strong><br />
C T = time related <strong>cost</strong><br />
t = trip time<br />
C F = fuel <strong>cost</strong><br />
W F = trip fuel<br />
C = C 0 + C T x t + C F x W F (eq. 1)<br />
A graphical representation of the total <strong>cost</strong> C as a function of the speed is shown in the figure<br />
below.<br />
2
Appendix A - <strong>The</strong> Cost Index Explained<br />
Cost per<br />
flight<br />
Minimum<br />
<strong>cost</strong><br />
Time<br />
related<br />
<strong>cost</strong><br />
Total <strong>cost</strong><br />
Fuel <strong>cost</strong><br />
Max.<br />
Operating<br />
Speed<br />
Speed<br />
Minimum<br />
Fuel speed<br />
Minimum<br />
Cost speed<br />
Minimum<br />
Time speed<br />
Figure App.A - 1 Cost as a function of speed<br />
Minimization of the total <strong>cost</strong> C per flight is independent of C 0 and depends only on the trip time<br />
dependent <strong>cost</strong> C T x t and the trip fuel dependent <strong>cost</strong> C F x W F .<br />
If the <strong>cost</strong> per unit of time C T and the <strong>cost</strong> per unit of fuel C F are known, a trade-off between trip<br />
fuel and trip time for minimum operating <strong>cost</strong> may be calculated. Two special cases of the <strong>cost</strong><br />
optimization process are of interest:<br />
When the trip time dependent <strong>cost</strong>s are ignored or, in other words, the value of C T is set at zero,<br />
the total <strong>cost</strong> C expressed in equation 1 is reduced to:<br />
C = C 0 + C F x W F<br />
As illustrated in figure App.A-1, a minimum <strong>cost</strong> flight with C T =0 is achieved at the speed at which<br />
the trip fuel is minimized.<br />
When the trip fuel dependent <strong>cost</strong>s are ignored, and thus C F is set at zero, the total <strong>cost</strong> is<br />
reduced to:<br />
C = C 0 + C T x t.<br />
3
Appendix A - <strong>The</strong> Cost Index Explained<br />
As illustrated in figure App.A-1, a minimum <strong>cost</strong> flight with C F =0 is achieved when the speed is as<br />
high as possible. During actual operation of the aircraft, this speed may be limited by either the<br />
maximum operating speed or the (cruise) thrust of the engines.<br />
<strong>The</strong> fixed <strong>cost</strong> C 0 can be ignored when optimizing the <strong>cost</strong> per flight. In fact, only the ratio of time<br />
and fuel dependent <strong>cost</strong> is of interest. This is illustrated by re-writing equation 1 as follows:<br />
in which the Cost Index CI = C T /C F .<br />
C - C 0 = C F x (CI x t + W F )<br />
<strong>The</strong> unit of the Cost Index is normally kg/min and it represents the value of one minute of block<br />
time expressed in kilograms of fuel.<br />
By using this conversion of the block time into block fuel, the <strong>cost</strong> of a flight can be expressed<br />
entirely in kilograms of fuel. By variation of the flight profile and speed schedule the conditions for<br />
the lowest <strong>cost</strong> can now easily be calculated.<br />
A.2 COST INDEX AND ITS USE BY FMS<br />
<strong>The</strong> Flight Management System (FMS) of the <strong>Fokker</strong> 70 and <strong>Fokker</strong> 100 provides automatic<br />
navigation, guidance and in-flight performance optimization. <strong>The</strong> FMS performance function<br />
ECON allows the computation of a flight profile that yields the lowest possible <strong>cost</strong> for a given trip<br />
by means of the Cost Index.<br />
<strong>The</strong> Cost Index allows the Flight Management System to generate <strong>cost</strong> optimized flight profiles<br />
independent of the individual values of C T and C F . After activation of the FMS performance<br />
function ECON, the <strong>cost</strong> optimization process is started. <strong>The</strong> optimum cruise speed (Mach) is<br />
obtained from a table in the FMS. This optimum Mach is a function of altitude, aircraft weight,<br />
wind speed and <strong>cost</strong> <strong>index</strong>, and has been pre-calculated during an off-line study. This study is<br />
based on the minimization of the so-called cruise <strong>cost</strong> function λ, representing the <strong>cost</strong> per unit of<br />
cruise distance:<br />
λ = ( CI + FF cruise ) / V G<br />
in which:<br />
FF cruise is the total cruise fuel flow<br />
V G is the airplane ground speed.<br />
Minimization of this cruise <strong>cost</strong> function with altitude and airspeed (Mach) as the independent<br />
variables, results in the minimum cruise <strong>cost</strong> condition at given values of aircraft weight, wind<br />
speed and <strong>cost</strong> <strong>index</strong>. <strong>The</strong> influence of the <strong>cost</strong> <strong>index</strong> on the optimum cruise speed at a fixed<br />
altitude and airplane weight is illustrated in Figure App.A-2.<br />
4
Appendix A - <strong>The</strong> Cost Index Explained<br />
Cruise <strong>cost</strong><br />
function<br />
λ<br />
Increasing<br />
CI<br />
Locus of<br />
minimum<br />
cruise <strong>cost</strong><br />
speed<br />
.<br />
Max Cruise<br />
Speed<br />
Cruise<br />
Speed<br />
Figure App.A - 2 Cruise <strong>cost</strong> function λ versus cruise speed<br />
After selection by FMS of the optimum cruise Mach at a given altitude, the corresponding cruise<br />
<strong>cost</strong> is calculated. This process is repeated for different altitudes to determine the optimum cruise<br />
altitude. Once the cruise optimization has been carried out, the climb <strong>cost</strong> and descent <strong>cost</strong> are<br />
minimized by selecting the pre-calculated optimum climb- and descent speed stored in the FMS<br />
database. Mach during the final part of the climb and the initial part of the descent are set equal<br />
to the optimum cruise Mach.<br />
It should be noted that a selection of <strong>cost</strong> <strong>index</strong> CI = 0 produces the afore-mentioned minimum<br />
fuel profile. <strong>The</strong> same result is achieved when the MIN FUEL strategic mode is selected by the<br />
pilot via the Control Display Unit (CDU) of the FMS. Representing the other end of the <strong>cost</strong> <strong>index</strong><br />
range, a high value of the <strong>cost</strong> <strong>index</strong> of around 100 kg/min will cause the FMS to generate a<br />
cruise speed close to M MO , which is also achieved when the MIN TIME strategic mode is<br />
selected.<br />
During actual flight operations, the aforementioned optimum (minimum <strong>cost</strong>) flight profile may be<br />
subject to certain constraints. For instance, cruise at optimum cruise level is not possible due to<br />
the difference between the cruise level allowed by Air Traffic Control and the FMS calculated<br />
optimum cruise level. Short-range flights in which the total distance required to climb to and<br />
5
Appendix A - <strong>The</strong> Cost Index Explained<br />
descent from the optimum cruise level exceeds the trip distance, may require adjustment of the<br />
initially calculated optimum cruise altitude.<br />
A.3 SAMPLE CALCULATION OF THE COST INDEX<br />
Determination of the <strong>cost</strong> <strong>index</strong> value – to be performed by the airline - should be based on a<br />
careful <strong>cost</strong> analysis. When designing the flight schedule in an airline's operation, the value<br />
placed on time is relatively high, because the faster an aircraft flies, the more passenger-miles it<br />
produces in a working day. Once operating a fixed schedule, a few minutes gained or lost during<br />
flight, usually cannot be converted into productivity.<br />
<strong>The</strong> effect of productivity is therefore excluded from the analysis. <strong>The</strong> time-related <strong>cost</strong>s are then<br />
limited to those maintenance tasks which are a function of flight time, and possibly a portion of<br />
the crew's pay.<br />
As already explained, the determination of C T requires careful consideration by the airline.<br />
It is not always obvious which <strong>cost</strong> elements should be included in C 0 and C T .<br />
For instance, crew <strong>cost</strong> may be based on scheduled block time or actual block time. For the latter<br />
condition it is clear that a gain in actual flying time reduces crew <strong>cost</strong> for a given trip and shall<br />
therefore be part of the time-related <strong>cost</strong>. For the former condition, reducing actual block-time<br />
does not affect the crew <strong>cost</strong> and shall therefore be part of the fixed trip <strong>cost</strong>.<br />
Another example is maintenance <strong>cost</strong>. <strong>The</strong> time related maintenance <strong>cost</strong> per trip can be reduced<br />
by decreasing the block time. However, this is usually accomplished by flying faster and thus<br />
thrust will have to increase. <strong>The</strong> higher thrust levels may cause increased wear and tear, which<br />
will have an impact on the overhaul <strong>cost</strong> of the engines, unless “power-by-the-hour”<br />
arrangements have been agreed upon with an engine maintenance provider.<br />
Also, as stated before, the effect of a change in productivity (i.e. an additional flight in a working<br />
day when sufficient time is gained) is not included. This assumption seems to be reasonable as it<br />
is usually impossible to schedule another flight on such short notice. However, one can imagine<br />
that a flight has to be cancelled because the previous flights of the day were flown at low speed to<br />
save fuel. Also, passengers missing their connection due to late arrival due to fuel saving policies<br />
may cause huge additional losses far higher than the fuel <strong>cost</strong> gained.<br />
6
Appendix A - <strong>The</strong> Cost Index Explained<br />
As an illustration, a sample calculation of C 0 , C T and CI is presented, based on the following<br />
assumptions:<br />
number of trips: 2000 per year<br />
fixed <strong>cost</strong>: 1,000,000 US$ per year (ownership <strong>cost</strong> i.e. depreciation, interest, insurance)<br />
crew <strong>cost</strong>: 600 US$ per block hour flown (cabin + cockpit)<br />
maintenance <strong>cost</strong>: 800 US$ per hour<br />
direct expenses: 1500 US$ per trip (navigation charges, landing fees, ground handling <strong>cost</strong>s)<br />
Fixed <strong>cost</strong> per trip:<br />
fixed <strong>cost</strong> per year<br />
C 0 = ————————————— + direct expenses<br />
number of trips per year<br />
1,000,000<br />
C 0 = ————— + 1500<br />
2000<br />
C 0 = 2000 US$ per trip<br />
Cost per unit of trip time:<br />
C T = crew <strong>cost</strong> + maintenance <strong>cost</strong> per hour<br />
C T = 600 + 800 = 1400 US$ per hour or 23.3 US$ per minute<br />
Fuel Cost<br />
<strong>The</strong> <strong>cost</strong> per unit of fuel is assumed to be:<br />
C F = 2.20 US$ per US gallon or 0.73 US$ per kg.<br />
Cost Index<br />
<strong>The</strong> Cost Index CI is then calculated as 23.3 / 0.73 kg/min = 32 kg/min<br />
Note that when the crew <strong>cost</strong> is defined as a fixed value per scheduled block hour instead of per<br />
flight hour, the value of C T will change from 1400 into 800 US$ per hour and as a consequence<br />
CI will change from 32 kg/min into 18 kg/min.<br />
7
8<br />
Appendix A - <strong>The</strong> Cost Index Explained
2<br />
Appendix A - <strong>The</strong> Cost Index Explained