

Amadeus-Shaping-the-Future-of-Travel-MacroTrends-Report
Amadeus-Shaping-the-Future-of-Travel-MacroTrends-Report
Amadeus-Shaping-the-Future-of-Travel-MacroTrends-Report

Create successful ePaper yourself
Turn your PDF publications into a flip-book with our unique Google optimized e-Paper software.
<strong>Shaping</strong> <strong>the</strong> <strong>Future</strong> <strong>of</strong> <strong>Travel</strong><br />
Macro trends driving industry growth over <strong>the</strong> next decade<br />
Table 1.1: Growth in overnight visitor flows by region<br />
Region Average Annual Growth (%)<br />
2002-2012 2013-2023<br />
Asia 8.5% 15.1%<br />
MEA 8.4% 11.9%<br />
Europe 2.1% 3.9%<br />
Americas 3.7% 6.4%<br />
Source: Oxford Economics<br />
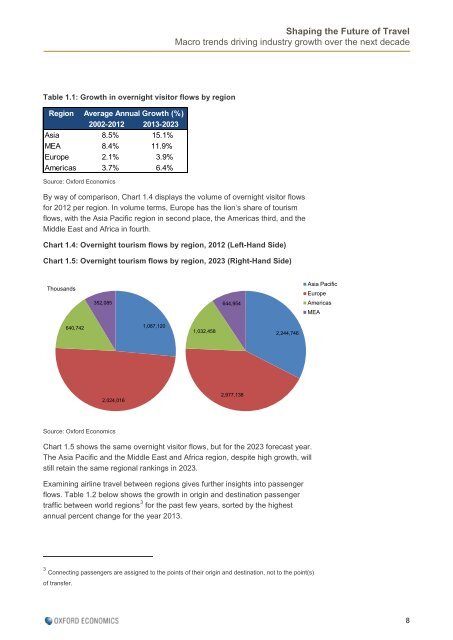
By way <strong>of</strong> comparison, Chart 1.4 displays <strong>the</strong> volume <strong>of</strong> overnight visitor flows<br />
for 2012 per region. In volume terms, Europe has <strong>the</strong> lion’s share <strong>of</strong> tourism<br />
flows, with <strong>the</strong> Asia Pacific region in second place, <strong>the</strong> Americas third, and <strong>the</strong><br />
Middle East and Africa in fourth.<br />
Chart 1.4: Overnight tourism flows by region, 2012 (Left-Hand Side)<br />
Chart 1.5: Overnight tourism flows by region, 2023 (Right-Hand Side)<br />
Thousands<br />
352,085<br />
644,954<br />
Asia Pacific<br />
Europe<br />
Americas<br />
MEA<br />
640,742<br />
1,087,120<br />
1,032,458<br />
2,244,746<br />
2,024,016<br />
2,977,138<br />
Asia Pacific<br />
Europe<br />
Americas<br />
MEA<br />
Source: Oxford Economics<br />
Chart 1.5 shows <strong>the</strong> same overnight visitor flows, but for <strong>the</strong> 2023 forecast year.<br />
The Asia Pacific and <strong>the</strong> Middle East and Africa region, despite high growth, will<br />
still retain <strong>the</strong> same regional rankings in 2023.<br />
Examining airline travel between regions gives fur<strong>the</strong>r insights into passenger<br />
flows. Table 1.2 below shows <strong>the</strong> growth in origin and destination passenger<br />
traffic between world regions 3 for <strong>the</strong> past few years, sorted by <strong>the</strong> highest<br />
annual percent change for <strong>the</strong> year 2013.<br />
3 Connecting passengers are assigned to <strong>the</strong> points <strong>of</strong> <strong>the</strong>ir origin and destination, not to <strong>the</strong> point(s)<br />
<strong>of</strong> transfer.<br />
8