implementing value analysis in designing of single roll crusher
implementing value analysis in designing of single roll crusher
implementing value analysis in designing of single roll crusher

You also want an ePaper? Increase the reach of your titles
YUMPU automatically turns print PDFs into web optimized ePapers that Google loves.
BRAMAT<br />
2011<br />
7 th International Conference on Materials Science and Eng<strong>in</strong>eer<strong>in</strong>g – BRAMAT 2011<br />
Braşov, 24 – 26 February 2011<br />
IMPLEMENTING VALUE ANALYSIS IN DESIGNING<br />
OF SINGLE ROLL CRUSHER<br />
Flor<strong>in</strong> CHICHERNEA<br />
Transilvania University <strong>of</strong> Brasov, Romania<br />
Abstract: Implementation <strong>of</strong> Value Analysis <strong>in</strong> design<strong>in</strong>g <strong>of</strong> <strong>in</strong>dustrial equipment is a demonstrated need for a long<br />
time <strong>in</strong> highly developed <strong>in</strong>dustries. Beneficial results <strong>of</strong> apply<strong>in</strong>g this creative, functional and very practical<br />
multidiscipl<strong>in</strong>ary approach can see at all the products that surround us <strong>in</strong> everyday life.<br />
The paper presents a complete study <strong>of</strong> Value Analysis applied concretely to a selected part <strong>of</strong> one s<strong>in</strong>gle <strong>roll</strong><br />
<strong>crusher</strong>. The phases and iterative operation <strong>of</strong> the Value Analysis method are presented.<br />
Keywords: <strong>value</strong> <strong>analysis</strong>, optimum variant, s<strong>in</strong>gle <strong>roll</strong> <strong>crusher</strong><br />
1. Value <strong>analysis</strong> applied to the design <strong>of</strong> a<br />
s<strong>in</strong>gle <strong>roll</strong> <strong>crusher</strong><br />
Value Analysis is a method that provides an<br />
operat<strong>in</strong>g technique us<strong>in</strong>g a creative and organized<br />
approach. It is managed by a group, each <strong>of</strong> them<br />
selected by their expertise <strong>in</strong> specific subjects and<br />
coord<strong>in</strong>ated by a Value Analysis expert.<br />
The paper presents a complete study <strong>of</strong> Value<br />
Analysis applied specifically to one equipment, a<br />
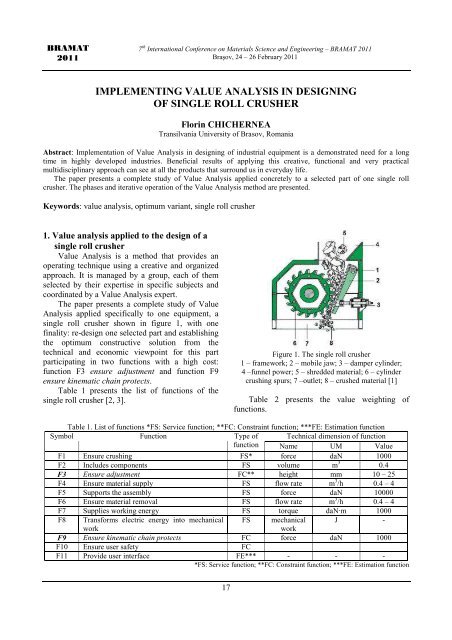
s<strong>in</strong>gle <strong>roll</strong> <strong>crusher</strong> shown <strong>in</strong> figure 1, with one<br />
f<strong>in</strong>ality: re-design one selected part and establish<strong>in</strong>g<br />
the optimum constructive solution from the<br />
technical and economic viewpo<strong>in</strong>t for this part<br />
participat<strong>in</strong>g <strong>in</strong> two functions with a high cost:<br />
function F3 ensure adjustment and function F9<br />
ensure k<strong>in</strong>ematic cha<strong>in</strong> protects.<br />
Table 1 presents the list <strong>of</strong> functions <strong>of</strong> the<br />
s<strong>in</strong>gle <strong>roll</strong> <strong>crusher</strong> [2, 3].<br />
Figure 1. The s<strong>in</strong>gle <strong>roll</strong> <strong>crusher</strong><br />
1 – framework; 2 – mobile jaw; 3 – damper cyl<strong>in</strong>der;<br />
4 –funnel power; 5 – shredded material; 6 – cyl<strong>in</strong>der<br />
crush<strong>in</strong>g spurs; 7 –outlet; 8 – crushed material [1]<br />
Table 2 presents the <strong>value</strong> weight<strong>in</strong>g <strong>of</strong><br />
functions.<br />
Table 1. List <strong>of</strong> functions *FS: Service function; **FC: Constra<strong>in</strong>t function; ***FE: Estimation function<br />
Symbol Function Type <strong>of</strong> Technical dimension <strong>of</strong> function<br />
function Name UM Value<br />
F1 Ensure crush<strong>in</strong>g FS* force daN 1000<br />
F2 Includes components FS volume m 3 0.4<br />
F3 Ensure adjustment FC** height mm 10 – 25<br />
F4 Ensure material supply FS flow rate m 3 /h 0.4 – 4<br />
F5 Supports the assembly FS force daN 10000<br />
F6 Ensure material removal FS flow rate m 3 /h 0.4 – 4<br />
F7 Supplies work<strong>in</strong>g energy FS torque daN·m 1000<br />
F8 Transforms electric energy <strong>in</strong>to mechanical FS mechanical J -<br />
work<br />
work<br />
F9 Ensure k<strong>in</strong>ematic cha<strong>in</strong> protects FC force daN 1000<br />
F10 Ensure user safety FC<br />
F11 Provide user <strong>in</strong>terface FE*** - - -<br />
*FS: Service function; **FC: Constra<strong>in</strong>t function; ***FE: Estimation function<br />
17
The percentages <strong>of</strong> <strong>value</strong> weight<strong>in</strong>g <strong>of</strong><br />
functions are presented <strong>in</strong> the last row <strong>of</strong> the table 2<br />
RECENT, Vol. 12, no. 1(31), March, 2011<br />
and the product <strong>value</strong> is equal to the sum <strong>of</strong> the<br />
functions levels and is equal to 66.<br />
Table 2. Value weight<strong>in</strong>g <strong>of</strong> the functions (* - X coord<strong>in</strong>ate). Step 1<br />
Functions F1 F2 F3 F4 F5 F6 F7 F8 F9 F10 F11 Total<br />
No. <strong>of</strong> po<strong>in</strong>ts 11 10 9 8 7 6 5 4 3 2 1 66<br />
Ratio 0.16 0.15 0.13 0.12 0.10 0.09 0.07 0.061 0.045 0.03 0.015 1<br />
*Percentage % 16.7 15.2 13.6 12.1 10.6 9.09 7.58 6.06 4.55 3.03 1.52 100<br />
2. Economic dimension<strong>in</strong>g <strong>of</strong> the functions –<br />
step I<br />
The cost <strong>of</strong> physical components <strong>of</strong> the s<strong>in</strong>gle<br />
<strong>roll</strong> <strong>crusher</strong> is supplied to the function or functions<br />
which take part, shown <strong>in</strong> table 3, the functions –<br />
costs matrix. The costs are approximated <strong>in</strong> the first<br />
step for the constructive variant presented <strong>in</strong> figure 1.<br />
The percentages <strong>of</strong> the cost weight<strong>in</strong>g <strong>of</strong><br />
functions are presented <strong>in</strong> the last row <strong>of</strong> the table 3.<br />
3. Diagrams<br />
The percentage <strong>value</strong>s <strong>of</strong> the <strong>value</strong> and cost<br />
weight<strong>in</strong>g <strong>of</strong> functions from the last row <strong>of</strong> tables 2<br />
and 3 are <strong>in</strong>troduced <strong>in</strong> table 4, where calculations<br />
are made us<strong>in</strong>g the method <strong>of</strong> least squares (MLS).<br />
The parameters have the follow<strong>in</strong>g computed<br />
<strong>value</strong>s: a = 0.97, α = 44 o , S = 24.8 and S' = 0. Based<br />
on the <strong>value</strong>s for coord<strong>in</strong>ates x i and y i presented <strong>in</strong><br />
table 4 the diagrams <strong>of</strong> figures 2, 3 and 4 are<br />
draw<strong>in</strong>g.<br />
Table 3. The functions – costs matrix. (*Y coord<strong>in</strong>ate, ** monetary units). Step 1<br />
Functions<br />
Cost<br />
No. Parts F1 F2 F3 F4 F5 F6 F7 F8 F9 F10 F11 part**<br />
1 Framework 10 235 5 50 20 50 75 25 470<br />
2 Mobile jaw 500 250 10 30 20 30 840<br />
3 Damper cyl<strong>in</strong>der 20 200 10 10 20 20 280<br />
... ... 300 560 405 500 450 345 455 390 340 105 25 3875<br />
Totalcost 830 795 860 550 470 415 455 390 380 220 100 5465<br />
Ratio 0,15 0.145 0.157 0.101 0.086 0.076 0.083 0.071 0.069 0.04 0.018 1<br />
Cost <strong>of</strong> functions % 15,2 14.5 15.7 10.1 8.6 7.59 8.33 7.14 6.95 4.03 1.83 100<br />
Table 4. Computational elements for plott<strong>in</strong>g the diagrams. Step 1. *S = Σ(Y i - a×X i ) 2 ; **S'=Σ(2×a× (X i ) 2 – 2×X i ×Y i )<br />
Functions<br />
Total<br />
No. MLS F1 F2 F3 F4 F5 F6 F7 F8 F9 F10 F11 <strong>value</strong><br />
1 X i 16.7 15.2 13.6 12.1 10.6 9.09 7.58 6.06 4.55 3.03 1.52 100<br />
2 Y i 15.2 14.5 15.7 10.1 8.6 7.59 8.33 7.14 6.95 4.03 1.83 100<br />
3 (X i ) 2 277.8 229.6 186 146.9 112.5 82.64 57.39 36.73 20.66 9.182 2.296 1162<br />
4 X i ×Y i 253.1 220.4 214.6 122 91.21 69.03 63.07 43.25 31.60 12.19 2.772 1123<br />
5 S* 0.863 0.011 6.504 2.746 2.741 1.433 1.000 1.627 6.543 1.19 0.133 24.8<br />
6 S'** 30.96 3.156 -69.5 40.17 35.12 21.76 -15.1 -15.4 -23.2 -6.63 -1.10 0<br />
The diagram <strong>of</strong> the <strong>value</strong> weight<strong>in</strong>g <strong>of</strong><br />
functions (figure 2), show<strong>in</strong>g the rank<strong>in</strong>g <strong>of</strong> the<br />
functions by their <strong>value</strong>, the diagram <strong>of</strong> the cost<br />
weight<strong>in</strong>g <strong>of</strong> functions (figure 3), show<strong>in</strong>g the<br />
rank<strong>in</strong>g <strong>of</strong> the functions by their functional cost and<br />
the diagram <strong>of</strong> the <strong>value</strong> and cost weight<strong>in</strong>g <strong>of</strong><br />
functions (figure 4), show<strong>in</strong>g the comparison<br />
between the percentages <strong>of</strong> <strong>value</strong> and cost<br />
weight<strong>in</strong>g <strong>of</strong> functions. This diagram is the most<br />
important part, is actually one modell<strong>in</strong>g <strong>of</strong> the<br />
Value Analysis approach applied to optimize the<br />
s<strong>in</strong>gle <strong>roll</strong> <strong>crusher</strong> <strong>of</strong> economically and technically<br />
viewpo<strong>in</strong>t.<br />
The diagram <strong>of</strong> figure 3 reveals a Pareto type<br />
distribution, mean<strong>in</strong>g that 20 - 30% <strong>of</strong> the total<br />
number <strong>of</strong> functions <strong>in</strong>cludes 70 - 80% <strong>of</strong> the total<br />
costs <strong>of</strong> the functions. These functions are F1, F2,<br />
F3 and F4 [4].<br />
The real situation is represented by the shape <strong>of</strong><br />
the straight l<strong>in</strong>e <strong>in</strong> figure 4, plotted by means <strong>of</strong> the<br />
smallest squares method and show<strong>in</strong>g<br />
disproportions <strong>in</strong> the distribution <strong>of</strong> costs and <strong>in</strong> the<br />
contribution <strong>of</strong> the functions to the <strong>value</strong> <strong>of</strong> the<br />
s<strong>in</strong>gle <strong>roll</strong> <strong>crusher</strong>.<br />
An <strong>analysis</strong> <strong>of</strong> the diagram <strong>of</strong> figure 4 show<strong>in</strong>g<br />
that the functions F9, F7 and F3 are located above<br />
the regression l<strong>in</strong>e, <strong>in</strong>dicat<strong>in</strong>g high costs, not<br />
justifiable <strong>in</strong> relation to the <strong>value</strong>.<br />
18
RECENT, Vol. 12, no. 1(31), March, 2011<br />
This study will be made only for two functions:<br />
F3 ensure adjustment and F9 ensure k<strong>in</strong>ematic<br />
cha<strong>in</strong> protects. The number <strong>of</strong> variants that can<br />
design with the technical solutions <strong>of</strong> this<br />
morphology, for these two functions is F3 i × F9 i =<br />
180.<br />
For these two functions, structural variants are<br />
still <strong>in</strong> large numbers, to f<strong>in</strong>d new technical<br />
solutions, can use several methods <strong>of</strong> sort<strong>in</strong>g one<br />
new technical variant like: screen<strong>in</strong>g matrix,<br />
morphological <strong>analysis</strong> through sequence,<br />
morphological <strong>analysis</strong> by list<strong>in</strong>g ordered,<br />
morphological <strong>analysis</strong> by sampl<strong>in</strong>g, exam<strong>in</strong>ed<br />
criteria, multi-criteria <strong>analysis</strong>.<br />
An <strong>analysis</strong> from the technical and economic<br />
viewpo<strong>in</strong>t will be carried out <strong>in</strong> order to select a<br />
technically optimum variant for one <strong>of</strong> the<br />
mechanism: the mechanism to adjust the jaw<br />
open<strong>in</strong>g and for k<strong>in</strong>ematic cha<strong>in</strong> protection.<br />
Figure 2. Diagram <strong>of</strong> the <strong>value</strong> weight<strong>in</strong>g <strong>of</strong> functions.<br />
Step 1<br />
Figure 4. Value and cost weight<strong>in</strong>gs <strong>of</strong> functions. Step 1<br />
Figure 3. Diagram <strong>of</strong> the cost weight<strong>in</strong>g <strong>of</strong> functions.<br />
Step 1<br />
To reduce the cost <strong>of</strong> the functions F9, F7 and<br />
F3 will be used <strong>in</strong> phase 3 <strong>of</strong> the Value Analysis<br />
study (phase <strong>of</strong> creativity, the search the ideas and<br />
the solutions) the morphological <strong>analysis</strong> presented<br />
<strong>in</strong> table 5.<br />
4. The <strong>analysis</strong> <strong>of</strong> the constructive variants<br />
The <strong>analysis</strong> <strong>of</strong> the constructive variants for the<br />
mechanism to adjust the jaw open<strong>in</strong>g and for<br />
k<strong>in</strong>ematic cha<strong>in</strong> protection is presented on.<br />
Table 6 presents the denot<strong>in</strong>g by 9 assessment<br />
criteria <strong>of</strong> the analyzed constructive variants <strong>of</strong> the<br />
mechanism to adjust the jaw open<strong>in</strong>g and for<br />
k<strong>in</strong>ematic cha<strong>in</strong> protection.<br />
19
RECENT, Vol. 12, no. 1(31), March, 2011<br />
Functions<br />
F3 – Ensure adjustment<br />
F9 – Ensure k<strong>in</strong>ematic<br />
cha<strong>in</strong> protects<br />
Table 5. Morphological <strong>analysis</strong><br />
Possible variants<br />
F3 1 – manual adjust<strong>in</strong>g leverage,<br />
F3 2 – manual adjust<strong>in</strong>g with screw mechanism,<br />
F3 3 – manual adjust<strong>in</strong>g with screw mechanism and metal spr<strong>in</strong>g,<br />
F3 4 – spatial cam mechanism with manual adjustment,<br />
F3 5 – spatial cam mechanism with pneumatic adjustment,<br />
F3 6 – spatial cam mechanism with hydraulic adjustment,<br />
F3 7 – manual adjust<strong>in</strong>g with vertical wedge and screw mechanism,<br />
F3 8 – manual adjustment with horizontal wedge and right-left screw,<br />
F3 9 – adjustment with pneumatic/ hydraulic cyl<strong>in</strong>der,<br />
F3 11 – adjustment with hydraulic plunger,<br />
F3 12 – pneumatic adjust<strong>in</strong>g leverage,<br />
F3 13 – hydraulic adjust<strong>in</strong>g leverage,<br />
F3 14 – manual adjust<strong>in</strong>g with gear and rack,<br />
F3 15 – pneumatic/ hydraulic adjust<strong>in</strong>g with gear and rack,<br />
F3 17 – comb<strong>in</strong>ed adjustment,<br />
F3 18 – adjustment with hydraulic jaw toggle, USA Patent no.4,927,089<br />
F3 19 – adjustment with rigid lever<br />
F9 1 – protection with levers and flexible elements, rubber,<br />
F9 2 – protection with levers and flexible elements, metal spr<strong>in</strong>g,<br />
F9 3 – protection with pneumatic cyl<strong>in</strong>der,<br />
F9 4 – protection with hydraulic cyl<strong>in</strong>der,<br />
F9 5 – comb<strong>in</strong>ed protection,<br />
F9 6 – protection with hydraulic jaw toggle, USA Patent no.4,927,089,<br />
F9 7 – protection with screw and metal spr<strong>in</strong>g,<br />
F9 8 – without protection,<br />
F9 9 – protective elastic membrane chamber<br />
Table 6. Synthetic table with the analyzed constructive variants<br />
Type <strong>of</strong> mechanism<br />
No. Analysis criteria *F3 10 + F9 4 **F3 3 + F9 7 ***F3 1 + F9 9<br />
1 Functional characteristics 3 3 3<br />
2 Mount<strong>in</strong>g 3 3 2<br />
3 Repair 1 3 2<br />
4 Rigidity 2 2 3<br />
5 Ergonomics 3 2 3<br />
6 Aesthetics 2 2 3<br />
7 Possibilities for adjust<strong>in</strong>g 3 2 3<br />
8 Degree <strong>of</strong> protection 2 2 3<br />
9 Cost 1 3 3<br />
TOTAL 20 22 25<br />
*F3 10 + F9 4 → F3 10 – adjustment with hydraulic cyl<strong>in</strong>der + F9 4 – protection with hydraulic cyl<strong>in</strong>der,<br />
**F3 3 + F9 7 → F3 3 – manual adjust<strong>in</strong>g with screw mechanism and metal spr<strong>in</strong>g + F9 7 – protection with screw and metal<br />
spr<strong>in</strong>g,<br />
***F3 1 + F9 9 → F3 1 – manual adjust<strong>in</strong>g leverage + F9 9 – protective elastic membrane chamber.<br />
5. Economic dimension<strong>in</strong>g <strong>of</strong> the functions –<br />
step II<br />
The score obta<strong>in</strong>ed by the F3 1 + F9 9 variant is<br />
less than the F3 10 + F9 4 and F3 3 + F9 7 variants and<br />
choose the variant F3 1 + F9 9 .<br />
The cost <strong>of</strong> physical components <strong>of</strong> the s<strong>in</strong>gle<br />
<strong>roll</strong> <strong>crusher</strong> is supplied to the function or functions<br />
which take part, shown <strong>in</strong> table 7, the functions –<br />
costs matrix for step 2.<br />
20<br />
By <strong>in</strong>troduc<strong>in</strong>g the new data <strong>in</strong>to table 8 the<br />
diagrams <strong>of</strong> figures 5 and 6 are plotted.<br />
These diagrams will be compared to those <strong>of</strong><br />
figures 3 and 4.<br />
The parameters have the follow<strong>in</strong>g computed<br />
<strong>value</strong>s: a = 0.97, α = 44.2 o , S = 11.5, S' = 0.<br />
It can be noticed that S and S' have smaller<br />
<strong>value</strong>s than <strong>in</strong> the <strong>in</strong>itial variant.<br />
Table 8 provides the necessary <strong>value</strong>s for<br />
plott<strong>in</strong>g the follow<strong>in</strong>g types <strong>of</strong> diagrams:
RECENT, Vol. 12, no. 1(31), March, 2011<br />
- the diagram <strong>of</strong> the <strong>value</strong> weight<strong>in</strong>g <strong>of</strong> the<br />
functions is identical with figure 2; this diagram has<br />
not changes, as the <strong>value</strong> <strong>of</strong> the system and <strong>of</strong> the<br />
functions has rema<strong>in</strong>ed the same;<br />
- the diagram <strong>of</strong> the cost weight<strong>in</strong>g <strong>of</strong> the functions<br />
(figure 5); the diagram <strong>of</strong> figure 5 presents the<br />
functions cost weight<strong>in</strong>g;<br />
- the diagram <strong>of</strong> the <strong>value</strong> and cost weight<strong>in</strong>gs <strong>of</strong><br />
the functions (figure 6); figure 6 presents the <strong>value</strong><br />
and cost weight<strong>in</strong>gs <strong>of</strong> the functions <strong>in</strong> step 2.<br />
Table 7. The functions – costs matrix. (*Y coord<strong>in</strong>ate, ** monetary units). Step 2<br />
Functions<br />
Cost<br />
No. Parts F1 F2 F3 F4 F5 F6 F7 F8 F9 F10 F11 part**<br />
1 Framework 10 235 5 50 20 50 75 25 470<br />
2 Mobile jaw 500 210 10 20 20 30 790<br />
3 Damper cyl<strong>in</strong>der 20 180 10 5 20 20 255<br />
...<br />
300 560 325 500 450 345 455 390 250 105 25 3705<br />
Total cost 830 795 720 550 470 415 455 390 275 220 100 5220<br />
Ratio 0,15 0.152 0.138 0.105 0.09 0.08 0.087 0.075 0.053 0.042 0.019 1<br />
Cost <strong>of</strong> functions % 15,9 15.2 13.8 10.5 9 7.95 8.72 7.47 5.27 4.21 1.92 100<br />
Table 8. Computational elements for plott<strong>in</strong>g the diagrams. Step 2. *S = Σ(Y i - a×X i ) 2 ; **S'=Σ(2×a× (X i ) 2 –2×X i ×Y i )<br />
Functions<br />
Total<br />
No. MLS F1 F2 F3 F4 F5 F6 F7 F8 F9 F10 F11 <strong>value</strong><br />
1 X i 16.7 15.2 13.6 12.1 10.6 9.09 7.58 6.06 4.55 3.03 1.52 100<br />
2 Y i 15.9 15.2 13.8 10.5 9 7.95 8.72 7.47 5.27 4.21 1.92 100<br />
3 (X i ) 2 277.8 229.6 186 146.9 112.5 82.64 57.39 36.73 20.66 9.182 2.296 1162<br />
4 X i *Y i 265 230.8 188.1 127.7 95.5 72.27 66.03 45.28 23.94 12.77 2.903 1130<br />
5 S* 0.1 0.237 0.275 1.582 1.732 0.802 1.809 2.478 0.714 1.602 0.195 11.5<br />
6 S'** 10.55 -14.7 -14.3 30.49 27.92 16.28 -20.3 -19.0 -7.68 -7.67 -1.33 0<br />
b. F9 from 6.97 %, <strong>in</strong> first step <strong>of</strong> Value Analysis<br />
study (figure 3) to 5.27 % <strong>in</strong> second step <strong>of</strong> Value<br />
Analysis study (figure 5) [5, 6].<br />
Figure 5. Diagram <strong>of</strong> the cost weight<strong>in</strong>g <strong>of</strong> functions <strong>in</strong><br />
step 2<br />
In this diagram is observed the cost <strong>of</strong><br />
functions <strong>in</strong> step II <strong>of</strong> Value Analysis study.<br />
a. F3 from 15.74 %, <strong>in</strong> first step <strong>of</strong> Value Analysis<br />
study (figure 3) to 13.79 % <strong>in</strong> second step <strong>of</strong><br />
Value Analysis study (figure 5),<br />
Figure 6. Value and cost weight<strong>in</strong>gs <strong>of</strong> functions <strong>in</strong> step 2.<br />
At the moment, <strong>in</strong> the second step the<br />
calculation shall be made as fallows:<br />
- others functions can bee situated above the<br />
regression straight l<strong>in</strong>e,<br />
21
RECENT, Vol. 12, no. 1(31), March, 2011<br />
- these are analyzed and their costs reduced, then<br />
the regression l<strong>in</strong>e is re-plotted and the functions<br />
relocated above it are noted; these functions too<br />
are analyzed <strong>in</strong> view <strong>of</strong> reduc<strong>in</strong>g their costs,<br />
followed by the re-plott<strong>in</strong>g <strong>of</strong> the regression l<strong>in</strong>e,<br />
… etc., etc.<br />
Hence the constructive solution is improved<br />
from one iteration to the other.<br />
6. Conclusions<br />
In two steps <strong>of</strong> Value Analysis study one<br />
mechanism <strong>of</strong> s<strong>in</strong>gle <strong>roll</strong> <strong>crusher</strong> who contributes at<br />
the function F3 (supports the assembly) and at the<br />
function F9 (Ensure k<strong>in</strong>ematic cha<strong>in</strong> protects), was<br />
redesign and optimized:<br />
1. from eng<strong>in</strong>eer<strong>in</strong>g viewpo<strong>in</strong>t: from variant *F3 10 +<br />
F9 4 → F3 10 – adjustment with hydraulic cyl<strong>in</strong>der +<br />
F9 4 – protection with hydraulic cyl<strong>in</strong>der, to the<br />
variant **F3 3 + F9 7 → F3 3 – manual adjust<strong>in</strong>g with<br />
screw mechanism and metal spr<strong>in</strong>g + F9 7 –<br />
protection with screw and metal spr<strong>in</strong>g,<br />
and f<strong>in</strong>ally to the variant ***F3 1 + F9 9 → F3 1 –<br />
manual adjust<strong>in</strong>g leverage + F9 9 – protective elastic<br />
membrane chamber.<br />
2. from the economic viewpo<strong>in</strong>t (figure 7):<br />
a. the cost <strong>of</strong> function F3 decrease from 15.74 %,<br />
<strong>in</strong> the first step <strong>of</strong> Value Analysis study to 13.79<br />
% <strong>in</strong> the second step <strong>of</strong> Value Analysis study<br />
(decrease with 14.1%).<br />
b. the cost <strong>of</strong> function F9 decrease from 6.95 %, <strong>in</strong><br />
the first step <strong>of</strong> Value Analysis study to 5.27%<br />
<strong>in</strong> the second step <strong>of</strong> Value Analysis study<br />
(decrease with 32%).<br />
3. <strong>in</strong> the third step <strong>of</strong> Value Analysis study are<br />
analyzed other functions above the regression<br />
straight l<strong>in</strong>e and their costs reduced, then the<br />
regression l<strong>in</strong>e is re-plotted and the functions<br />
relocated above it are noted; these functions too are<br />
analyzed <strong>in</strong> view <strong>of</strong> reduc<strong>in</strong>g their costs, followed<br />
by the re-plott<strong>in</strong>g <strong>of</strong> the regression l<strong>in</strong>e, etc. etc.<br />
4. <strong>in</strong> the third step <strong>of</strong> Value Analysis study are<br />
analyzed other functions above the regression<br />
straight l<strong>in</strong>e and their costs reduced, then the<br />
regression l<strong>in</strong>e is re-plotted and the functions<br />
relocated above it are noted; these functions too are<br />
analyzed <strong>in</strong> view <strong>of</strong> reduc<strong>in</strong>g their costs, followed<br />
by the re-plott<strong>in</strong>g <strong>of</strong> the regression l<strong>in</strong>e, etc. etc.<br />
At the end <strong>of</strong> the Value Analysis study the<br />
po<strong>in</strong>ts are aligned as perfectly as possible along the<br />
straight l<strong>in</strong>e y = a × x, with a tilt <strong>of</strong> 45 o , this is the<br />
optimal situation, the <strong>value</strong>s weight<strong>in</strong>g <strong>of</strong> functions<br />
and the functions cost weight<strong>in</strong>g are equal, the f<strong>in</strong>al<br />
<strong>in</strong>terest <strong>in</strong> Value Analysis study.<br />
References<br />
1. *** (2011) Aubema Company documentation<br />
2. Bejan, V. (1991) Technology, manufacture and repair <strong>of</strong><br />
technological equipment, vol.I and II, OID ICM,<br />
Bucharest, Romania<br />
3. Michel, J. (2001) Management par la Valeur, création de<br />
Valeur, chaîne de Valeur, ... Parle-t-on de la même<br />
Valeur - Proposition d'un cadre conceptuel pour la<br />
valeur généralisée et contribution au développement de la<br />
Valorique. La Valeur, no. 90, p 2-7, Available from<br />
http://michel.jean.free.fr/public/ JM338.html<br />
4. Brun, G., Constant<strong>in</strong>eau, F. (2001) La management par la<br />
valeur: Un nouveau style de management. AFNOR<br />
Pratique, Paris, ISBN 2-12-465051-3<br />
5. Miles, L.D. (1989) Techniques <strong>of</strong> Value Analysis and<br />
Eng<strong>in</strong>eer<strong>in</strong>g. Available from: http://wendt.library.wisc.edu/<br />
miles /milesbook.html, Accessed: 07/01/2011<br />
6. Kenneth, C. (2002) Value Analysis and function <strong>analysis</strong><br />
system technique. Available from: http://www.npdsolutions.com/va.html,<br />
Accessed: 07/01/2011<br />
Figure 7. Value Analysis from economic viewpo<strong>in</strong>t<br />
22