habitat suitability index models: eastern wild turkey - USGS National ...
habitat suitability index models: eastern wild turkey - USGS National ...
habitat suitability index models: eastern wild turkey - USGS National ...
You also want an ePaper? Increase the reach of your titles
YUMPU automatically turns print PDFs into web optimized ePapers that Google loves.
BIOLOGICAL REPORT 82(10.106)<br />
AUGUST 1985<br />
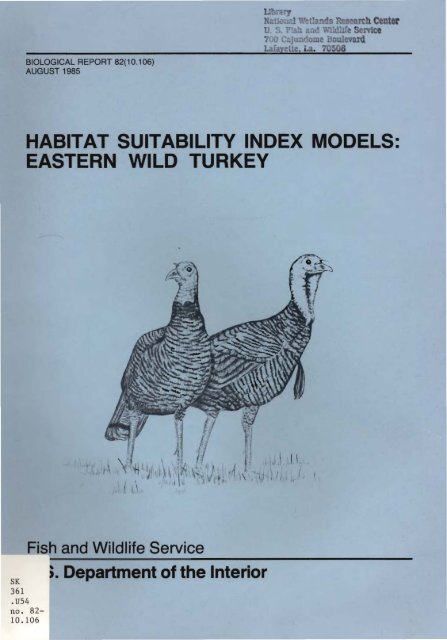
HABITAT SUITABILITY INDEX MODELS:<br />
EASTERN WILD TURKEY<br />
.. ,\ .<br />
I.\<br />
SK<br />
361<br />
. U54<br />
no . 82<br />
10 .106<br />
Fish and Wildlife Service<br />
). Department of the Interior
This is one of the first reports to be published in the new "Biological<br />
Report" series. This technical report series, published by the Research<br />
and Development branch of the U.S. Fish and Wildlife Service, replaces<br />
the "FWS/OBS" series published from 1976 to September 1984. The Biological<br />
Report series is designed for the rapid publication of reports with<br />
an application orientation, and it continues the focus of the FWS/OBS<br />
series on resource management issues and fish and <strong>wild</strong>life needs.
MODEL EVALUATION FORM<br />
Habitat <strong>models</strong> are designed for a wide variety of planning applications<br />
where <strong>habitat</strong> information is an important consideration in the<br />
decision process. However, it is impossible to develop a model that<br />
performs equally well in all situations. Assistance from users and<br />
researchers is an important part of the mode 1 improvement process. Each<br />
model is published individually to facilitate updating and reprinting as<br />
new information becomes available. User feedback on model performance<br />
will assist in improving <strong>habitat</strong> <strong>models</strong> for future applications. Please<br />
complete this form following application or review of the model. Feel<br />
free to include additional information that may be of use to either a<br />
model developer or model user. We also would appreciate information on<br />
model testing, modification, and application, as well as copies of modified<br />
<strong>models</strong> or test results. Please return this form to:<br />
Habitat Evaluation Procedures Group<br />
U.S. Fish and Wildlife Service<br />
2627 Redwing Road, Creekside One<br />
Fort Collins, CO 80526-2899<br />
Thank you for your assistance.<br />
Speci es<br />
Geographic<br />
Location<br />
Habitat or Cover Type(s)<br />
Type of Application: Impact Analysis Management Action Analysis<br />
Baseline Other -------------------------<br />
Variables Measured or Evaluated<br />
Was the species information useful and accurate Yes No<br />
If not, what corrections or improvements are needed -----------
Were the variables and curves clearly defined and useful Yes<br />
No<br />
If not, how were or could they be improved<br />
Were the techniques suggested for collection of field data:<br />
Appropriate Yes No<br />
Clearly defined Yes No<br />
Easily applied Yes No<br />
If not, what other data collection techniques are needed<br />
Were the model equations logical Yes No<br />
Appropriate Yes No<br />
How were or could they be improved<br />
Other suggestions for modification or improvement (attach curves,<br />
equations, graphs, or other appropriate information)<br />
Additional<br />
references or information that should be included in the model:<br />
Model Evaluator or Reviewer Date<br />
------------<br />
Agency<br />
_<br />
Address<br />
Telephone Number<br />
Comm: -----------<br />
FTS
Biological Report 82(10.106)<br />
August 1985<br />
HABITAT SUITABILITY INDEX MODELS:<br />
EASTERN WILD TURKEY<br />
by<br />
Richard L. Schroeder<br />
Habitat Evaluation Procedures Group<br />
Western Energy and Land Use Team<br />
U.S. Fish and Wildlife Service<br />
Drake Creekside Building One<br />
2627 Redwing Road<br />
Fort Collins, CO 80526-2899<br />
Western Energy and Land Use Team<br />
Division of Biological Services<br />
Research and Development<br />
Fish and Wildlife Service<br />
U.S. Department of the Interior<br />
Washington, DC 20240
This report should be cited as:<br />
Schroeder, R. L. 1985. Habitat <strong>suitability</strong> <strong>index</strong> <strong>models</strong>: Eastern <strong>wild</strong><br />
<strong>turkey</strong>. U.S. Fish Wildl. Servo Biol. Rep. 82(10.106). 33 pp.
PREFACE<br />
This document is part of the Habitat Suitability Index (HSI) Model Series<br />
[Biological Report 82(10)J which provides <strong>habitat</strong> information useful for impact<br />
assessment and habi tat management. Several types of <strong>habitat</strong> i nformati on are<br />
provided. The Habitat Use Information Section is largely constrained to those<br />
data that can be used to derive quantitative relationships between key environmental<br />
variables and <strong>habitat</strong> <strong>suitability</strong>. This information provides the<br />
foundat i on for the HSI model and may be useful in the development of other<br />
<strong>models</strong> more appropriate to specific assessment or evaluation needs.<br />
The HSI Model Section documents the <strong>habitat</strong> model and includes information<br />
pertinent to its application. The model synthesizes the <strong>habitat</strong> use information<br />
into a framework. appropriate for field application and is scaled to<br />
produce an <strong>index</strong> value between 0.0 (unsuitable <strong>habitat</strong>) and 1.0 (optimum<br />
<strong>habitat</strong>). The HSI Model Section includes information about the geographic<br />
range and seasonal application of the model, its current verification status,<br />
and a list of the model variables with recommended measurement techniques for<br />
each variable.<br />
The model is a formalized synthesis of biological and <strong>habitat</strong> information<br />
published in the scientific literature and may include unpublished information<br />
reflecting the opinions of identified experts. Habitat information about<br />
<strong>wild</strong>l ife species frequently is represented by scattered data sets collected<br />
during different seasons and years and from different sites throughout the<br />
range of a speci es , The model presents thi s broad data base ina formal,<br />
logical, and simplified manner. The assumptions necessary for organizing and<br />
synthesi zi ng the speci es-<strong>habitat</strong> i nformation into the model are di scussed.<br />
The model shoul d be regarded as a hypothesi s of speci e s-habt tat re 1ati onships<br />
and not as a statement of proven cause and effect re 1ati onshi ps. The mode 1<br />
may have merit in planning <strong>wild</strong>life <strong>habitat</strong> research studies about a species,<br />
as well as in providing an estimate of the relative quality of <strong>habitat</strong> for<br />
that species. User feedback concerning model improvements and other suggestions<br />
that may increase the utility and effectiveness of this <strong>habitat</strong>-based<br />
approach to fish and <strong>wild</strong>life planning are encouraged. Please send suggestions<br />
to:<br />
Habitat Evaluation Procedures Group<br />
Western Energy and Land Use Team<br />
U.S. Fish and Wildlife Service<br />
2627 Redwing Road<br />
Ft. Collins, CO 80526-2899<br />
iii
CONTENTS<br />
Page<br />
PREFACE<br />
ACKNOWLEDGMENTS<br />
iii<br />
vi<br />
HABITAT USE INFORMATION 1<br />
Genera 1 1<br />
Food 1<br />
Water 3<br />
Cover 4<br />
Reproduction 5<br />
Interspersion and Composition..................................... 7<br />
Special Considerations............................................ 8<br />
HABITAT SUITABILITY INDEX (HSI) MODEL.................................. 9<br />
Model Applicability 9<br />
Model Description................................................. 10<br />
Application of the Model.......................................... 23<br />
SOURCES OF OTHER MODELS 28<br />
REFERENCES 28<br />
v
ACKNOWLEDGMENTS<br />
William M. Healy, George A. Hurst, John B. Lewis, Terry W. Little,<br />
Will i am E. Porter, and Dan W. Speake are gratefully acknowl edged for thei r<br />
review of this <strong>habitat</strong> model. The cover of this model was illustrated by<br />
Jennifer Shoemaker. Word processing was provided by Carolyn Gulzow and Dora<br />
Ibarra.<br />
vi
EASTERN WILD TURKEY (Meleagris gallopavo sylvestris)<br />
HABITAT USE INFORMATION<br />
General<br />
Eastern <strong>wild</strong> <strong>turkey</strong>s (Meleagris gallopavo sylvestris) occupy a wide range<br />
of <strong>habitat</strong>s (Dickson et al. 1978; Bailey et al. 1981), with diversified<br />
<strong>habitat</strong>s providing optimum conditions (Bailey and Rinnell 1968; Bailey et al.<br />
1981). Bottomland hardwood forests in association with upland forests, fields,<br />
and pastures is the preferred <strong>turkey</strong> range in the Southeast (G. A. Hurst,<br />
Department of Wildlife and Fisheries, Mississippi State University, Mississippi<br />
State; letter dated December 3, 1984). Clearings and savannas scattered<br />
throughout the forest provide important brood-reari ng, feedi ng, and dusting<br />
sites (Bailey et al. 1981). Preferred <strong>habitat</strong> in forested regions of the<br />
agricultural midwest consists of equal amounts of forest and open pastures or<br />
cropland, with abundant edge between these <strong>habitat</strong>s (Little 1980; W. F. Porter,<br />
College of Environmental Science and Forestry, State University of New York,<br />
Newcomb; letter dated December 18, 1984).<br />
Eastern <strong>wild</strong> <strong>turkey</strong>s are residents in 34 states, from the southern tip of<br />
Maine west to southwestern Minnesota, south through <strong>eastern</strong> Nebraska to east<br />
Texas, and across the southern states, excluding Florida (Bailey 1980).<br />
Food<br />
Eastern <strong>wild</strong> turk.eys are opportunistic omnivores (Bailey and Rinnell<br />
1968) and their diet reflects the types of plant and animal foods that are<br />
available (Dalke et al. 1942). The average annual food intake of the <strong>turkey</strong><br />
consists of 90% plant and 10% animal material (Korschgen 1967). Principal<br />
plant food groups in the diet include mast, fruits, seeds, greens, and agricultural<br />
crops. Analysis of the contents of 524 <strong>turkey</strong> stomachs from Virginia<br />
revealed over 354 species of plants, representing 80 families (Mosby and<br />
Handley 1943). Turkeys also eat a wide variety of animal matter (Korschgen<br />
1967) .<br />
Acorns are an important staple food and comprise an average of 17% of the<br />
year-round diet by volume, and 32% of the fall and winter diet (Korschgen<br />
1967). Acorns were eaten year round in Missouri, with monthly volumes ranging<br />
from a trace in July to 73.3% of the January diet. Acorns comprised one-half<br />
to two-thirds of the fall, winter, and spring foods of the <strong>eastern</strong> <strong>wild</strong> <strong>turkey</strong><br />
in Pennsylvania (Kozicky 1942 cited by Korschgen 1967). A variety of oak<br />
species (Quercus spp.) should be maintained to avoid acorn crop failures, and<br />
to help stabilize both food supplies and <strong>wild</strong>life populations that use acorns<br />
1
(Christisen and Korschgen 1955). Mast failures in Georgia and Alabama did not<br />
affect <strong>turkey</strong> survival due to the general availability of alternate food<br />
sources (Markley 1967). Turkeys in Louisiana had high population densities in<br />
some <strong>habitat</strong>s where oaks were scarce (Dickson et al. 1978). Turkeys in this<br />
area obtained green forage from winter crops or from areas that were burned in<br />
the winter, as well as mast from species other than oaks.<br />
Grass leaves and seeds are important foods and are consumed most<br />
frequently duri ng wi nter and spri ng (Korschgen 1967). Turkeys in Mi ssouri<br />
used a wide variety of foods; optimum management practices provide for establishing<br />
and maintaining diversified <strong>habitat</strong>s within their annual range<br />
(Korschgen 1973). Food produced in forest openi ngs and open woodl ands was<br />
used extensively by <strong>turkey</strong>s. Flowering dogwood (Cornus florida), black gum<br />
(Nyssa syl vati ca), wil d cherry (Prunus serotina), hackberry (Celtis<br />
oCCTdentalis), and similar trees add diversity to the food supply and improve<br />
<strong>turkey</strong> <strong>habitat</strong>.<br />
Food was not believed to be a limiting factor for <strong>turkey</strong>s in West Virginia<br />
(Bailey and Rinnell 1968) or in the Georgia and Alabama portion of their range<br />
(Mark"ley 1967). However, Davis (1976) noted that food can be a limiting<br />
factor in areas with 1arge pure stands of pi ne (Pi nus spp.). I n an Alabama<br />
study area dominated by young pine plantations, food was provided primarily by<br />
other forest types (Kennamer et al. 1980). Food also may be lacking during<br />
winters in the upper Mississippi Valley portion of the <strong>wild</strong> <strong>turkey</strong>'s range<br />
(Porter et al. 1980). Home range size and <strong>habitat</strong> use are influenced by the<br />
available food resources, with winter food needs exerting the greatest impact<br />
(Lewis and Kurzejeski 1984).<br />
The food habits of <strong>eastern</strong> <strong>wild</strong> <strong>turkey</strong>s vary throughout the year (Bailey<br />
and Rinnell 1968). Fruits of virtually all plant species are taken in season.<br />
Spring foods in Missouri were. obtained from the following plant types<br />
(percentages are volume measurements): trees (mostly oaks), 53.6%; farm<br />
crops, 16.6%; forbs, 13.4%; native grasses, 3.9%; shrubs, 3.7%; sedges (Carex<br />
spp.), 3.1%; and vines, 0.8% (Korschgen 1973). Animal foods and plant galls<br />
provi ded the remainder of the spri ng foods. Green herbaceous growth from<br />
wheat (Triticum aestivum), rye (Secale cereale), and alfalfa (Medicago sativa)<br />
was an important spring food source in another Missouri study (Ellis and Lewis<br />
1967). In West Virginia, grass is important all year, but especially in early<br />
spring when <strong>turkey</strong>s apparently subsist on it (Bailey and Rinnell 1968).<br />
Wheat, rye, and other similar green vegetation provides important <strong>turkey</strong><br />
forage in late winter and early spring (Hurst, unpubl.).<br />
Insects are important summer foods for young <strong>turkey</strong> poults (Bailey and<br />
Rinnell 1968; Hurst and Stringer 1975). In Mississippi, poults 3 to 7 days<br />
old consumed 79% animal food and 21% plant food (Hurst and Stringer 1975).<br />
The percentage of animal foods consumed declined steadily as poults got older,<br />
and animal foods accounted for only 13% of the diet at 22 to 38 days of age.<br />
Insects made up over 80% of the animal foods consumed. Summer foods of<br />
juvenile <strong>turkey</strong>s in Alabama included 61.5% grasses (mostly seeds) and 15.5%<br />
grasshoppers (Orthoptera), by volume (Hamri ck and Davi s 1972). Animal foods<br />
were more abundant in forest openings and other areas with abundant herbaceous<br />
growth, than in forested habi tats (Bl ackburn et a 1. 1975; Hurst and Stri nger<br />
1975; Martin and McGinnes 1975). Forest clearings in Virginia contained 25<br />
2
times more insects than were present under the forest canopy, and <strong>turkey</strong><br />
poults needed less time in clearings than in forests to obtain the same<br />
quantity of insects (Martin and McGinnes 1975). Alfalfa fields provided<br />
important feeding <strong>habitat</strong> in Minnesota during the spring and summer (Porter<br />
1978).<br />
Important fall foods of the <strong>wild</strong> <strong>turkey</strong> include crabgrass (Digitaria<br />
sanguinalis), acorns, grass and sedge leaves, tick-trefoil (Desmodium spp.),<br />
and beechnuts (Fagus grandifolia) (Korschgen 1967). Turkeys in Alabama fed in<br />
more open fi e1ds and pastures in the fall, and shi fted to forested habi tats<br />
that supplied acorns and other mast as food became less plentiful towards<br />
winter (Barwick and Speake 1973). Fall range in the mountains of the Southeast<br />
consisted of mast producing hardwood forests (Healy 1981). The value of the<br />
range increased as both the proportion of hardwood forest and the percent in<br />
mast production increased. Trees that may provide fall and winter foods for<br />
the <strong>eastern</strong> <strong>wild</strong> <strong>turkey</strong> include oaks, dogwoods, beech, gums, ash (Fraxinus<br />
spp.), pecans and hickories (Carya spp.), pines, cherries, sumacs (Rhus spp.),<br />
and hawthorn (Crataegus spp.) (Korschgen 1967). ----<br />
Early winter foods in Virginia included grapes (Vitis spp.), acorns, corn<br />
(Zea mays), dogwood fruits, grass blades, and ash seeds (Martin et al. 1939).<br />
Frui t i ng shrubs provi ded over 10% of the wi nter di et of the <strong>eastern</strong> wi 1d<br />
<strong>turkey</strong> (Korschgen 1967). Waste grain was an important winter food in Missouri<br />
(Ellis and Lewis 1967). Turkeys in the Upper Missouri Valley made extensive<br />
use of corn fields located adjacent to hardwood stands (Porter et al. 1980).<br />
Areas 1acki ng corn experi enced a 60% loss of <strong>turkey</strong>s duri ng severe wi nters,<br />
whereas those with available corn had losses of less than 15%. Corn, oats<br />
(Avena sativa), and wheat are the primary cultivated grains consumed by <strong>turkey</strong>s<br />
(Korschgen 1967). Corn is highly digestible, whereas oats are less digestible<br />
by <strong>wild</strong> <strong>turkey</strong>s (Glover and Bailey 1949). Soybeans (Glycine max) are a highly<br />
preferred food in Missouri (J. B. Lewis, Missouri Departmentof Conservation,<br />
Columbia; letter dated November 8, 1984).<br />
Croplands played a major role in maintaining <strong>turkey</strong> populations in<br />
northern Missouri (Lewis and Kurzejeski 1984). Cropfields without adjacent<br />
stands of mature timber were seldom used. Furthermore, regardless of the<br />
amount of adjacent mature timber, croplands were used much less when acorns<br />
were abundant. Thi s suggests that crops may be a secondary food source.<br />
Wi nteri ng <strong>turkey</strong>s in Mi nnesota fed on ei ther acorns in hardwood forests or<br />
corn dependi ng on the abundance of these two major food resources (Porter<br />
1978). Hardwood <strong>habitat</strong>s were important, but agricultural areas provided the<br />
reliable and abundant food supplies needed to maintain <strong>turkey</strong> populations.<br />
Turkeys also eat tubers, bulbs, rhizomes, earthworms, millipedes, spiders,<br />
snails, and salamanders hidden within and below the layer of leaves and organic<br />
matter on the ground (Bailey and Rinnell 1968). These food items are available<br />
year round, except during periods of deep snow or frozen ground.<br />
Water<br />
Water is an essential factor in good <strong>turkey</strong> range. Turkeys in the <strong>eastern</strong><br />
United States can easily obtain water year-round from streams, ponds, seeps,<br />
3
or depressions in the ground (Korschgen 1967). Water was apparently not<br />
required in early brood ranges in the mountains of the Southeast, because hens<br />
and broods could obtain adequate amounts of water from their food (Healy<br />
1981). The presence of a free water source also was not an important factor<br />
in brood <strong>habitat</strong> selection in Minnesota (Porter 1980).<br />
Cover<br />
Wi ld <strong>turkey</strong>s use forested <strong>habitat</strong>s for cover throughout the year, and<br />
spend a large amount of time loafing and feeding in open areas (Porter,<br />
unpub1.). A mi xture of forests and open 1ands may provide habi tat that is<br />
equal or superior to extensive forested areas (Little 1980; Hecklau et al.<br />
1982). Turkeys appear to prefer woodlands that are open and mature (Lindzey<br />
1967; Markley 1967), possibly because such <strong>habitat</strong>s allow the <strong>turkey</strong> to use<br />
its keen eyesight to detect predators and increase its chances for escape and<br />
survival (Lindzey 1967). Dense, brushy areas are used for escape cover, but<br />
such areas are not preferred for normal activities. Favored travel areas in a<br />
Georgia study had scant ground cover and good eye-level visibility (Eichholz<br />
and Marchinton 1976). Areas with dense briars or saplings were not used for<br />
travel. Forested stands composed of one or only a few tree species (especially<br />
conifers) provide poor <strong>turkey</strong> <strong>habitat</strong> (Bailey and Rinnell 1968). Preferred<br />
foraging cover for hens with young consists of fields or open forests where<br />
the herbaceous vegetation is high enough to provide concealment and sparse<br />
enough to allow easy movement.<br />
Ideal <strong>turkey</strong> range in Alabama was described as follows by Davis (1976:22):<br />
lilt is generally agreed that ideal <strong>wild</strong> <strong>turkey</strong> range in Alabama<br />
consists of a minimum of 5,000 acres of a multi-aged, mixed, pinehardwood<br />
forest, interspersed with ample meadow or grassy openings.<br />
Ideal range should also have a relatively open understory, consisting<br />
of shrubs, vines, saplings and small trees, a high percentage<br />
of which are dogwood and other food-producing types such as plums,<br />
mayhaws, and muscadines. Openings may account for as much as 25-30<br />
percent of the total acreage, provided these are several in number<br />
and are well di stributed throughout the forested <strong>habitat</strong>. Ideal<br />
range is well watered with springs, small streams, ponds, or rivers<br />
and consists of the usual mixture of hardwood forest tree species,<br />
including a number of different kinds of oaks ."<br />
Habitats providing poor <strong>turkey</strong> range include large acreages of even-aged,<br />
short rotation pine plantations, intensive agricultural areas (particularly<br />
row crops), and areas with either dense human populations or high levels of<br />
human activity (Davis 1976).<br />
Winter was a time of stress for <strong>wild</strong> <strong>turkey</strong>s in Vermont, and some flocks<br />
that normally wintered in northern hardwoods sought dense conifers during<br />
periods of extreme cold (Bortner and Bennett 1980). Winter roost sites in<br />
Pennsylvania were not different from adjacent forest stands, and forests with<br />
a balance of age classes that provide adequate food would likely provide<br />
adequate winter roost sites (Tzilkowski 1971).<br />
4
Turkeys in south<strong>eastern</strong> Mi nnesota had di ffi cu1 ty movi ng in snow that<br />
exceeded 25.0 cm in depth (Porter 1977), and prolonged periods of deep snow in<br />
this region can be a limiting factor for <strong>turkey</strong>s (Porter et a1. 1980). Severe<br />
wi nter weather with deep snows and a poor food supply caused hi gh wi nter<br />
mortality of <strong>turkey</strong>s in West Virginia (Glover 1948). Although snow may cause<br />
some mortality, the highest <strong>turkey</strong> populations and largest broods in West<br />
Vi rgi ni a often occurred in areas that recei ved the greatest snowfall (Bail ey<br />
and Rinne11 1968). Turkeys in another West Virginia study area tended to seek<br />
areas with the least amount of snow, for ease of feeding (Healy 1977). Feeding<br />
sites in cherry (Prunus spp.)-map1e (Acer spp.) forests were characterized by<br />
seeps, southern exposures, and sawtimber stands with a high proportion of <strong>wild</strong><br />
cherry.<br />
Turkeys in the Upper Mississippi Valley were frequently restricted by<br />
snow in winter to less than 10% of their normal range (Porter et al. 1980).<br />
Spring seeps, important winter food source areas in the <strong>eastern</strong> United States,<br />
are uncommon in the Upper Mississippi Valley and mast production is often<br />
poor. Areas with corn available through winter tended to provide enough high<br />
quality food to mitigate the effects of severe winters.<br />
Turkey dusting sites are frequently in the dry residue of rotted logs, ant<br />
hills, newly tilled soils, or other bare soil areas (Bailey and Rinne11 1968).<br />
Reproduction<br />
Turkeys nest on the ground in areas concealed by fairly dense brush,<br />
vines, deep grass, or fallen tree tops (Williams 1981). Hay fields, fence<br />
rows, and utility rights-of-way provide important nest sites in densely<br />
forested areas. Nests in the Southeast were found mostly in or near openings<br />
(Hillestad 1973; Speake et a1. 1975), and large forested areas lacking openings<br />
provided poor nesting <strong>habitat</strong>s (Davis 1976).<br />
Thirty-seven percent of the nests in an Alabama study were on power line<br />
rights-of-way, although this cover type comprised only 0.6% of the study area<br />
(Everett 1982). Turkeys avoided nesting in the rights-of-way when the average<br />
vegetation height was less than 25.0 cm during the first year these areas were<br />
mowed. Nests were placed in the rights-of-way in the second and third years<br />
after mowing, when the vegetation consisted of mixed herbaceous growth and low<br />
shrubs with heights from 1 to 2 m. Such vegetation conditions were preferred<br />
nest sites wherever they occurred, and provided 73% of all nest sites located<br />
in the study area.<br />
Vegetation around nests in the mountains of the Southeast usually provided<br />
hens with a wide view of the surroundings, yet still provided concealing cover<br />
(Healy 1981). Ground cover less than 25.0 cm tall was usually sparse, while<br />
cover 25.0 to 50.0 cm tall was provided by brush, vines, slash or fallen logs.<br />
Woody understory greater than 50.0 cm tall and 1ess than 2.5 cm dbh was<br />
frequently moderately dense. Preferred foraging cover for hens with young<br />
appears to be that which is tall enough to conceal the young for the six weeks<br />
after hatching, but short enough to allow females enough visibility to detect<br />
distant predators (Porter, unpubl.). Healy (1981) concluded that all common<br />
forest types in the Southeast could provide suitable nesting <strong>habitat</strong>.<br />
5
Striped skunks (Mephitis mephitis), raccoons (Procyon lotor), and opossums<br />
(Didelphis marsupia1is) accounted for approximately two-thirds of nest predation<br />
in Alabama (Davis 1976). Logging, mowing, or haying may cause nest<br />
abandonment, or may cri pp1e or kill the hen. I n another Alabama study,<br />
raccoons, feral dogs, and opossums were the three most significant nest<br />
predators (Speake 1980).<br />
The essential feature of <strong>turkey</strong> brood <strong>habitat</strong> is adequate herbaceous<br />
vegetation (Healy and Nenno 1983), and the lack of high quality brood rearing<br />
<strong>habitat</strong> may be a 1imiting factor for <strong>turkey</strong>s in some areas (Hillestad and<br />
Speake 1970). The presence of high quality brood rearing <strong>habitat</strong> increases<br />
the rate of <strong>turkey</strong> poult survi va1 (Davi s 1976). In an Alabama study area,<br />
only 2% of the forest <strong>habitat</strong> contained openings, and it appeared that this<br />
absence of adequate brood range was a limiting factor for this <strong>turkey</strong> population<br />
(Everett 1982).<br />
Broods in West Virginia preferred forest understories with abundant<br />
herbaceous growth and avoi ded stands with a dense woody understory (Pybus<br />
1977). Broods preferred forests with basal areas between 9 and 18 m 2/ha and<br />
avoided forests with basal areas exceeding 23 m 2/ha (Pack et a1. 1980).<br />
Coniferous forest types received little or no brood use.<br />
Early brood range in the mountainous regions of the Southeast is characteri<br />
zed by abundant, low growi ng herbaceous cover, wi th few overstory trees<br />
(Healy 1981). The biomass of herbaceous vegetation is more important than the<br />
species composition. Sparse herbaceous understories, 9.0 to 23.0 cm tall and<br />
100 to 460 kg/ha dry weight, typi ca1 of many oak forests, di d not provi de<br />
enough seeds or insects for pou1 t feedi ng. Lush orchardgrass (Dactyl i s<br />
glomerata) stands, 78.0 cm tall and 3,380 kg/ha dry weight, provided an<br />
abundance of insects, but were too dense for foraging poults to move through.<br />
Healy (1978) estimated that the best <strong>habitat</strong> for young broods in the<br />
Southeast consisted of a complete cover of forbs and grasses, 40.0 to 70.0 cm<br />
tall, with a biomass of 600 to 3,000 kg/ha dry weight. This vegetation<br />
structure provides food for both hens and poults, cover for poults, and allows<br />
hens to see over the top of the vegetation while remaining concealed. This<br />
type of vegetation is abundant in fields, and also occurs in mesic forests.<br />
Interspersion of trees and openings allows broods to escape predators and to<br />
select a suitable microclimate within a short distance. As an alternative to<br />
biomass measurements, Healy (W. M. Healy, U.S. Forest Service, Ho1dworth Hall,<br />
University of Massachusetts, Amherst; pers. comm.) recommended the following<br />
to describe ideal early brood range: (1) 60 to 100% total vegetative cover<br />
(woody and herbaceous) in the understory; (2) vegetation heights from 20.0 to<br />
60.0 cm; and (3) at least one-half the vegetation comprised of herbaceous<br />
growth.<br />
Forest clearings should be managed for young poults (less than one month<br />
old) due to the poults' high mortality rates, small home ranges, specialized<br />
food habits, and narrow <strong>habitat</strong> requirements compared to older poults and<br />
adults (Healy and Nenno 1983). Brood range for older poults can be provided<br />
by a 1arger vari ety of <strong>habitat</strong> types. 01 der poults can utili ze most forest<br />
openings, including those that were too dense for young poults (Healy 1981).<br />
6
Good brood <strong>habitat</strong> in Mississippi was thought to consist of poorly managed<br />
(unimproved) pastures (Owen 1976 cited by Hurst 1978) which provided an abundance<br />
of insect and plant food, and cover in the form of clumps of woody<br />
vegetation (Hurst 1978). Savannah-like old fields appear to provide better<br />
<strong>habitat</strong> for <strong>turkey</strong> poults than intensively managed agricultural clearings<br />
(Nenno and Lindzey 1979). The benefits of the savannah-like fields include:<br />
(1) an increased vari ety of invertebrate foods; (2) a greater vari ety and<br />
abundance of plant foods; (3) a vegetation structure that allows easier poult<br />
movements; (4) favorable microclimates; (5) increased edge; and (6) protection<br />
provided by the partial canopy cover. Tree canopy cover ranging from 30 to<br />
60% allows for adequate herbaceous growth, and is a preferred brood <strong>habitat</strong>.<br />
Females with broods in Minnesota spent as much as half of their daytime<br />
hours in crop and hay fields (Porter 1978). Corn fields provided loafing and<br />
escape cover for hens, whereas broods spent most of their time in alfalfa<br />
fields.<br />
Reclaimed surface mines in Pennsylvania can provide useful brood <strong>habitat</strong>,<br />
depending on vegetation density and corresponding insect abundance (Anderson<br />
and Samuel 1980). Grain drill planting of cover crops in such areas provided<br />
greater mobility for poults than hydroseeding which resulted in matted vegetation.<br />
Poults used the row spaces in grain drilled areas for stalking invertebrates.<br />
The poults also had less contact with morning dew in these areas,<br />
which reduced the amount of required brood time with the hen.<br />
Interspersion and Composition<br />
An interspersion of grassy, permanent forest openings, along with the<br />
edges they create, enhances brood production of <strong>turkey</strong>s (81 ackburn et a1.<br />
1975). Different authors have reported varying requirements for the percentage<br />
of openings needed for good <strong>wild</strong> <strong>turkey</strong> range. Latham (1958) stated that at<br />
least 10% of the total range should be in openings for satisfactory populations,<br />
and that clearings should be spaced so a hen need not travel more than<br />
1.6 to 3.2 km to find one. Speake et al. (1975) recommended that spring and<br />
summer <strong>turkey</strong> <strong>habitat</strong> in the Southeast should include 12 to 25% of the area in<br />
well-di spersed openi ngs. Poults ina Mi nnesota study area used about 29.0 ha<br />
for a weekly brood range (Porter 1980). Four or five such blocks of optimal<br />
brood <strong>habitat</strong> per 10.0 km", or 1.8 km radius, appeared to satisfy summer<br />
<strong>habitat</strong> needs of broods. This corresponds to a <strong>habitat</strong> with 11.6 to 14.5% of<br />
the area meeting brood needs.<br />
The interspersion of hardwood forests and agricultural lands is an<br />
important feature in providing favorable <strong>turkey</strong> <strong>habitat</strong> in the Upper Midwest<br />
(Porter 1978). Thriving <strong>turkey</strong> populations exist in Missouri in areas of 50%<br />
forest cover, with well-interspersed open land and alternate winter foods for<br />
times of low mast production (Ellis and Lewis 1967). Lewis and Kurzejeski<br />
(1984) suggested that optimal <strong>habitat</strong> in Missouri is approached in areas with<br />
a 50:50 mix of mast-producing forests and open lands. Of the 50% open lands,<br />
they suggested that at least 20% should be row crops, 45% pasture, and 25% old<br />
fields. Recent studies of <strong>turkey</strong>s in Iowa also have suggested that a 50:50<br />
ratio of forests to open lands is better than extensive forests (Little 1980).<br />
7
Iowa has reintroduced <strong>turkey</strong>s into such areas and subsequent population<br />
densities are among the highest reported for the <strong>eastern</strong> <strong>wild</strong> <strong>turkey</strong>. Few<br />
forest stands in these areas exceed 400 ha in size, and most are smaller and<br />
scattered. The area has abundant edge between forest 1ands and crop and<br />
pasturelands, which provides access to insects for broods and waste grain for<br />
winter food. Turkeys also occur on dairy lands in New York where most woodlots<br />
are less than 101 ha in size (Bailey and Rinnell 1968). Turkeys in a Minnesota<br />
study survived and reproduced in areas with as little as 12% forest cover<br />
(Hecklau et al. 1982).<br />
Turkeys did not readily use the centers of 12.2 to 24.3 ha fields in<br />
Tennessee and Michigan, unless a peninsula of trees penetrated the field to<br />
provide travel cover (Lewis 1964). Turkeys in Virginia were not observed in<br />
the interior of a 24.3 ha clearcut, although they did use the edges (Raybourne<br />
1968). Turkeys crossed clearcuts less than 137 to 183 m in width, but only<br />
traveled 46 to 69 minto clearcuts greater than 274 m in width. Clearcuts<br />
greater than 183 m in width may restrict <strong>turkey</strong> movements to the edge of the<br />
area.<br />
The annual and seasonal range sizes of <strong>wild</strong> <strong>turkey</strong>s are related to <strong>habitat</strong><br />
quality (Everett 1982). Turkeys on poor ranges must move greater distances to<br />
meet their needs than <strong>turkey</strong>s on better quality <strong>habitat</strong>. Turkey range sizes<br />
and movements are di ctated by the food supply (Korschgen 1967). The annua1<br />
ranges of males and females in Missouri were 448 ha and 553 ha, respectively<br />
(Ellis and Lewis 1967). In Alabama, male <strong>turkey</strong>s had an annual range of<br />
1,631 ha, and females had an annual range of 1,439 ha (Everett 1982). Average<br />
seasonal range sizes in the Southeast were smallest for hens with broods<br />
(111 ha) and largest for hens in the fall and winter (430 ha) (Speake et al.<br />
1975). Winter ranges of most <strong>turkey</strong>s in a Minnesota study were less than<br />
25 ha due to the restrictions caused by snow cover (Porter 1977). Speake<br />
et al. (1969) estimated that the requirements of a self-sustaining population<br />
of <strong>turkey</strong>s could probably be met in an area of 3,240 to 4,050 ha. Lewis and<br />
Kurzejeski (1984) suggested that a minimum of 750 ha of <strong>habitat</strong> is required in<br />
Missouri to insure high <strong>turkey</strong> population densities. Turkeys were introduced<br />
into Presque Isle State Park in Pennsylvania, which has a high level of human<br />
use (Wunz 1971). Turkeys restri cted thei r movements to 81 ha of very dense<br />
understory. Wunz (1971) concluded that as little as 203 ha may be adequate<br />
for establishing <strong>turkey</strong>s in forested areas with dense human populations.<br />
In New York, hens (older than 1 year) moved an average of 5.5 km from<br />
winter range to nest sites, and an average of 1.9 km from nest sites to broodrearing<br />
areas (Eaton et al. 1976). Large improved pastures, roads, and large<br />
cropland clearings acted as barriers to <strong>turkey</strong> movements in Georgia (Eichholz<br />
and Marchinton 1976).<br />
Special Considerations<br />
Wild <strong>turkey</strong>s have a low tolerance of continuous and varied human activities<br />
(Davis 1976). Turkey populations may decline due to <strong>habitat</strong> losses<br />
associated with urbanization, highway and reservoir construction, expanded row<br />
crop farming, and conversion of large areas to short rotation, even-aged, pure<br />
8
pine plantations. Turkey abundance usually is inversely correlated with human<br />
abundance (Bailey and Rinnell 1968). However, there is a wide variation in<br />
wariness of humans among different <strong>turkey</strong> populations, depending on hunting<br />
pressure and other disturbance level s (Wright and Speake 1975). Humans are<br />
less of a disturbance factor where <strong>turkey</strong> hunting does not occur (Bailey and<br />
Rinnell 1968). Turkey populations in Louisiana were significantly lower in<br />
areas where it was believed that poaching was a problem (Dickson et al. 1978).<br />
Human densities in Minnesota as high as 15 people/km 2 did not appear to affect<br />
survi va1 and reproduction of transplanted <strong>turkey</strong>s duri ng thei r fi rst year<br />
(Hecklau et al. 1982).<br />
Turkeys in a Kentucky study avoided a large area that was used by off-road<br />
vehicles (Wright and Speake 1975). Turkeys also avoided areas within 1,000 m<br />
of a new foot trail which was used by about 125 people/week, whereas similar<br />
adjacent <strong>habitat</strong>s without trails were consistently used by <strong>turkey</strong>s. Areas<br />
within 1,000 m of a campground also were avoided by foraging <strong>turkey</strong>s. Turkeys<br />
tolerated routine agricultural operations and were seen feeding in a large<br />
field where a tractor was working at a distance of 500 m.<br />
Forestry practices exert a strong i nfl uence on <strong>turkey</strong> numbers (Markley<br />
1967). Extensive clear-cutting may make areas unsuitable for <strong>turkey</strong>s. Hardwood<br />
removal and conversion to short rotation pine plantations also have a<br />
negative effect on <strong>turkey</strong>s.<br />
Controlled burning of forests in the Southeast may be used to produce a<br />
greater abundance and diversity of accessible food items (Davis 1976). Burned<br />
tracts of loblolly pine (P. taeda) - shortleaf pine (P. echinata) forest<br />
provided either more insects or more available insects than areas that were<br />
not burned for 4 years (Hurst 1978). Burned areas were more open and allowed<br />
ease of movement for poults. Unburned areas (s 3 years since burning) provided<br />
nest <strong>habitat</strong>, escape, and brood cover, and an abundance of dewberries (Rubus<br />
trivialis). However, both burned and unburned tracts in this forest type were<br />
not as good for brood <strong>habitat</strong> as pastures and fields.<br />
HABITAT SUITABILITY INDEX (HSI) MODEL<br />
Model Applicability<br />
Geographi c area. This model was developed for app1i cati on wi thi n the<br />
entire range of the <strong>eastern</strong> <strong>wild</strong> <strong>turkey</strong>. Current range maps for the <strong>eastern</strong><br />
<strong>wild</strong> <strong>turkey</strong> were not found in the literature. Users near the periphery of the<br />
range of the <strong>eastern</strong> <strong>wild</strong> <strong>turkey</strong> should consult local authorities to confirm<br />
the appropriateness of applying this model.<br />
Season. This model was developed to evaluate the year round <strong>habitat</strong><br />
needs of the <strong>eastern</strong> <strong>wild</strong> <strong>turkey</strong>.<br />
9
Cover types. This model was developed to evaluate <strong>habitat</strong> qual ity in<br />
Deciduous Forested Wetland (DFW), Evergreen Forest (EF), Deciduous Forest<br />
(OF), Evergreen Tree Savanna (ETS), Deci duous Tree Savanna (DTS), Evergreen<br />
Shrubland (ES), Deciduous Shrubland (OS), Evergreen Shrub Savanna (ESS),<br />
Deciduous Shrub Savanna (DSS), Grassland (G), Forbland (F), Pasture and Hayland<br />
(P/H), and Cropland (C) areas (terminology follows that of U.S. Fish and<br />
Wildlife Service 1981).<br />
Minimum <strong>habitat</strong> area. Minimum <strong>habitat</strong> area is defined as the minimum<br />
amount of contiguous <strong>habitat</strong> that is required before a species will occupy an<br />
area. Based on annual range sizes reported in the literature, it is assumed<br />
that a minimum of 900 ha of <strong>habitat</strong> must exi st or the HSI for <strong>eastern</strong> wi ld<br />
<strong>turkey</strong>s will equal zero.<br />
Verification level. This model represents several hypotheses of<br />
species-<strong>habitat</strong> relationships and does not reflect proven cause and effect<br />
relationships. Previous drafts of this model were reviewed by William M.<br />
Healy, U.S. Forest Service, North<strong>eastern</strong> Forest Experiment Station, Amherst,<br />
MA; George A. Hurst, Dept. of Wildlife and Fisheries, Mississippi State<br />
University, Mississippi State; John B. Lewis, Missouri Dept. of Conservation,<br />
Columbia; Terry W. Little, Iowa Conservation Commission, Des Moines; William E.<br />
Porter, State University of New York, Newcomb Campus, Newcomb; and Dan W.<br />
Speake, Alabama Cooperative Wildlife Research Unit, Auburn. Improvements and<br />
modi fi cations suggested by these revi ewers have been incorporated into thi s<br />
model, and are cited as personal communications, where appropriate.<br />
Model Description<br />
Overview. The year-round <strong>habitat</strong> needs of <strong>eastern</strong> wi ld <strong>turkey</strong>s can be<br />
provi ded by a vari ety of di fferent cover types. The summer food and brood<br />
<strong>habitat</strong> requirements are provided in areas containing herbaceous vegetation of<br />
the proper height and density, in proximity to protective woody cover. Such<br />
areas provide abundant insect and plant foods for poults and adequate cover<br />
for hens with poults. Coniferous cover types are generally avoided during the<br />
summer.<br />
Habitats with a variety of food sources provide potentially optimum food<br />
values during fall, winter, and spring. Eastern <strong>wild</strong> <strong>turkey</strong>s prefer areas<br />
with a diversity of food-producing trees and shrubs. Agricultural crops,<br />
especially corn and soybeans, also provide an important winter food source.<br />
The cover needs of the adult <strong>turkey</strong> are provided in mature hardwood<br />
forests with relatively open understories. It is assumed that nest sites will<br />
be present if food and cover are adequate, and that water will not be a limiting<br />
factor due to its widespread availability throughout the range of the<br />
<strong>eastern</strong> <strong>wild</strong> <strong>turkey</strong>. The following sections provide written documentation of<br />
the 1ogi c and assumptions used to interpret the habi tat i nformati on for the<br />
<strong>eastern</strong> <strong>wild</strong> <strong>turkey</strong> in order to explain the variables that are used in the HSI<br />
model. Specifically, these sections identify important <strong>habitat</strong> variables,<br />
describe <strong>suitability</strong> levels of the variables, and describe the relationships<br />
between variables.<br />
10
Summer food/brood <strong>habitat</strong> component. The major summer food and brood<br />
needs are insect food and cover for young poults. It is assumed that summer<br />
food and brood <strong>habitat</strong> needs may be provided in all cover types except evergreen<br />
forests, evergreen shrub1ands, and crop1ands. A measurement of the<br />
structure of herbaceous vegetation is assumed to be an adequate indicator of<br />
the qual ity of insect food and cover resources. The amount of biomass of<br />
herbaceous vegetation is more important than the species composition (Healy<br />
1981). The optimum structure of herbaceous vegetation is assumed to occur<br />
when plant height and density provide the maximum amount of vegetative biomass<br />
(i .e., potential insects) without restricting the movements of young poults.<br />
This level is assumed to occur when the herbaceous canopy cover is between 60<br />
and 80%. Suitability is assumed to decrease to a moderate level in areas with<br />
100% herbaceous cover due to the restrictions in poult movement caused by the<br />
extremely dense cover. It is assumed that areas with less than 20% herbaceous<br />
canopy cover will be too sparse to provide adequate food or cover for poults.<br />
The relationship between herbaceous canopy cover and a <strong>suitability</strong> <strong>index</strong><br />
(SIV1) for the <strong>eastern</strong> <strong>wild</strong> <strong>turkey</strong> is presented in Figure 1a.<br />
Optimum herbaceous canopy height occurs where the vegetation is high<br />
enough to provide concealment for the hen, but low enough to permit the hen to<br />
see the surrounding <strong>habitat</strong>. It is assumed that optimum herbaceous height<br />
occurs between 20.0 and 60.0 cm. Suitability is assumed to decrease to zero<br />
as heights increase to 100.0 cm, due to the inability of hens to view their<br />
surroundi ngs in such areas. Vegetation 1ess than 5 cm is assumed to be too<br />
short to provide cover. The relationship between herbaceous canopy height and<br />
a <strong>suitability</strong> <strong>index</strong> (SIV2) for the <strong>eastern</strong> <strong>wild</strong> <strong>turkey</strong> is presented in<br />
Figure lb.<br />
An <strong>index</strong> for summer food/brood <strong>habitat</strong> <strong>suitability</strong> (FBSI1) is computed by<br />
combining the indices for density and height of herbaceous vegetation (SIV1<br />
and SIV2, respectively). A <strong>habitat</strong> with very low herbaceous heights and a<br />
very sparse canopy cover of herbaceous vegetation would provide more food and<br />
cover for <strong>turkey</strong>s if either the height or density of herbaceous vegetation was<br />
increased to a higher <strong>suitability</strong> level; i.e., there is a compensatory<br />
relationship between the variables. It is further assumed that when herbaceous<br />
height and density are present at the same levels of <strong>suitability</strong>, the<br />
habi tat va1ue for the summer food/brood habi tat component wi 11 be equa1 to<br />
that level of sut t abt l l ty . This relationship applies to specific forest and<br />
tree savanna cover types (OFW, OF, ETS, and OTS) and can be expressed mathematically<br />
as shown in Equation 1.<br />
FBSI1 = (SIV1 x SIV2)1/2<br />
(1)<br />
11
..--l<br />
Fig. 1a<br />
1.0 1.0<br />
::::- ::::-<br />
...... ......<br />
VI 0.8 VI<br />
0.8<br />
N<br />
Fig. 1b<br />
x<br />
0.6<br />
s:::<br />
s:::<br />
...... ......<br />
Q)<br />
Q)<br />
"0 "0<br />
>,<br />
0.4<br />
>,<br />
oj-)<br />
oj-)<br />
...... .....<br />
0.4 -<br />
......<br />
..0 ..0<br />
co 0.2 co 0.2<br />
+-'<br />
......<br />
+-'<br />
.....<br />
~ ~<br />
VI VI<br />
0.0 0.0<br />
0 25 50 75 100 0 50 100+ cm<br />
Percent herbaceous canopy<br />
0 19.7 39.4+ inches<br />
cover<br />
Average height of herbaceous<br />
canopy (summer)<br />
x<br />
0.6<br />
Distance to forest or tree<br />
savanna cover types<br />
Figure 1. The relationships between <strong>habitat</strong> variables used to evaluate<br />
summer food and brood <strong>habitat</strong> and the <strong>suitability</strong> indices for the<br />
variables.<br />
12
The <strong>suitability</strong> of herbaceous vegetation for hens and broods is affected<br />
by the proximity of forest cover that can be used for escape and protection.<br />
It is assumed that escape cover will not be a limiting factor in forested or<br />
tree savanna cover types. I n herbaceous domi nated cover types (e.g., grassland,<br />
forbland, and pasture and hayland), it is assumed that optimum suitabilities<br />
will exist when a tree dominated cover type is within 61 m. It also is<br />
assumed that herbaceous areas more than 122 m from forest cover wi 11 not be<br />
used by <strong>turkey</strong>s. These estimates are based on data from Lewis (1964) and<br />
Raybourne (1968) on <strong>turkey</strong> use of openings. Turkeys will move greater<br />
distances away from forest cover in cover types that provide overhead cover<br />
(Porter, unpubl.). It is assumed that in shrub dominated cover types<br />
(shrublands and shrub savannas) optimum suitabilities will exist when a tree<br />
dominated cover type is within 100 m, and that shrub dominated areas farther<br />
than 400 m from forest cover will be unsuitable. The relationships between<br />
the distances from herbaceous or shrub cover types and a <strong>suitability</strong> <strong>index</strong> are<br />
presented in Figure 1c.<br />
The value of the summer food/brood <strong>habitat</strong> component (FBSI2) in specific<br />
shrub and herbaceous dominated cover types is equal to the value determined<br />
for herbaceous height and density, directly modified by the value related to<br />
the proximity of forest cover. The <strong>suitability</strong> of the herbaceous growth in<br />
such areas will be directlY lowered as the distance to forest cover increases.<br />
Tllfs re!at fonsllfp applies to specific shrub end nerbeceous cover types (aS,<br />
ESS, DSS, G, F, and P/H) and can be expressed mathematically as shown in<br />
Equation 2.<br />
FBSI2 = (SIV1 x SIV2)1/2 x SIV3 ( 2)<br />
Fall/winter/spring food component. Eastern <strong>wild</strong> <strong>turkey</strong>s are omnivorous<br />
opportunists (Bailey and Rinnell 1968) and the best management would provide a<br />
diversity of <strong>habitat</strong>s within their annual range (Korschgen 1973). Fall,<br />
winter, and spring foods are provided in forests, shrublands, and croplands<br />
and include hard mast, seeds, and soft mast produced by trees and shrubs, as<br />
well as agricultural crops, especially corn or soybeans. Acorns are an<br />
important food source in many areas, but are not essential, because other<br />
trees may provide alternate foods. The specific trees used as food sources<br />
will vary across the range of the <strong>eastern</strong> <strong>wild</strong> <strong>turkey</strong>. Food producing species<br />
include, but are not limited to, oaks, dogwoods, beech, gums, ash, pecans,<br />
hickories, pines, <strong>wild</strong> cherry, hackberry, sumac, and hawthorn.<br />
For purposes of this model, hard mast trees are assumed to include species<br />
such as oaks, hickories, pecan, beech, and pine. Soft mast trees include<br />
species such as gums, ash, <strong>wild</strong> cherry, hackberry, sumac, and hawthorn. For<br />
specific applications of this model, it is suggested that users define a list<br />
of both hard and soft mast producing trees for the particular geographic<br />
region of the application.<br />
13
The amount of acorn mast produced in a forest varies from year to year,<br />
from species to species, and from tree to tree of the same species (Shaw<br />
1971). The number of acorns produced per tree increases in a linear relationship<br />
with increased tree diameter (Goodrum et al. 1971; Shaw 1971). Although<br />
acorn production is positively correlated with individual tree diameters,<br />
overall acorn production in forest stands is influenced by canopy conditions<br />
and shading. Shaded trees produce less mast than trees grown in open s~ands.<br />
The exact structural forest conditions that must exist to maximize hard mast<br />
production have not been reported in the literature.<br />
McQuilkin and Musbach (1977) conducted a 14-year study of pin oak (Q.<br />
pa 1ustri s) acorn product i on on both fl ooded and unflooded sites in Mi ssouri .<br />
Their data indicated that mast production on plots with trees mostly 27.9 cm<br />
dbh or larger was 85% higher than on plots with most trees less than 25.4 cm<br />
dbh. On nonflooded plots, which would be most representative of typical<br />
<strong>turkey</strong> <strong>habitat</strong>, there were no statistically significant differences in acorn<br />
production on plots with low, medium, or high stocking rates. Low stocking<br />
rate plots had basal areas of 9.2 m 2/ha, medium plots had basal areas of<br />
13.8 m 2/ha, and high plots had basal areas of 17.2 to 20.7 m 2/ha.<br />
The low stocking rate in McQuilkin and Musbach's (1977) study is about<br />
equal to the lower 1imits of upland hardwood stands that are termed understocked<br />
by the U.S. Forest Service (Gingrich 1971). The stocking chart from<br />
Gingrich (1971:66) was used to estimate the minimum numbers of trees of<br />
specific size classes that are required to reach the lower limit of understocked<br />
stands. It is assumed that forests with tree densities below this<br />
level will show reduced hard mast production. Using the stocking chart, it<br />
can be determi ned that, for 25.4 cm di ameter trees, 235 or more trees per ha<br />
are needed to be at the lower limit of understocked stands. For trees 38.1 cm<br />
in diameter, 124 or more are needed per ha to reach the minimum stocking<br />
level. The relationships between the number of trees of various diameter<br />
classes and <strong>suitability</strong> indices (SIV4) for the <strong>eastern</strong> <strong>wild</strong> <strong>turkey</strong> are shown<br />
in Fi gure 2a. It shoul d be noted that SIV4 is compri sed of two measured<br />
habi tat vari abl es: average dbh of hard mast trees that are greater than<br />
25.4 cm dbh; and number of hard mast trees/ha that are greater than 25.4 cm<br />
dbh.<br />
It is assumed that total forest hard mast production will not increase at<br />
tree densities above those shown as maximum in Figure 2a. This is based on<br />
the assumption that although there wi 11 be more trees in such stands, the<br />
amount of mast produced per tree wi 11 be lower due to shadi ng and, thus,<br />
overall mast production will be the same. This assumption is supported by the<br />
study of McQuilken and Musbach (1977), which showed no difference in acorn<br />
production at low, medium, and high stocking conditions. Although the preceding<br />
mast relationships were developed using data from oaks, it is assumed that<br />
the basic relationships will apply to all trees that produce hard mast.<br />
In general, soft mast produci ng trees begi n to produce mast at small er<br />
tree di ameters than hard mast trees. Therefore, it is assumed that a measure<br />
of dbh is not needed for soft mast trees. A measurement of tree canopy closure<br />
of soft mast trees is assumed to provide an indirect measure of food abundance.<br />
14
Fig. 2a Fig. 2b<br />
A BC 0 E F<br />
1.0 Average DBH<br />
1.0<br />
q- L(")<br />
:><br />
....... A= 38.1+ em<br />
:><br />
.......<br />
V><br />
V><br />
0.8 B= 35.6+ em 0.8<br />
x C= 33.0+ em x<br />
Q)<br />
Q)<br />
"'0<br />
0= 30.5+ em<br />
"'0<br />
I:: 0.6 I::<br />
E= 27.9+ em<br />
0.6<br />
....... .......<br />
>, F= 25.4+ em >,<br />
+J<br />
0.4<br />
+J 0.4<br />
..0 ..0<br />
n:::l<br />
0.2 n:::l 0.2<br />
+J +J<br />
~ ~<br />
V> V><br />
0.0 0.0<br />
0 50 100 150 200 250 0 25 50 75 100<br />
Number of hard mast producing<br />
Percent canopy closure of<br />
trees/ha that are >25.4 em<br />
soft mast producing trees<br />
dbh (average dbh values should<br />
only consider hard mast trees<br />
that are >25.4 em dbh)<br />
Figure 2. The relationship between <strong>habitat</strong> variables used to assess<br />
the fall, winter, and spring food value of trees and <strong>suitability</strong><br />
indices for the <strong>eastern</strong> <strong>wild</strong> <strong>turkey</strong>.<br />
Optimum forested <strong>habitat</strong>s are assumed to contain 40% or greater tree canopy<br />
closure of soft mast producing trees. It is further assumed that overall soft<br />
mast production will not increase as canopy closures exceed 40%, due to the<br />
increase in shading and lower production per tree in such areas. The relationship<br />
between the percent tree canopy closure of soft mast producing trees and<br />
a <strong>suitability</strong> <strong>index</strong> (SIV5) for the <strong>eastern</strong> <strong>wild</strong> <strong>turkey</strong> is presented in<br />
Figure 2b. It is assumed that either soft or hard mast, or a combination of<br />
the two, may provide optimum overall mast conditions for the <strong>eastern</strong> <strong>wild</strong><br />
<strong>turkey</strong>.<br />
Shrubs also may contribute to the fall, winter, and spring food value. A<br />
dense layer of shrubs would provide abundant <strong>wild</strong> <strong>turkey</strong> food; however, <strong>turkey</strong><br />
access and movements would be restricted in such areas due to the poor visibility<br />
and vulnerability of <strong>turkey</strong>s to predation. It is assumed that optimum<br />
shrub dens iti es for food production occur at shrub crown covers of 20% or<br />
more. Areas with no shrubs will contribute nothing to shrub food production.<br />
The relationship between shrub cover for food production and a <strong>suitability</strong><br />
<strong>index</strong> (SIV6) is presented in Figure 3a. It is further assumed that shrub<br />
densities of less than 40% crown cover will not restrict <strong>wild</strong> <strong>turkey</strong> use of an<br />
area. As shrub cover exceeds 40%, it is assumed wil d <strong>turkey</strong>s will show<br />
decreased use of the area, regardless of the amount of food production from<br />
trees and/or shrubs, due to a behavi ora1 response to the dense shrub cover.<br />
15
Fig. 3a<br />
Fig. 3b<br />
1.0 1.0<br />
\D r-,<br />
:::- :::-<br />
..... .....<br />
(/')<br />
(/')<br />
0.8<br />
.......... 0.8<br />
x<br />
Q) Q)<br />
"'0 "'0<br />
t: 0.6 t: 0.6<br />
..... .....<br />
>, >,<br />
.....<br />
0.4 ..... 0.4<br />
..... ....<br />
..c<br />
..c<br />
n::l 0.2<br />
n::l<br />
0.2<br />
..... .....<br />
:::l<br />
(/')<br />
0.0<br />
0 25 50 75 100<br />
Percent shrub crown cover<br />
(food production)<br />
x<br />
:::l<br />
(/')<br />
0.0<br />
0 25 50 75 100<br />
Percent shrub crown cover<br />
(behavioral)<br />
Fig. 3c<br />
co<br />
1.0<br />
:::-<br />
.....<br />
(/')<br />
0.8<br />
..........<br />
x<br />
Q)<br />
"'0<br />
t: 0.6<br />
.....<br />
>,<br />
.....<br />
.....<br />
.....<br />
..c<br />
n::l<br />
.....<br />
:::l<br />
(/')<br />
0.4<br />
0.2<br />
0.0<br />
0 25 50 75 100<br />
Percent of shrub crown cover<br />
comprised of soft mast<br />
producing shrubs<br />
Figure 3. The relationship between <strong>habitat</strong> variables used to assess<br />
the fall, winter, and spring food value of shrubs and sUitability<br />
indices for the <strong>eastern</strong> <strong>wild</strong> <strong>turkey</strong>.<br />
16
Areas with shrub coverage of 80% or greater are assumed to be totally unsuitable<br />
for <strong>turkey</strong>s. The relationship between shrub cover related to the <strong>turkey</strong>'s<br />
behavioral response and a <strong>suitability</strong> <strong>index</strong> (SIV7) is presented in Figure 3b.<br />
It is assumed that the best shrub conditions exist when 100% of the shrubs<br />
produce soft mast, and that low suitabilities will still be provided in areas<br />
with a lack of soft fruit producing shrubs, due to the <strong>turkey</strong>'s use of other<br />
shrub plant parts for food. The relationship between the amount of soft fruit<br />
producing shrubs and a <strong>suitability</strong> <strong>index</strong> (SIV8) is presented in Figure 3c.<br />
The fa 11, wi nter, spri ng food value (FWSSIl) in forest and tree savanna<br />
cover types is equal to the combined values of tree and shrub mast, modified<br />
by overall shrub density. Tree mast may be provided by either soft or hard<br />
mast species, and it is assumed that tree mast and shrub mast are equal in<br />
value. Excessive shrub densities will detract from the value of all mast<br />
resources. These relationships can be expressed mathematically, as shown in<br />
Equation 3, for DFW, EF, DF, ETS, and DTS.<br />
FWSSII =<br />
(SIV4 + SIV5) + (SIV6 x SIV8)<br />
2<br />
x SIV7 (3)<br />
Note: When the sum of SIV4 + SIV5 exceeds 1.0, it<br />
should be reduced to 1.0 before computing FWSSI1.<br />
The fall, winter, spring food value (FWSSI2) in shrub cover types is<br />
equal to the amount of food producing shrubs, modified by overall shrub density<br />
and the distance to forest cover. Shrubs alone are assumed to be able to<br />
provide up to one-half of the total fall, winter, and spring food value. This<br />
relationship can be expressed mathematically, as shown in Equation 4, for ES,<br />
DS, ESS, and DSS.<br />
FWSSI2 = (SIV6 x SIV8) x SIV7 x SIV3<br />
2<br />
(4)<br />
Croplands may provide high quality fall, winter, and spring food for the<br />
<strong>eastern</strong> <strong>wild</strong> <strong>turkey</strong>, especially in the western and northern portions of the<br />
<strong>turkey</strong>'s range. Corn and soybeans are highly preferred, while other grains<br />
are somewhat less valuable food sources. Crops other than corn, soybeans, and<br />
other grains are assumed to provide no food value. The relationship of the<br />
type of crop to a <strong>suitability</strong> <strong>index</strong> (SIV9) is presented in Figure 4a. The<br />
overwinter management of croplands will have a significant effect on the<br />
amount of crop food potentially available to <strong>turkey</strong>s. A direct measure of<br />
waste crop availability requires considerable field time and there is a large<br />
amount of variability in such measurements (Frederick et al. 1984). Therefore,<br />
a general approach is taken in this model to assess overwinter crop availability.<br />
Optimum conditions are assumed to exist in areas where more than 5% of<br />
the crop remains unharvested through the winter. Areas with the crop harvested<br />
17
in the fall, but plowed in the spring, will have moderate <strong>suitability</strong>. Croplands<br />
with a fall harvest and fall plowing will have no SUitability, due to<br />
the lack of waste crops. The relationship between the overwinter management<br />
of croplands and a <strong>suitability</strong> <strong>index</strong> (SIVI0) is presented in Figure 4b. The<br />
objective in assessing croplands is to determine the actual amount of waste<br />
grain available. Users with specific information on waste grain abundance may<br />
wish to revise these variables to fit their local data. An additional factor<br />
affecting the useability of croplands is the proximity to forest cover. This<br />
relationship in croplands is assumed to be the same as that described for<br />
herbaceous cover types in Figure lc for summer food/brood <strong>habitat</strong>. The overall<br />
fall, winter, spring food value (FWSSI3) in croplands is equal to the value<br />
for the type of crop, directly modified by the type of overwinter management<br />
and distance to forest cover. This relationship can be expressed mathematically,<br />
as shown in Equation 5, for croplands.<br />
FWSSI3 = SIV9 x SIVI0 x SIV3<br />
(5)<br />
O"l<br />
1.0<br />
::-<br />
......<br />
(/)<br />
x<br />
QJ<br />
0.8<br />
"C<br />
0.6 c:<br />
......<br />
~<br />
.....<br />
0.4<br />
.0<br />
<br />
.....<br />
0.2<br />
~<br />
(/)<br />
0.0<br />
Fig. 4a<br />
- '-<br />
ABC<br />
Type of crop<br />
A) corn or soybeans<br />
B) other grains<br />
C) other crops<br />
f-<br />
Figure 4. The relationships between <strong>habitat</strong> variables used to assess<br />
the fall, winter, and spring food value of crops and <strong>suitability</strong><br />
indices for the <strong>eastern</strong> <strong>wild</strong> <strong>turkey</strong>.<br />
18
Cover component. The cover needs of the <strong>eastern</strong> <strong>wild</strong> <strong>turkey</strong> are provided<br />
by mature deciduous, and mature mixed evergreen and deciduous, forests.<br />
Turkeys prefer forests with mostly open understories, and understory density<br />
is considered in this model by the shrub cover variables in the fall, winter,<br />
spring food component. It is assumed that roost sites will be adequate in<br />
areas that provide cover, as described in the following paragraphs.<br />
Thi s model assumes that optimum cover condi t ions for the <strong>eastern</strong> wi 1d<br />
<strong>turkey</strong> exist in areas with ~ 50% tree canopy cover..Habitats with less than<br />
10% tree canopy cover are assumed to be unsuitable for <strong>turkey</strong>s because of the<br />
small amount of cover they will provide. The relationship between tree canopy<br />
cover and a <strong>suitability</strong> <strong>index</strong> (SIV11) for the <strong>eastern</strong> <strong>wild</strong> <strong>turkey</strong> is presented<br />
in Figure Sa. It shoul d be noted that the di stri buti on and i nterspersion' of<br />
forest cover is assessed by the variable presented in Figure 1c.<br />
Eastern <strong>wild</strong> <strong>turkey</strong>s prefer mature or old growth forests due to both the<br />
structural characteristics and food production in such <strong>habitat</strong>s. Sapling<br />
forests provide poor overhead cover and are frequently too dense at ground<br />
1eve 1 for <strong>turkey</strong>s. The di ameter of overstory trees provides an i ndi rect<br />
assessment of forest maturity, and it is assumed that optimal <strong>habitat</strong>s contain<br />
overstory trees that average 30.5 cm dbh (Lewis, unpubl.). All trees are<br />
assumed to have some value for <strong>eastern</strong> wil d <strong>turkey</strong>s; however, suitabil i ty is<br />
assumed to decrease to a very low level as the average size of overstory trees<br />
decreases to 12.7 cm dbh or less (Lewis, unpubl.). The relationship between<br />
overstory tree diameter and a <strong>suitability</strong> <strong>index</strong> (SIV12) for the <strong>eastern</strong> <strong>wild</strong><br />
<strong>turkey</strong> is presented in Figure 5b.<br />
Turkeys utilize both deciduous and evergreen forests, but deciduous<br />
forest types are preferred. It is assumed that <strong>habitat</strong>s with less than 30% of<br />
the canopy comprised of evergreens will be optimal. Forests that are entirely<br />
evergreen will have low <strong>suitability</strong> for <strong>eastern</strong> <strong>wild</strong> <strong>turkey</strong>s. The relationship<br />
between the amount of evergreens in the tree canopy and a sui tabi 1i ty <strong>index</strong><br />
(SIV13) for the <strong>eastern</strong> <strong>wild</strong> <strong>turkey</strong> is presented in Figure 5c. A total lack<br />
of evergreen trees in the northern portions of the range of the <strong>eastern</strong> <strong>wild</strong><br />
<strong>turkey</strong> may indicate less than optimum suitabilities, especially during severe<br />
winters when conifers are used for cover. Users in these geographic areas<br />
should consider this possibility prior to applying this model.<br />
The overall cover value (CSI) for <strong>eastern</strong> <strong>wild</strong> <strong>turkey</strong>s in forested cover<br />
types is a function of tree canopy closure, the percent evergreen trees, and<br />
forest maturity (i.e., dbh). The cover value is assumed to be optimal only<br />
when <strong>suitability</strong> values for all three variables are optimal. The cover value<br />
is assumed to be lowered in direct proportion to low values for any of the<br />
variables. This relationship can be expressed mathematically, as shown in<br />
Equation 6, for DFW, OF, EF, DTS, and ETS.<br />
CSI = SIV11 x SIV12 x SIV13<br />
(6)<br />
19
Figure 5. The relationships between <strong>habitat</strong> variables used to assess<br />
the cover value of trees and <strong>suitability</strong> indices for the <strong>eastern</strong> <strong>wild</strong><br />
<strong>turkey</strong>.<br />
20
Composition component. Optimal <strong>habitat</strong>s for the <strong>eastern</strong> <strong>wild</strong> <strong>turkey</strong> must<br />
provide the proper mix of life requisites. A relatively small area is required<br />
to meet the summer food/brood needs of the <strong>turkey</strong>. Severa1 authors have<br />
estimated the amount of area needed in openings to support <strong>turkey</strong> broods.<br />
Latham (1958) recommended 10% openings, Speake et al. (1975) suggest a need<br />
for 12 to 25% openings, and Porter's (1980) data correspond to a need for<br />
about 14.5% openings. Based on the average of these percentages, it is assumed<br />
that optimal <strong>turkey</strong> <strong>habitat</strong>s should contain at least 15% of the area in summer<br />
food/brood <strong>habitat</strong>. It is assumed that, in optimal <strong>habitat</strong>s, the balance of<br />
the area, or 85%, should provide fall, winter, and spring food. Turkeys are<br />
primari ly forest bi rds, but several recent studi es have shown that they may<br />
attain dense populations in areas with an even mix of forest cover and open<br />
lands. Turkeys in Minnesota survived in areas with only 12% forest cover<br />
(Hecklau et al. 1982). This model assumes that in ideal <strong>habitat</strong>s, 50% or more<br />
of the area should provide optimal levels of cover. Habitats with less than<br />
10% of the area providing cover are assumed to be unsuitable. The relationships<br />
between the variables used to assess <strong>habitat</strong> composition and <strong>suitability</strong><br />
indices (SIV14, SIV15, and SIV16) for the <strong>eastern</strong> <strong>wild</strong> <strong>turkey</strong> are presented in<br />
Figure 6.<br />
This <strong>habitat</strong> model is structured in a flexible manner, such that various<br />
combinations of cover type conditions may exist to provide the optimal mix of<br />
life requisites. For example, assuming that the appropriate <strong>habitat</strong> variables<br />
(VI through V13) are optimum, the model would rate either of the following<br />
cover type mixes as optimum:<br />
1. 85% forest cover, 15% pasture<br />
2. 50% forest cover, 35% cropland, 15% pasture<br />
HSI determination. The overall value of a <strong>habitat</strong> for <strong>eastern</strong> <strong>wild</strong><br />
<strong>turkey</strong>s is a funct i on of the qua1i ty, quanti ty , and i nterspersi on of 1ife<br />
requisites. Interspersion is considered by the <strong>habitat</strong> variable (V3) that<br />
measures the di stance from open areas to forest cover. Several steps must be<br />
followed to determine the quality and quantity of life requisites for the<br />
<strong>turkey</strong>, as follows:<br />
1. Determine <strong>suitability</strong> <strong>index</strong> (SI) values for each variable in the<br />
appropriate cover type by entering the field data into the appropriate<br />
SI graphs.<br />
2. Calculate life requisite values in each cover type by using the SI<br />
values in the appropriate equations.<br />
3. Determine the relative area (%) of each cover type used by <strong>turkey</strong>s<br />
within the study area, as follows:<br />
Relative area (%) for cover type A = ~~~:lo:r~~v~~ ;<br />
l Ye A x 100<br />
cover types used by<br />
the <strong>turkey</strong><br />
21
0.2<br />
a<br />
Fig. 6a<br />
1. a -+---...................,L._........~_+-_-+-<br />
'd"<br />
......<br />
:><br />
~ 0.8<br />
x<br />
~ 0.6<br />
t:<br />
......<br />
t' 0.4<br />
.....<br />
.....<br />
..0<br />
to<br />
oj..><br />
.....<br />
5 10 15 20+<br />
Percent of area providing<br />
equivalent optimum summer<br />
food/brood <strong>habitat</strong><br />
LO<br />
......<br />
:><br />
~ 0.8<br />
x<br />
~ 0.6<br />
t:<br />
......<br />
t' 0.4<br />
:.a 0.2<br />
to<br />
oj..><br />
.....<br />
a<br />
Fig. 6b<br />
25 50 75 100<br />
Percent of area providing<br />
equivalent optimum fall,<br />
winter, spring food<br />
Figure 6. The relationships between the variables used to assess<br />
<strong>habitat</strong> composition and <strong>suitability</strong> indices for the <strong>eastern</strong> <strong>wild</strong><br />
<strong>turkey</strong>.<br />
22
4. Multiply the life requisite values for each cover type by the<br />
relative area (%) of that cover type, and sum these products for<br />
each life requisite.<br />
5. To determine the overall life requisite values, enter the value from<br />
step 4 for each life requisite into the appropriate SI graph<br />
(Fig. 6a-c). The resulting <strong>index</strong> values are the overall life<br />
requisite values.<br />
6. The HSl for the entire study area is equal to the lowest of the<br />
overall life requisite values.<br />
Application of the Model<br />
Summary of model variables. Fourteen <strong>habitat</strong> variables and three composition<br />
variables are used in this model to determine life requisite values for<br />
the <strong>eastern</strong> <strong>wild</strong> <strong>turkey</strong>. The relationship between <strong>habitat</strong> variables, life<br />
requisites, cover types, and the HSl for the <strong>turkey</strong> are illustrated in<br />
Figure 7. The spec ifi c trees that provi de food for the <strong>eastern</strong> wi 1d <strong>turkey</strong><br />
vary across the geographic range of the <strong>turkey</strong>. It is suggested that users<br />
develop a specific list of both hard and soft mast producing trees for use in<br />
Figure 2a and 2b.<br />
Definitions of variables and suggested measurements techniques (Hays<br />
et al. 1981) are provided in Figure 8.<br />
Model assumptions. Despite the abundance of information and research<br />
that has been gathered concerning the <strong>eastern</strong> <strong>wild</strong> <strong>turkey</strong>, their specific<br />
<strong>habitat</strong> requirements are not well understood (Bailey and Rinnel 1968; Kennamer<br />
et al. 1980; Little 1980; Hurst 1981). Numerous assumptions were made in the<br />
transformation of the published <strong>habitat</strong> information on <strong>eastern</strong> <strong>wild</strong> <strong>turkey</strong>s to<br />
the <strong>suitability</strong> <strong>index</strong> relationships and formulas used in this model. The<br />
major assumptions in the model are listed below.<br />
1. The <strong>habitat</strong> variables and life requisite relationships apply to the<br />
entire geographic range of the <strong>eastern</strong> <strong>wild</strong> <strong>turkey</strong>.<br />
2. Water is not a limiting factor.<br />
3. Nest sites will be present if fall, winter, and spring food, cover,<br />
and summer food! brood needs are met.<br />
4. Optimal fall, winter, and spring food values may be provided by<br />
crops alone, by the combined value of crops and mast from trees and<br />
shrubs, or by the combined value of mast from trees and shrubs.<br />
5. The relationships for hard mast were developed using data from oaks.<br />
It is assumed that these relationships apply to all hard mast<br />
producing trees.<br />
23
Habitat variable Li fe regu isite Cover tYpes<br />
Percent herbaceous canopy cover I<br />
Ioo::--------Summer food/brood DFW,DF,ETS,DTS--<br />
Average height of herbaceous------'~ <strong>habitat</strong><br />
canopy (summer) ~<br />
Distance to forest or tree Summer food/brood DS,ESS,DSS, I<br />
savanna cover types <strong>habitat</strong> G,F,P/H<br />
N<br />
~<br />
Average dbh of hard mast produc- ~<br />
ing trees that are 225.4 cm dbh<br />
Number of hard mast producing<br />
trees/ha that are ~ 25.4 cm dbh ~----------~/ Fal I, winter,<br />
_____ /' food<br />
Percent canopy closure of soft<br />
mast producing trees<br />
sp ri ng<br />
DFW, EF, DF, ETS,DTS--<br />
I<br />
Percent sh rub crown cove r<br />
i<br />
Percent of shrub crown cover r Fal I, winter, spring ES,DS,ESS,DSS I<br />
comprised of soft mast<br />
food<br />
producing shrubs<br />
I<br />
Type of crop<br />
Overwinter crop management ------- Fall, winter, spring C I<br />
food<br />
Distance to a tree dominated-----<br />
cover type<br />
HSI<br />
Percent tree canopy cover I Cover DFW,EF,DF,ETS,DTS<br />
Average dbh of overstory trees<br />
Percent of forest canopy<br />
comp r i sed of eve rg reens------<br />
Figure 7. Relationships between <strong>habitat</strong> variables, life requisites,<br />
cover types, and the HSI for the <strong>eastern</strong> <strong>wild</strong> <strong>turkey</strong>.
Variable (definition)<br />
Percent herbaceous canopy<br />
cover (the percent of the<br />
ground surface that is<br />
shaded by a vertical projection<br />
of all non-woody<br />
vegetation).<br />
Average height of herbaceous<br />
canopy (summer)<br />
(the average vertical<br />
distance from the ground<br />
surface to the dominant<br />
height stratum of the<br />
herbaceous vegetative<br />
canopy) .<br />
Distance to forest or<br />
tree savanna cover<br />
types (the distance<br />
from random points to<br />
the nearest edge of a<br />
forest or tree savanna<br />
cover type).<br />
Average dbh of hard mast<br />
producing trees that are<br />
~ 25.4 cm (10 inches)<br />
dbh [the average diameter<br />
of all hard mast producing<br />
trees that exceed 25.4 cm<br />
(10 inches) diameter at<br />
1.4 m (4.5 ft) above<br />
ground].<br />
Number of hard mast producing<br />
trees/ha that are<br />
~ 25.4 cm (10 inches)<br />
dbh [actual or estimated<br />
number of hard mast producing<br />
trees per ha that are<br />
~ 25.4 cm (10 inches)<br />
diameter at 1.4 m (4.5 ft)<br />
above ground].<br />
Cover types<br />
DFW,DF,ETS,DTS,<br />
DS,ESS,DSS,G,F,<br />
P/H<br />
DFW,DF,ETS,DTS,<br />
DS,ESS,DSS,G,F,<br />
P/H<br />
DS,ESS,DSS,<br />
G,F,P/H,C<br />
DFW,EF,DF,ETS,<br />
DTS<br />
DFW,EF,DF,ETS,<br />
DTS<br />
Suggested technique<br />
Line intercept,<br />
quadrat<br />
Line intercept,<br />
graduated rod<br />
Remote sensing<br />
Quadrat; Biltmore<br />
stick or diameter<br />
tape<br />
Quadrat<br />
Figure 8.<br />
Definitions of variables and suggested measurement techniques.<br />
25
Variable (definition)<br />
Percent canopy closure of<br />
soft mast producing trees<br />
[the percent of the<br />
ground surface that is<br />
shaded by the vertical<br />
projection of the canopies<br />
of trees that produce seeds<br />
encased in a pulpy mass<br />
(e.g., cherry, hawthorn,<br />
etc.)].<br />
Percent shrub crown<br />
cover [the percent of<br />
the ground surface<br />
that is shaded by a<br />
vertical projection<br />
of the canopies of<br />
woody vegetation<br />
~ 5.0 m (16.4 ft) tall].<br />
Percent of shrub crown<br />
cover comprised of soft<br />
mast producing shrubs<br />
(the relative percent<br />
of the amount of soft<br />
mast producing shrubs<br />
compared to all shrubs,<br />
based on crown cover).<br />
Type of crop (the<br />
present or last crop<br />
grown. Categories are:<br />
corn or soybeans; other<br />
grains; and other crops).<br />
Overwinter crop management<br />
(an evaluation of<br />
the winter availability<br />
of agricultural crops<br />
based on management.<br />
Categories are: > 5% of<br />
crop left unharvested;<br />
1 to 5% of crop left<br />
unharvested; crop<br />
harvested, spring plowed;<br />
crop harvested, fall<br />
plowed) .<br />
Cover types<br />
DFW, EF,OF, ETS,<br />
DTS<br />
DFW,EF,DF,ETS,<br />
DTS,ES,DS,ESS,<br />
DSS<br />
DFW,EF,DF,ETS,<br />
DTS,ES,DS,ESS,<br />
DSS<br />
C<br />
C<br />
Suggested technique<br />
Line intercept<br />
Line intercept,<br />
quadrat<br />
Line intercept,<br />
quadrat<br />
Observation, local<br />
data<br />
Observation, local<br />
data<br />
Figure 8.<br />
(continued).<br />
26
Variable (definition)<br />
Percent tree canopy<br />
closure [the percent<br />
of the ground surface<br />
that is shaded by a<br />
vertical projection of<br />
the canopies of woody<br />
vegetation ~ 5.0 m<br />
(16.4 ft) in height].<br />
Average dbh of overstory<br />
trees [the<br />
average diameter at<br />
1.4 m (4.5 ft) above<br />
the ground of those<br />
trees that are ~ 80%<br />
of the height of the<br />
tallest tree in the<br />
stand].<br />
Percent of forest canopy<br />
comprised of evergreens<br />
(the relative percent of<br />
the amount of evergreen<br />
tree canopy compared to<br />
the total tree canopy).<br />
Cover types<br />
DFW,EF,DF,ETS,<br />
DTS<br />
DFW,EF,DF,ETS,<br />
DTS<br />
DFW,EF,DF,ETS,<br />
DTS<br />
Suggested technique<br />
Remote sensing, line<br />
intercept<br />
Cruise for tallest<br />
trees in stand.<br />
Sample with optical<br />
range finder and<br />
Biltmore stick on<br />
strip quadrat.<br />
Li ne intercept,<br />
remote sensing<br />
Figure 8.<br />
(concluded).<br />
6. The abundance of insects for broods is directly related to the<br />
biomass and structure of herbaceous vegetation.<br />
7. Interspersion of life requisites (fall, spring, winter food; cover;<br />
and summer food/brood <strong>habitat</strong>) is only a concern when a cover type<br />
does not provide one or more of these life requisites.<br />
8. For individual life requisites, optimal overall conditions are<br />
provided by a specific mix of both quantity and quality of an area<br />
providing the requisite. It is assumed that optimum overall conditions<br />
for a life requisite may still exist, even if individual cover<br />
types contain less than optimum quality, if this lack of quality can<br />
be compensated for by an increased quantity of the resource being<br />
present.<br />
27
SOURCES OF OTHER MODELS<br />
Williamson and Koeln (1980) developed a linear additive model to define<br />
areas of different <strong>habitat</strong> <strong>suitability</strong> for <strong>wild</strong> <strong>turkey</strong>s in forested areas of<br />
Virginia. Seven <strong>habitat</strong> factors are used in the model, with each factor given<br />
a value depending on its condition, and also given a relative weighting factor<br />
in comparison to other factors. The value of a particular forest stand is<br />
equal to the sum of all <strong>habitat</strong> factors. The seven <strong>habitat</strong> factors are: mast<br />
species diversity; proximity to permanent water; proximity to forest openings;<br />
mast availability; competition; forest contiguity; and proximity to roost<br />
si tes.<br />
Armbruster and Lewis (1980) developed an additive <strong>habitat</strong> model for<br />
<strong>eastern</strong> <strong>wild</strong> <strong>turkey</strong>s in central Missouri. The model assesses various <strong>habitat</strong><br />
characteristics in bottomland hardwoods, upland hardwoods, old fields, pastures<br />
and hayl ands, and croplands, and determi nes a numerica 1 value for each of<br />
these cover types. The model does not provide a method to determine a single<br />
value for a composite of several different cover types. Habitat characteristics<br />
in this model include: tree species; number of food plant species;<br />
<strong>habitat</strong> edge; grazing pressure; tree size class and canopy closure; nesting<br />
cover; crop practices; and distances between cover types.<br />
REFERENCES<br />
Anderson, R. J., and D. E. Samuel.<br />
mines as <strong>wild</strong> <strong>turkey</strong> brood range.<br />
1980. Evaluation of reclaimed surface<br />
Proc. Wild Turkey Symp. 4:186-202.<br />
Armbruster, M. J., and J. B. Lewis. 1980. Eastern <strong>wild</strong> <strong>turkey</strong>. Pages 27-41<br />
in T. S. Baskett, D. A. Darrow, D. L. Hallett, M. J. Armbruster, J. A.<br />
Ellis, B. F. Sparrowe, and P. A. Korte. A handbook for terrestrial<br />
<strong>habitat</strong> evaluation in central Missouri. U.S. Fish Wildl. Servo Res.<br />
Publ. 133.<br />
Bailey, R. W. 1980. The <strong>wild</strong> <strong>turkey</strong> status and outlook in 1979. Proc. Wild<br />
Turkey Symp. 4:1-9.<br />
Bailey, R. W., and K. T. Rinnell. 1968. History and management of the <strong>wild</strong><br />
<strong>turkey</strong> in West Virginia. West Virginia Dept. Nat. Res., Div. Game Fish<br />
Bull. 6. 59 pp.<br />
Bailey, R. W., J. R. Davis, J. E. Frampton, J. V. Gwynn, and J. Shugars.<br />
1981. Habitat requirements of the <strong>wild</strong> <strong>turkey</strong> in the southeast Piedmont.<br />
Pages 14-23 in P. T. Bromley and R. L. Carlton, eds. Proc. of the Symp.:<br />
Habi tat Requi rements and Habi tat Management for the Wild Turkey in the<br />
Southeast, Richmond, Virginia.<br />
Barwick, L. H., and D. W. Speake. 1973. Seasonal movements and activities of<br />
<strong>wild</strong> <strong>turkey</strong> gobblers in Alabama. Pages 125-133 in G. C. Sanderson and<br />
H. C. Schultz, eds. Wild <strong>turkey</strong> management, current problems and<br />
programs. Missouri Chapt. Wildl. Soc. and Univ. Missouri Press, Columbia.<br />
28
Blackburn, W. E., J. P. Kirk, and J. E. Kennamer. 1975. Availability and<br />
utilization of summer foods by <strong>eastern</strong> <strong>wild</strong> <strong>turkey</strong> broods in Lee County,<br />
Alabama. Proc. Wild Turkey Symp. 3:86-107.<br />
Bortner, J. B., and J. W. Bennett. 1980. Observations of <strong>wild</strong> <strong>turkey</strong> winter<br />
range at Snake Mountain, Vermont. Trans. North<strong>eastern</strong> Sect. Wildl. Soc.<br />
37:243-248.<br />
Christisen, D. M., and L. J. Korschgen. 1955. Acorn yields and <strong>wild</strong>life<br />
usage in Missouri. Trans. N. Am. Wildl. Conf. 20:337-357.<br />
Dalke, P. D., W. K. Clark, Jr., and L. J. Korschgen. 1942. Food habit trends<br />
of the <strong>wild</strong> <strong>turkey</strong> in Missouri as determined by dropping analysis. J.<br />
Wildl. Manage. 6(3):237-243.<br />
Davis, J. R. 1976. Management for Alabama <strong>wild</strong> <strong>turkey</strong>s. Alabama Dept.<br />
Conserv. Spec. Rep. 5. 130 pp.<br />
Dickson, J. G., C. D. Adams, and S. H. Hanley. ~978. Response of <strong>turkey</strong><br />
populations to <strong>habitat</strong> variables in Louisiana. Wildl. Soc. Bull.<br />
6(3):163-166.<br />
Eaton, S. W., F. M. Evans, J. W. Glidden, and B. D. Penrod. 1976. Annual<br />
range of wil d <strong>turkey</strong>s in southwestern New York. New York Fi sh Game J.<br />
23(1):20-33.<br />
Eichholz, N. F., and R. L. Marchinton. 1976. Dispersal and adjustment to<br />
<strong>habitat</strong> of restocked <strong>wild</strong> <strong>turkey</strong>s in Georgia. Proc. South<strong>eastern</strong> Assoc.<br />
Game Fish Commissioners 29:373-378.<br />
Ellis, J. E., and J. B. Lewis. 1967. Mobility and annual range of <strong>wild</strong><br />
<strong>turkey</strong>s in Missouri. J. Wildl. Manage. 31(3):568-581.<br />
Everett, D. D., Jr. 1982. Factors limiting populations of <strong>wild</strong> <strong>turkey</strong>s on<br />
state <strong>wild</strong>life management areas in north Alabama. Ph.D. Diss., Auburn<br />
Univ., Alabama. 135 pp.<br />
Frederick, R. B., E. E. Klaas, G. A. Baldassarre, and K. E. Reinecke. 1984.<br />
A method for sampling waste corn. J. Wildl. Manage. 48(1):298-303.<br />
Gingrich, S. F. 1971. Stocking, growth, and yield of oak stands. Proc. Oak<br />
Symp. 1:65-73.<br />
Glover, F. A. 1948. Winter activities of <strong>wild</strong> <strong>turkey</strong> in West Virginia. J.<br />
Wildl. Manage. 12(4):416-427.<br />
Glover, F. A., and R. W. Bailey. 1949. Wild <strong>turkey</strong> foods in West Virginia.<br />
J. Wildl. Manage. 13(3):255-265.<br />
Goodrum, P. D., V. H. Reid, and C. E. Boyd. 1971. Acorn yields, characteristics,<br />
and management criteria of oaks for <strong>wild</strong>life. J. Wildl. Manage.<br />
35(3):520-532.<br />
29
Hamrick, W. J., and J. R. Davis. 1972. Summer food items of juvenile <strong>wild</strong><br />
<strong>turkey</strong>s. Proc. South<strong>eastern</strong> Assoc. Game Fish Commissioners 25:85-89.<br />
Hays, R. L., C. S. Summers, and W. Seitz. 1981. Estimating <strong>wild</strong>life <strong>habitat</strong><br />
variables. U.S. Fish Wildl. Servo FWS/DBS-81/47. 111 pp.<br />
Healy, W. M. 1977. Wild <strong>turkey</strong> winter <strong>habitat</strong> in West Virginia cherry-maple<br />
forests. Trans. North<strong>eastern</strong> Sect. Wildl. Soc. 34:7-12.<br />
1978. Feeding activity of <strong>wild</strong> <strong>turkey</strong> poults in relation to<br />
ground vegetation and insect availability. Ph.D. Diss., West Virginia<br />
Univ., Morgantown. 117 pp.<br />
1981. Habitat requirements of <strong>wild</strong> <strong>turkey</strong>s in the south<strong>eastern</strong><br />
mountains. Pages 24-34 in P. T. Bromley and R. L. Carlton, eds. Proc.<br />
of the Symp.: Habi tat Requi rements and Habi tat Management for the Wil d<br />
Turkey in the Southeast, Richmond, Virginia.<br />
Healy, W. M., and L S. Nenno.<br />
management of cl eari ngs<br />
11(2): 113-120.<br />
1983. Minimum maintenance versus intensive<br />
for <strong>wild</strong> <strong>turkey</strong>s. Wildl. Soc. Bull.<br />
Heckl au , J. D., W. F. Porter, and W. M. Shields. 1982. Feasibility of<br />
transplanting <strong>wild</strong> <strong>turkey</strong>s into areas of restricted forest cover and high<br />
human density. Trans. North<strong>eastern</strong> Sect. Wildl. Soc. 39:96-104.<br />
Hillestad, H. D. 1973. Movements, behavior, and nesting ecology of the <strong>wild</strong><br />
<strong>turkey</strong> in <strong>eastern</strong> Alabama. Pages 109-125 in G. C. Sanderson and H. C.<br />
Schultz, eds. Wild <strong>turkey</strong> management. Missouri Chapt. Wildl. Soc. and<br />
Univ. Missouri Press, Columbia.<br />
Hillestad, H. 0., and D. W. Speake. 1970. Activities of <strong>wild</strong> <strong>turkey</strong> hens and<br />
poults as influenced by <strong>habitat</strong>. Proc. South<strong>eastern</strong> Assoc. Game Fish<br />
Commissioners 24:244-251.<br />
Hurst, G. A. 1978. Effects of controlled burning on <strong>wild</strong> <strong>turkey</strong> poult food<br />
habits. Proc. South<strong>eastern</strong> Assoc. Fish Wildl. Agencies 32:30-37.<br />
1981. Habitat requirements of the <strong>wild</strong> <strong>turkey</strong> on the southeast<br />
coastal plain. Pages 2-13 in P. T. Bromley and R. L. Carlton, eds.<br />
Proc. of the Symp.: Habitat~equirements and Habitat Management for the<br />
Wild Turkey in the Southeast, Richmond, Virginia.<br />
Hurst, G. A., and B. D. Stringer, Jr. 1975. Food habits of <strong>wild</strong> <strong>turkey</strong><br />
poults in Mississippi. Proc. Wild Turkey Symp. 3:76-85.<br />
Kennamer, J. L, J. R. Gwaltney, and K. R. Sims. 1980. Food habits of the<br />
<strong>eastern</strong> <strong>wild</strong> <strong>turkey</strong> on an area intensively managed for pine in Alabama.<br />
Proc. Wild Turkey Symp. 4:246-250.<br />
Korschgen, L. J. 1967. Feeding habits and food. Pages 137-198 in D. H.<br />
Hewitt, ed. The <strong>wild</strong> <strong>turkey</strong> and its management. The Wildl:"" Soc.,<br />
Washington, DC.<br />
30
1973. April foods of wil d <strong>turkey</strong>s in Mi ssouri . Pages<br />
143-151 in G. C. Sanderson and H. C. Schultz, eds. Wild <strong>turkey</strong> management.<br />
Missouri Chapt. Wildl. Soc. and Univ. Missouri Press, Columbia.<br />
Koz t cky , E. L: 1942. Pennsylvania <strong>wild</strong> <strong>turkey</strong> food habits based on dropping<br />
analysis. Pennsylvania Game News 13(8):10-11, 28-29, 31. Cited by<br />
Korschgen 1967.<br />
Latham, R. M. 1958. Factors affecting distribution and abundance of <strong>wild</strong><br />
turKeys in Pennsylvania. Ph.D. Thesis, Pennsylvania State Univ.,<br />
University Park.<br />
Lewis, J. B., and E. Kurzejeski. 1984.<br />
mortality in north central Missouri.<br />
W-13-R-38. 43 pp.<br />
Wild <strong>turkey</strong> productivity and poult<br />
Missouri Dept. Cons. Fed. Aid Proj.<br />
Lewis, J. C. 1964. Populations of <strong>wild</strong> <strong>turkey</strong>s in relation to fields. Proc.<br />
South<strong>eastern</strong> Assoc. Game Fish Commissioners 18:48-56.<br />
Lindzey, J. S. 1967. Highlights of management. Pages 245-260 in O. H.<br />
Hewitt, ed. The <strong>wild</strong> <strong>turkey</strong> and its management. The Wild~ Soc.,<br />
Washington, DC.<br />
Little, 1. W. 1980. Wild <strong>turkey</strong> restoration in "marq i nal " Iowa <strong>habitat</strong>s.<br />
Proc. Wild Turkey Symp. 4:45-60.<br />
Markley, M. H. 1967. Limiting factors. Pages 199-244 in O. H. Hewitt, ed.<br />
The <strong>wild</strong> <strong>turkey</strong> and its management. The Wildl. Soc., Washington, DC.<br />
Martin, A. C., F. H. May, and T. E. Clarke. 1939. Early winter food preferences<br />
of the wil d <strong>turkey</strong> on the George Washi ngton Nati ona1 Forest.<br />
Trans. N. Am. Wildl. Conf. 4:570-578.<br />
Martin, D. D., and B. S. McGinnes. 1975. Insect availability and use by<br />
<strong>turkey</strong>s in forest clearings. Proc. Wild Turkey Symp. 3:70-75.<br />
McQuilkin, R. A., and R. A. Musbach. 1977.<br />
tree reservoirs in south<strong>eastern</strong><br />
41(2):218-225.<br />
Pin oak acorn production on green<br />
Missouri. J. Wildl. Manage.<br />
Mosby, H. S., and C. O. Handley. 1943. The <strong>wild</strong> <strong>turkey</strong> in Virginia, its<br />
status, life history, and management. Div. Game Comm. Inland Fish.,<br />
Richmond, VA. 281 pp.<br />
Nenno, E. S., and J. S. Lindzey. 1979. Wild <strong>turkey</strong> poult feeding activity in<br />
old field, agricultural clearing, and forest communities. Trans. North<strong>eastern</strong><br />
Sect. Wildl. Soc. 36:97-109.<br />
Owen, C. N. 1976. Food habits of <strong>wild</strong><br />
fields in east central Mississippi,<br />
edges on arthropod populations in<br />
M.S. Thesis. Mississippi State<br />
Cited by Hurst 1978.<br />
31<br />
<strong>turkey</strong> poults in pine stands and in<br />
and the effects of mowing hayfield<br />
relation to poult food production.<br />
Univ., Mississippi State. 62 pp.
Pack. J. C., R. P. Burkert. W. K. Igo. and D. J. Pybus. 1980. Habitat<br />
utilized by <strong>wild</strong> <strong>turkey</strong> broods within oak-hickory forests of West<br />
Virginia. Proc. Wild Turkey Symp. 4:213-224.<br />
Porter. W. F. 1977 . Home range of wil d <strong>turkey</strong>s in south<strong>eastern</strong> Mi nnesota.<br />
J. Wildl. Manage. 41(3):434-437.<br />
1978. The ecology and behavior of the <strong>wild</strong> <strong>turkey</strong> (Meleagris<br />
gallopovo) in south<strong>eastern</strong> Minnesota. Ph.D. Thesis. Univ. Minnesota.<br />
Minneapolis. 122 pp.<br />
1980. An evaluation of <strong>wild</strong> <strong>turkey</strong> brood <strong>habitat</strong> in south<strong>eastern</strong><br />
Minnesota. Proc. Wild Turkey Symp. 4:203-213.<br />
Porter. W. F.• R. D. Tangen. G. C. Nelson. and D. A. Hamilton. 1980. Effects<br />
of corn food plots on <strong>wild</strong> <strong>turkey</strong> in the Upper Mississippi Valley. J.<br />
Wildl. Manage. 44(2):456-462.<br />
Pybus. D. J. 1977. Understory characteristics and utilization by <strong>wild</strong> <strong>turkey</strong><br />
broods in West Virginia. M.S. Thesis. West Virginia Univ .• Morgantown.<br />
106 pp.<br />
Raybourne , J. W. 1968. Telemetry of <strong>turkey</strong> movements. Proc. South<strong>eastern</strong><br />
Assoc. Game Fish Commissioners 22:47-54.<br />
Shaw. S. P. 1971. Wildlife and oak management. Proc. Oak Symp. 1:84-89.<br />
Speake. D. W. 1980. Predation on <strong>wild</strong> <strong>turkey</strong>s in Alabama. Proc. Wild Turkey<br />
Symp. 4: 86-101.<br />
Speake. D. W.• L. H. Barwick. H. O. Hillestad. and W. Stickney. 1969. Some<br />
characteri sti cs of an expandi ng <strong>turkey</strong> population. Proc. South<strong>eastern</strong><br />
Assoc. Game Fish Commissioners 23:46-53.<br />
Speake. D. W.• T. E. Lynch. W. J. Fleming. G. A. Wright. and W. J. Hamrick.<br />
1975. Habitat use and seasonal movements of <strong>wild</strong> <strong>turkey</strong>s in the southeast.<br />
Proc. Wild Turkey Symp. 3:122-130.<br />
Tzt l kowsk i , W. M. 1971. Winter roost sites of <strong>wild</strong> <strong>turkey</strong>s in southwest<br />
Pennsylvania. Trans. North<strong>eastern</strong> Sect. Wildl. Soc. 28:167-178.<br />
U.S. Fish and Wildlife Service. 1981. Standards for the development of<br />
<strong>habitat</strong> <strong>suitability</strong> <strong>index</strong> <strong>models</strong>. 103 ESM. U.S. Fish Wildl. Serv .• Div.<br />
Ecol. Servo n.p.<br />
Williams. L. E.. Jr. 1981. The book of the <strong>wild</strong> <strong>turkey</strong>. Winchester Press,<br />
Tulsa. 181 pp.<br />
Williamson. J. F.• and G. T. Koeln. 1980. A computerized <strong>wild</strong> <strong>turkey</strong> <strong>habitat</strong><br />
evaluation system. Proc. Wild Turkey Symp. 4:233-239.<br />
32
Wright, G. A., and D. W. Speake. 1975. Compatibility of the <strong>eastern</strong> <strong>wild</strong><br />
<strong>turkey</strong> with recreational activities at Land Between the Lakes, Kentucky.<br />
Proc. South<strong>eastern</strong> Assoc. Game Fish Commissioners 29:578-584.<br />
Wunz, G. A. 1971. Tolerances of <strong>wild</strong> <strong>turkey</strong>s to human disturbance and limited<br />
range. Trans. Northeast Sect. Wildl. Soc. 28:159-165.<br />
33
502n·101<br />
REPORT DOCUMENTATION 11. ~EPORT ~.<br />
PAGE I Blologlcal<br />
Report 82(10.106~~<br />
'11..Reclp.ent'. Acclss,o" No.<br />
4. Titll Ind Subtitle ~ RlPOrt Oltl<br />
August 1985<br />
Habitat Suitability Index ~odels: Eastern Hild Turkey<br />
6. -~<br />
7. Authorl.) 8. Plrtormin. Or.lnizltion RIPl. No.<br />
Richard L. Schroeder<br />
9. Pertormin. O,,"niution N..... Ind Addr... Western Energy and Land Use Team 10. Pro,lct/TIsk/Work Unit No.<br />
U.S. Fish and Wildlife Service<br />
2627 Redwing Road 11. ContrlctlC) or GrlntlG) No.<br />
Fort Co 11 ins, CO 80526-2899 IC)<br />
1~ SpoRSorin. Or.lniution Nlml Ind Add..... Wes tern Energy and Land Use Team 13. Type of Report & Period COYlrld<br />
Division of Biological Services<br />
Research and Development<br />
Fish and Wildlife Service 14.<br />
Deoartmen.Uf the Interior Wrlc::hinnt hn DC :mno<br />
15. Suppllmlntlry Notl' The Biological Report series was initi~ted in October 1984 to replace<br />
the FWSjOBS series published since 1976. The report number assigned to this model<br />
foll ows consecutively from the Habitat SUita~llitY)Index <strong>models</strong> published as FVJSjOBS-<br />
8/1O nnw rlC:: R'i n l n o i r-a I n R 10<br />
16. Abstrlct (Limit: 200 worm)<br />
A review and synthesis of existing information were used to develop a Habita t<br />
Suitabil t ty Index (HSI) model for the <strong>eastern</strong> <strong>wild</strong> <strong>turkey</strong> U~el eagris gallopavo<br />
sylvestris). The model consol idates <strong>habitat</strong> use information into a framework<br />
appropriate for field application, and is scaled to produce an <strong>index</strong> between 0.0<br />
(unsuitable <strong>habitat</strong>) and 1.0 (optimum <strong>habitat</strong>). HSI <strong>models</strong> are designed to be used<br />
with Habitat Evaluation Procedures previously developed by the U.S. Fish and Wildlife<br />
Service.<br />
IGl<br />
17. Document Anllysi. I. Descriptors<br />
Birds<br />
Wildlife<br />
Habitabil ity<br />
Mathematical <strong>models</strong><br />
b. Identlfiers/Open·Ended Tlrm.<br />
Eastern <strong>wild</strong> <strong>turkey</strong><br />
Meleagris gallopavo sylvestris<br />
I<br />
I<br />
c. COSATI Filld/GnluP<br />
18. AYlillbillty Stltlml"; lIt. Security CII.s (Tlli. RlPOrt) I 21. No of PI,.. !<br />
Release unlimit~d Unclassified , 33 _-.J<br />
I20. Security CII,' (Til,. PI.e) i 22~ Price<br />
I<br />
I Uncl as si ft ed ! I<br />
(S.. ANSI-Z39.18)<br />
*u.S. GOVERNMENT PRINTING OFFICE: 1985-580246/25345<br />
OI"T\ONAL FOR'" 272 ( 4-77<br />
IFormerly NTI:>-3S1<br />
Department of Commerce<br />
I
..<br />
....,-. .. .. ~<br />
""<br />
,,<br />
I<br />
__r----<br />
6! ,-----<br />
, : ,---<br />
L, J_<br />
1<br />
I ,<br />
I<br />
* Headquarters,<br />
0lvI5 10n Of Biolog ical<br />
services. Wasn,ngton. DC<br />
)( Eastern Energy and Land Use Team<br />
Leerown. WV<br />
* Naloonal Coastal Ecosystems Team<br />
Slide ll LA<br />
• Western Energy aM LaM Use Team<br />
FI ccu.ns. CO<br />
• Locat ions of RegIo nal Ollices<br />
,."<br />
UGION 1<br />
Rqiunlll Director<br />
O.S. Fish lind Wildlife Service<br />
Uoyd Five Hundred Building, Suite 1692<br />
500N.E. Multnomah Street<br />
Portland, Oregon 97232<br />
REGION 2<br />
Regional Director<br />
U.S. Fish and Wildlife Service<br />
P.O. Box 1306<br />
Albuquerque, New Mexico 87103<br />
REGION 3<br />
Regional Director<br />
U.S. Fish and Wildlife Service<br />
Federal Building, Fort Snelling<br />
Twin Cities, Minnesota 5SIII<br />
REGION 4<br />
Regional Director<br />
U.S. Fish and Wildlife Service<br />
Richard B. Russell Building<br />
75 Spring Street, S.W.<br />
Atlanta, Georgia 30303<br />
REGION S<br />
Regional Director<br />
U.S. Fish and Wildlife Service<br />
One Gateway Center<br />
Newton Comer, Massachusetts 02158<br />
REGION 6<br />
Regional Director<br />
U.S. Fish and Wildlife Service<br />
P.O. Box 25486<br />
Denver Federal Center<br />
Denver, Colorado 80225<br />
REGION 7<br />
Regional Director<br />
U.S. Fish and Wildlife Service<br />
10II E. Tudor Road<br />
Anchorage, Alaska 99503
DEPARTMENT OF THE INTERIOR<br />
u.s. FISH AND WILDLIFE SERVICE<br />
As the Nation's principal conservation asency, the Department of the Interior has responsibility<br />
for most of our .nationally owned public lands and natural resources. This includes<br />
fosterins the wisest use of our land and water resources, protecting our fish and <strong>wild</strong>life,<br />
preserving th.environmental and cultural'values of our national parks and historical places,<br />
and providing for the enjoyment of life throulh outdoor recreation. The Department assesses<br />
our energy and mineral resources and works to assure that their development is in<br />
the best interests of all our people. The Department also has a major responsibility for<br />
American Indian reservation communities and for people who live in island territories under<br />
U.S. administration.


