Epidemiology of Peptic Ulcer Disease: Endoscopic Results of ... - IAGH
Epidemiology of Peptic Ulcer Disease: Endoscopic Results of ... - IAGH
Epidemiology of Peptic Ulcer Disease: Endoscopic Results of ... - IAGH

Create successful ePaper yourself
Turn your PDF publications into a flip-book with our unique Google optimized e-Paper software.
92<br />
<strong>Epidemiology</strong> <strong>of</strong> <strong>Peptic</strong> <strong>Ulcer</strong> <strong>Disease</strong><br />
Pearson Chi square or Fisher’s exact tests were<br />
used to examine relationships between categorical<br />
variables, where appropriate. Associations between<br />
PUD and education, age and BMI were expressed<br />
using p value for trend. We made separate multivariable<br />
logistic regression models (stepwise method)<br />
for DU and GU to determine main risk factors<br />
<strong>of</strong> PUD. P values less than 0.05 were considered<br />
significant. Data analysis was performed using<br />
SPSS statistical package version 16.0 (SPSS Inc.<br />
Chicago, Illinois, USA).<br />
RESULTS<br />
Study participants<br />
Of initial 1122 selected and eligible persons,<br />
1011 individuals (90.1%) accepted to participate<br />
in the study. Among them, 494 (48.8%) were men<br />
and 517 (51.2%) were women. The mean age was<br />
53.25±10.38 years (ranging from 40 to 92 years).<br />
Among the participants, 539 (53.3%) were residants<br />
<strong>of</strong> Ardabil and Meshkinshahr cities and the<br />
remaining 434 (46.7%) were from rural areas. The<br />
mean body mass index (BMI) <strong>of</strong> our participants<br />
was measured to be 27±4.7kg/m 2 while most <strong>of</strong><br />
our subjects had BMI between 25 and 30kg/m 2 .<br />
Their literacy level included none (76%), secondary<br />
(16.5%), advanced (5.6%) and primary (1.9%)<br />
respectively. Most <strong>of</strong> the volunteers were from low<br />
socioeconomic groups <strong>of</strong> the society, appreciating<br />
free <strong>of</strong> charge screening, and their literacy level was<br />
lower than the average Iranian population (75% literate).<br />
Among the participants, 302 (29.9%), 18(1.8%)<br />
and 35 (3.5%) had tobacco smoking, opium addiction<br />
and alcohol consumption, respectively. Even<br />
though there was no statistically significant difference<br />
in the prevalence <strong>of</strong> digestive complaints, 539<br />
(52.9%) and 443 (43.8%) <strong>of</strong> the participants reported<br />
heart burn and epigastric pain, respectively.<br />
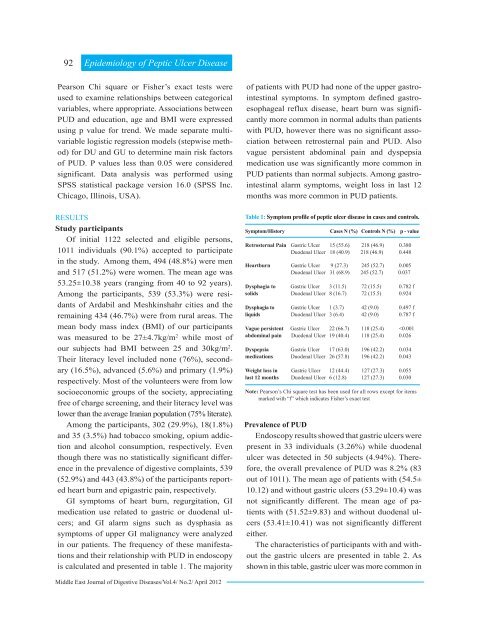
GI symptoms <strong>of</strong> heart burn, regurgitation, GI<br />
medication use related to gastric or duodenal ulcers;<br />
and GI alarm signs such as dysphasia as<br />
symptoms <strong>of</strong> upper GI malignancy were analyzed<br />
in our patients. The frequency <strong>of</strong> these manifestations<br />
and their relationship with PUD in endoscopy<br />
is calculated and presented in table 1. The majority<br />
<strong>of</strong> patients with PUD had none <strong>of</strong> the upper gastrointestinal<br />
symptoms. In symptom defined gastroesophageal<br />
reflux disease, heart burn was significantly<br />
more common in normal adults than patients<br />
with PUD, however there was no significant association<br />
between retrosternal pain and PUD. Also<br />
vague persistent abdominal pain and dyspepsia<br />
medication use was significantly more common in<br />
PUD patients than normal subjects. Among gastrointestinal<br />
alarm symptoms, weight loss in last 12<br />
months was more common in PUD patients.<br />
Table 1: Symptom pr<strong>of</strong>ile <strong>of</strong> peptic ulcer disease in cases and controls.<br />
Symptom/History<br />
Cases N (%) Controls N (%) p - value<br />
Retrosternal Pain Gastric <strong>Ulcer</strong> 15 (55.6) 218 (46.9) 0.380<br />
Duodenal <strong>Ulcer</strong> 18 (40.9) 218 (46.9) 0.448<br />
Heartburn Gastric <strong>Ulcer</strong> 9 (27.3) 245 (52.7) 0.005<br />
Duodenal <strong>Ulcer</strong> 31 (68.9) 245 (52.7) 0.037<br />
Dysphagia to Gastric <strong>Ulcer</strong> 3 (11.5) 72 (15.5) 0.782 f<br />
solids Duodenal <strong>Ulcer</strong> 8 (16.7) 72 (15.5) 0.924<br />
Dysphagia to Gastric <strong>Ulcer</strong> 1 (3.7) 42 (9.0) 0.497 f<br />
liquids Duodenal <strong>Ulcer</strong> 3 (6.4) 42 (9.0) 0.787 f<br />
Vague persistent Gastric <strong>Ulcer</strong> 22 (66.7) 118 (25.4)