Epidemiology of Peptic Ulcer Disease: Endoscopic Results of ... - IAGH
Epidemiology of Peptic Ulcer Disease: Endoscopic Results of ... - IAGH
Epidemiology of Peptic Ulcer Disease: Endoscopic Results of ... - IAGH

You also want an ePaper? Increase the reach of your titles
YUMPU automatically turns print PDFs into web optimized ePapers that Google loves.
94<br />
<strong>Epidemiology</strong> <strong>of</strong> <strong>Peptic</strong> <strong>Ulcer</strong> <strong>Disease</strong><br />
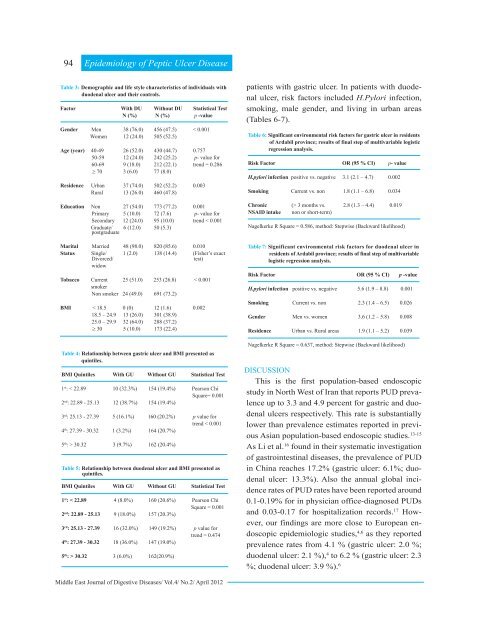
Table 3: Demographic and life style characteristics <strong>of</strong> individuals with<br />
duodenal ulcer and their controls.<br />
Factor With DU Without DU Statistical Test<br />
N (%) N (%) p -value<br />
Gender Men 38 (76.0) 456 (47.5) < 0.001<br />
Women 12 (24.0) 505 (52.5)<br />
Age (year) 40-49 26 (52.0) 430 (44.7) 0.757<br />
50-59 12 (24.0) 242 (25.2) p- value for<br />
60-69 9 (18.0) 212 (22.1) trend = 0.286<br />
≥ 70 3 (6.0) 77 (8.0)<br />
Residence Urban 37 (74.0) 502 (52.2) 0.003<br />
Rural 13 (26.0) 460 (47.8)<br />
Education Non 27 (54.0) 773 (77.2) 0.001<br />
Primary 5 (10.0) 72 (7.6) p- value for<br />
Secondary 12 (24.0) 95 (10.0) trend < 0.001<br />
Graduate/<br />
postgraduate<br />
6 (12.0) 50 (5.3)<br />
Marital Married 48 (98.0) 820 (85.6) 0.010<br />
Status Single/ 1 (2.0) 138 (14.4) (Fisher’s exact<br />
Divorced/<br />
test)<br />
widow<br />
Tobacco Current 25 (51.0) 253 (26.8) < 0.001<br />
smoker<br />
Non smoker 24 (49.0) 691 (73.2)<br />
BMI < 18.5 0 (0) 12 (1.6) 0.002<br />
18.5 – 24.9 13 (26.0) 301 (38.9)<br />
25.0 – 29.9 32 (64.0) 288 (37.2)<br />
≥ 30 5 (10.0) 173 (22.4)<br />
Table 4: Relationship between gastric ulcer and BMI presented as<br />
quintiles.<br />
BMI Quintiles With GU Without GU Statistical Test<br />
1 st : < 22.89 10 (32.3%) 154 (19.4%) Pearson Chi<br />
Square= 0.001<br />
2 nd : 22.89 - 25.13 12 (38.7%) 154 (19.4%)<br />
3 rd : 25.13 - 27.39 5 (16.1%) 160 (20.2%) p value for<br />
trend < 0.001<br />
4 th : 27.39 - 30.32 1 (3.2%) 164 (20.7%)<br />
5 th : > 30.32 3 (9.7%) 162 (20.4%)<br />
Table 5: Relationship between duodenal ulcer and BMI presented as<br />
quintiles.<br />
BMI Quintiles With GU Without GU Statistical Test<br />
1 st : < 22.89 4 (8.0%) 160 (20.6%) Pearson Chi<br />
Square = 0.001<br />
2 nd : 22.89 - 25.13 9 (18.0%) 157 (20.3%)<br />
3 rd : 25.13 - 27.39 16 (32.0%) 149 (19.2%) p value for<br />
trend = 0.474<br />
4 th : 27.39 - 30.32 18 (36.0%) 147 (19.0%)<br />
5 th : > 30.32 3 (6.0%) 162(20.9%)<br />
patients with gastric ulcer. In patients with duodenal<br />
ulcer, risk factors included H.Pylori infection,<br />
smoking, male gender, and living in urban areas<br />
(Tables 6-7).<br />
Table 6: Significant environmental risk factors for gastric ulcer in residents<br />
<strong>of</strong> Ardabil province; results <strong>of</strong> final step <strong>of</strong> multivariable logistic<br />
regression analysis.<br />
Risk Factor OR (95 % CI) p- value<br />
H.pylori infection positive vs. negative 3.1 (2.1 – 4.7) 0.002<br />
Smoking Current vs. non 1.8 (1.1 – 6.8) 0.034<br />
Chronic (> 3 months vs. 2.8 (1.3 – 4.4) 0.019<br />
NSAID intake non or short-term)<br />
Nagelkerke R Square = 0.586, method: Stepwise (Backward likelihood)<br />
Table 7: Significant environmental risk factors for duodenal ulcer in<br />
residents <strong>of</strong> Ardabil province; results <strong>of</strong> final step <strong>of</strong> multivariable<br />
logistic regression analysis.<br />
Risk Factor OR (95 % CI) p -value<br />
H.pylori infection positive vs. negative 5.6 (1.9 – 8.8) 0.001<br />
Smoking Current vs. non 2.3 (1.4 – 6.5) 0.026<br />
Gender Men vs. women 3.6 (1.2 – 5.8) 0.008<br />
Residence Urban vs. Rural areas 1.9 (1.1 – 5.2) 0.039<br />
Nagelkerke R Square = 0.637, method: Stepwise (Backward likelihood)<br />
DISCUSSION<br />
This is the first population-based endoscopic<br />
study in North West <strong>of</strong> Iran that reports PUD prevalence<br />
up to 3.3 and 4.9 percent for gastric and duodenal<br />
ulcers respectively. This rate is substantially<br />
lower than prevalence estimates reported in previous<br />
Asian population-based endoscopic studies. 13-15<br />
As Li et al. 16 found in their systematic investigation<br />
<strong>of</strong> gastrointestinal diseases, the prevalence <strong>of</strong> PUD<br />
in China reaches 17.2% (gastric ulcer: 6.1%; duodenal<br />
ulcer: 13.3%). Also the annual global incidence<br />
rates <strong>of</strong> PUD rates have been reported around<br />
0.1-0.19% for in physician <strong>of</strong>fice-diagnosed PUDs<br />
and 0.03-0.17 for hospitalization records. 17 However,<br />
our findings are more close to European endoscopic<br />
epidemiologic studies, 4,6 as they reported<br />
prevalence rates from 4.1 % (gastric ulcer: 2.0 %;<br />
duodenal ulcer: 2.1 %), 4 to 6.2 % (gastric ulcer: 2.3<br />
%; duodenal ulcer: 3.9 %). 6<br />
Middle East Journal <strong>of</strong> Digestive <strong>Disease</strong>s/ Vol.4/ No.2/ April 2012