Emili Valdero Mora - Universitat de Barcelona
Emili Valdero Mora - Universitat de Barcelona
Emili Valdero Mora - Universitat de Barcelona

Create successful ePaper yourself
Turn your PDF publications into a flip-book with our unique Google optimized e-Paper software.
Cua<strong>de</strong>rnos <strong>de</strong> Economía<br />
Universidad Autónoma <strong>de</strong> Madrid (nueva etapa)<br />
“COMPARING THE MACROECONOMIC INFLUENCE<br />
IN THE JAPANESE AND THE GERMAN<br />
MANUFACTURING PROFITABILITY,<br />
ACORDING TO THE E.U. DATABASE B.A.C.H. (1983-1996)*.”<br />
<strong>Emili</strong> <strong>Val<strong>de</strong>ro</strong> <strong>Mora</strong><br />
Departament <strong>de</strong> Matemàtica Econòmica<br />
<strong>Universitat</strong> <strong>de</strong> <strong>Barcelona</strong> (Spain)<br />
e-mail: eval<strong>de</strong>ro@eco.ub.es<br />
Ramon Tremosa Balcells<br />
Departament <strong>de</strong> Teoria Econòmica<br />
<strong>Universitat</strong> <strong>de</strong> <strong>Barcelona</strong> (Spain)<br />
e-mail: rtremosa@menta.net<br />
Abstract. The E.U. database B.A.C.H. (“Bank for the Accounts of Companies<br />
Harmonized”) homologue the financial aggregated accounts of the enterprises of different<br />
countries collected yearly by the cooperators European Central Banks. Thus, it allows<br />
making comparisons between countries. Due to this information referred to the Net<br />
Operating Assets Profitability of the Japanese and the German manufacturing industry,<br />
which is disposable for fourteen years, it is tried to estimate the influence that some<br />
macroeconomic variables could have had over it. According to some proposals of Hakura<br />
(1998) and Van Ees (1997), in the theoretical mo<strong>de</strong>l it has been consi<strong>de</strong>red as profitability’s<br />
explanatory variables the manufacturing production, the industrial prices (the row<br />
materials ones), the interest rate and the exchange rate. The econometric equations have<br />
been estimated consi<strong>de</strong>ring an initial multiplicative dummies variables mo<strong>de</strong>l.<br />
The results obtained allow establishing a positive relationship between industrial<br />
production and profitability (with a double impact in the German manufacturing than in<br />
the Japanese one). A neutral effect of industrial prices over both profitabilities. An<br />
influence of the raw materials prices for both countries. A negative relationship between<br />
interest rate and profitability (only significant in the German manufacturing) and, finally,<br />
no relationship between the exchange rate and the two consi<strong>de</strong>red profitabilities.<br />
*We would like to thank Teresa Obis-i-Artal, from the Autonomous University of Barcelone, for the<br />
availability of data.<br />
1
1.- THE THEORETICAL MODEL<br />
The analysis starts from a simple mo<strong>de</strong>l, consi<strong>de</strong>ring some contributions: Hakura<br />
(1998) and Van Ees et al. (1997), which previously had found inspiration in Sherman (1991)<br />
and Hall (1990). Thus, the production’s function of the manufacturing industry might be<br />
represented by the following expression:<br />
Xt = X (Kt, Lt, Mt)<br />
in which Xt represents the manufacturing production in the period t, Kt the capital stock, Lt<br />
the quantity of labour and Mt the quantity of raw materials. Thus, the profitability of the<br />
manufacturing industry could be approximated by the following expression:<br />
Rt = ( Xt – wtLt – rtKt – mtMt)<br />
Moreover, starting from an investment function, it is possible to consi<strong>de</strong>r in that<br />
profitability’s expression the influence of the interest rate. As a matter of fact, in the<br />
economic literature the studies that try to relate profitability and investment are abundant.<br />
Even though the correlations between the temporary series of these two variables use to<br />
present quite elevate values, this fact doesn’t imply to establish necessarily a causation<br />
relationship (and also we couldn’t <strong>de</strong>terminate, with accuracy, the direction of the<br />
relationship between profitability and investment).<br />
At any rate, the enterprises’ expectations are the last foundation of investment. It is<br />
reasonable to accept that the benefits obtained in the past can explain the current<br />
investment. But it is used to suggest that, if there were a relationship between profitability<br />
and investment, this would be the direction’s causality, whereas it could be much more<br />
difficult to find evi<strong>de</strong>nces in the other sense. Thus, the profitability is contemplated in the<br />
mo<strong>de</strong>l as one of the manners that companies have of financing its investment.<br />
Finally, and more especially because of the fact that manufacturing industries sell a<br />
consi<strong>de</strong>rable percentage of their production abroad (just as these industries use to import<br />
a part of the raw materials they use), it has been consi<strong>de</strong>red in the mo<strong>de</strong>l the next<br />
expressions:<br />
PX = EP* ; mt = Emt*<br />
which reveal the role that the exchange rate, E, has in linking the prices of the national<br />
manufacturing output (PX) in front of the prices of the other European manufacturing<br />
industries (P*). Moreover, E also facilitates the connection between the national raw<br />
material prices in the period t (mt) with the same prices and in the same period of another<br />
country (mt*).<br />
The sequence started by an exchange rate variation establishes that an appreciation<br />
of the national currency would cause a loss of competitiveness. This gain in the value of a<br />
currency would damage the national production, and would also have negative effects in<br />
2
the national manufacturing industry’s profitability. Moreover, if the exchange rate suffers<br />
<strong>de</strong>preciation, that loss of the national currency would improve the competitiveness: in this<br />
case, it would happen the inverse sequence, improving the national manufacturing<br />
production and also the national manufacturing profitability.<br />
Thus, for to estimate the profitability’s function it has been consi<strong>de</strong>red the following<br />
expression:<br />
Rt = ϑ0 +ϑ1Xt +ϑ2Pt + ϑ3Mt + ϑ4It + ϑ5Et +Ut<br />
The notation of endogenous and exogenous variables consi<strong>de</strong>red in the mo<strong>de</strong>l is:<br />
R, profitability JAP, Japan<br />
Q, industrial production GER, Germany<br />
P, industrial prices (outputs)<br />
M, raw material prices (inputs)<br />
I, interest rate<br />
E, exchange rate<br />
Thus, it is tried to estimate the influence on the Net Assets Operating Profitability,<br />
as it is provi<strong>de</strong>d by the B.A.C.H. European database (see Appendix 1), that would be<br />
originated on the evolution of the <strong>de</strong>scribed variables, which belong to the macroeconomic<br />
ambit. The E.U. database B.A.C.H. (“Bank for the Accounts of Companies Harmonised”)<br />
homologue the financial aggregated accounts of the enterprises of different countries<br />
collected yearly by the co-operators European Central Banks. Thus, it allows making<br />
comparisons between countries<br />
2.- STATISTICAL SOURCES AND VARIABLES DEFINITION<br />
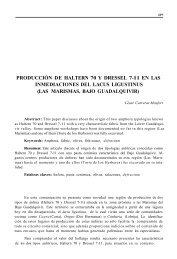
The <strong>de</strong>pen<strong>de</strong>nt variable of the mo<strong>de</strong>l will be profitability of manufacturing<br />
industry. This profitability, calculated homogeneously for Japan and Germany (see<br />
Graphic 1) according to the B.A.C.H. Project (see Appendix 2), is disposable for the period<br />
1983-1996.<br />
In accordance with the in<strong>de</strong>pen<strong>de</strong>nt variables, for the industrial production and the<br />
industrial prices there has been elaborated two in<strong>de</strong>x, calculated from the growth rate<br />
series supplied by the “Historical Statistics” (O.E.C.D.).<br />
The raw material in<strong>de</strong>x, on the other hand, comes from “The Economist”, and it is<br />
referred to the industrial, non-energetic raw material. This is a global in<strong>de</strong>x, because of<br />
these raw material have to be consi<strong>de</strong>red as homogeneous goods in a global scale (mineral<br />
3
and vegetal raw materials); thus, the value of this in<strong>de</strong>x is the same for all the countries<br />
(the value 100 starts in 1990).<br />
For the interest rate, it has been consi<strong>de</strong>red in every country an annual average of<br />
the different intervention rate, which are periodically <strong>de</strong>termined by every Central Bank<br />
(in the periodic meetings with the banks and saving banks to lend and to auction them<br />
money; source: “Historical Statistics”, O.E.C.D.).<br />
Finally, for the exchange rate it has been taken for the European currencies the<br />
reference of the US dollar. Thus, it has been consi<strong>de</strong>red an annual average of every<br />
exchange rate (source: “Historical Statistics”, O.E.C.D.).<br />
3.- VARIABLES TRANSFORMATION<br />
Most of the economic series use to present trend in a temporal horizon. Before<br />
specifying the econometric mo<strong>de</strong>ls, and having analysed the variables, it has been<br />
<strong>de</strong>tected a growing trend in the profitability, the industrial production, the industrial<br />
prices, the raw material prices and the interest rate. Because of this, these variables have<br />
been differentiated once.<br />
Thus, it has been consi<strong>de</strong>red the variations, in terms of first difference, of the<br />
profitability and the industrial production, the industrial prices, the raw material prices<br />
in<strong>de</strong>xes and the interest rate. The variable exchange rate have been also differentiated, for<br />
to estimate the mo<strong>de</strong>l in the same transformation as a whole. In this way, the different<br />
econometric mo<strong>de</strong>ls estimated respond to the following expression:<br />
∆R = f (∆Q, ∆P, ∆M, ∆I, ∆E)<br />
Moreover, there have not been appreciated symptoms in variance’s trend: the<br />
sample is not so long, and the variance doesn’t have enough time to <strong>de</strong>monstrate itself.<br />
4.- METHODOLOGY<br />
Although the disposable information is referred to a short time period (1983-1996),<br />
the availability of data for two countries allows us to surpass the shortness of the sample.<br />
Thus, it has been consi<strong>de</strong>red a pool of data of 28 observations, which has allowed us to<br />
apply panel data techniques.<br />
4
These techniques present the advantage of consi<strong>de</strong>ring, in the econometric<br />
regressions, an individual specific component, by through it is possible to control the<br />
unobservable characteristics of each one of the analysed countries. Thus, every country<br />
can be treated in the conjunct according its own peculiarities (in this case, institutional and<br />
economical). The panel data techniques allow us to contrast some hypothesis of structural<br />
homogeneity between the different countries (samples), which integrate the global sample.<br />
This possibility is make concrete by the equality contrasts of the different estimated<br />
parameters of every country.<br />
It has been proceed, therefore, to specify an initial mo<strong>de</strong>l consi<strong>de</strong>ring multiplicative<br />
dummies variables. Being i the number of countries (i=1,...,m, with m=2), j the number of<br />
exogenous variables (j=1,...,J, with J=5) and t the number of periods (t=1,...,T, with T=14), it<br />
is obtained that 12 [m x (J+1) = (2 x (5+1) = 12] is the initial number of parameters to<br />
estimate, being the total number of observations 28 [m x T = 2 x 13 = 26: the periods are 13,<br />
more specially as the variables have been expressed in differences and it has been lost an<br />
observation]. Thus, the initial mo<strong>de</strong>l to specify is:<br />
∆R<br />
it<br />
=<br />
2<br />
∑<br />
j=<br />
1<br />
µ D<br />
j<br />
i<br />
+<br />
2<br />
∑<br />
j=<br />
1<br />
β<br />
j∆Q<br />
∆Q<br />
D<br />
jt<br />
i<br />
+<br />
2<br />
∑<br />
j=<br />
1<br />
β<br />
j∆P<br />
∆P<br />
D +<br />
jt<br />
i<br />
2<br />
∑<br />
j=<br />
1<br />
β<br />
j∆M<br />
∆M<br />
D<br />
jt<br />
i<br />
+<br />
2<br />
∑<br />
β<br />
∆I<br />
D<br />
+<br />
∑<br />
j∆I<br />
jt i<br />
j= 1<br />
j=<br />
1<br />
2<br />
β<br />
j∆E<br />
∆E<br />
jt<br />
D + U<br />
i<br />
it<br />
In where ϑj−Q is the parameter which measures the influence of the variable −Qt in<br />
the profitability of the country i, and so consecutively. Finally, Di is a dummy variable,<br />
which is <strong>de</strong>fined as follows:<br />
Di = 1 if the consi<strong>de</strong>red country is i (i=j)<br />
Di = 0 if the consi<strong>de</strong>red country isn’t i (i≠j)<br />
The different mo<strong>de</strong>ls have been estimated by Generalised Least Squares<br />
(programme Econometric Views, version 3.0; PC, Pentium II, 300 MHz and memory, 128<br />
Mb of RAM memory).<br />
5
5.- DESCRIPTION AND RESULTS ANALYSIS<br />
It has been estimated the Mo<strong>de</strong>l 1 from the starting expression, consi<strong>de</strong>ring that<br />
there is an in<strong>de</strong>pen<strong>de</strong>nt term (constant) for Japan and Germany:<br />
∆R<br />
it<br />
=<br />
2<br />
∑<br />
j=<br />
1<br />
µ D<br />
j<br />
i<br />
+<br />
2<br />
∑<br />
j=<br />
1<br />
β<br />
j∆Q<br />
∆Q<br />
D<br />
jt<br />
i<br />
+<br />
2<br />
∑<br />
j=<br />
1<br />
β<br />
j∆P<br />
∆P<br />
D<br />
jt<br />
i<br />
+<br />
2<br />
∑<br />
j=<br />
1<br />
β<br />
j∆M<br />
∆M<br />
D<br />
jt<br />
i<br />
+<br />
2<br />
∑<br />
β<br />
∆I<br />
D<br />
+<br />
∑<br />
j∆I<br />
jt i<br />
j= 1<br />
j=<br />
1<br />
2<br />
β<br />
j∆E<br />
∆E<br />
jt<br />
D + U<br />
i<br />
it<br />
Mo<strong>de</strong>l 1<br />
The results of this first estimation have been <strong>de</strong>scribed in Table 1. As it can be<br />
observed, the value of Durbin-Watson statistic is not far from the value 2 (2.677877), which<br />
guarantees the consistence of the estimations (and also the non-existence of autocorrelation<br />
in the perturbations terms).<br />
Observing the t-Stu<strong>de</strong>nt statistic values of industrial production prices of the two<br />
countries, there’s no one of them significant; it could be suggested another mo<strong>de</strong>l without<br />
this explanatory variable. Thus, it has been estimated the Mo<strong>de</strong>l 2, according to the<br />
following expression:<br />
∆R<br />
it<br />
=<br />
2<br />
∑<br />
j=<br />
1<br />
µ<br />
j<br />
D<br />
i<br />
+<br />
2<br />
∑<br />
j=<br />
1<br />
β<br />
j∆Q<br />
∆Q<br />
D<br />
jt<br />
i<br />
+<br />
2<br />
∑<br />
j=<br />
1<br />
β<br />
j∆M<br />
∆M<br />
D<br />
jt<br />
i<br />
+<br />
2<br />
∑<br />
β<br />
∆I<br />
D<br />
+<br />
∑<br />
j∆I<br />
jt i<br />
j= 1<br />
j=<br />
1<br />
2<br />
β<br />
j∆E<br />
∆E<br />
D<br />
jt<br />
i<br />
+ U<br />
it<br />
Mo<strong>de</strong>l 2<br />
The results of the estimation of this second mo<strong>de</strong>l are provi<strong>de</strong>d in Table 2. It is possible to<br />
establish a first hypothesis contrast to select the best of them, more specially as the<br />
<strong>de</strong>scriptive statistics obtained of this second estimation (Mo<strong>de</strong>l 2) are quite similar than<br />
the results supplied by the first estimation (Mo<strong>de</strong>l 1).<br />
6
5.1.- Test of neutrality of the industrial prices in<strong>de</strong>x<br />
In this test it is consi<strong>de</strong>red in the null hypothesis (H0) the nullity of the two<br />
parameters of the explicative variable industrial prices (Mo<strong>de</strong>l 2). The alternative<br />
hypothesis (H1) implies the non-acceptation of the null one (Mo<strong>de</strong>l 1).<br />
H0 : ϑ1−P = ϑ2−P = 0 ➔ Mo<strong>de</strong>l 2<br />
H1 : No H0 ➔ Mo<strong>de</strong>l 1<br />
Being 26 the number of observations (n=26), k the number of parameters of the<br />
Mo<strong>de</strong>l 1 (k=12) and r the number of restrictions (r=2), the statistic F * stated is:<br />
(SSR −SSR<br />
)<br />
0 1 (12.7484 - 11.8360)<br />
F<br />
∗<br />
=<br />
r =<br />
2 = 0.<br />
5396<br />
SSR<br />
11.8360<br />
1<br />
(26 - 12)<br />
(n - k)<br />
Expression in which SSR0 <strong>de</strong>notes the Mo<strong>de</strong>l 1 sum of quadrate errors (null hypothesis)<br />
and SSR1 the same referred to the Mo<strong>de</strong>l 2 (alternative hypothesis). Comparing the<br />
obtained value with an F (2,14), it can not be rejected the null hypothesis (it is accepted the<br />
null one, so the best mo<strong>de</strong>l would be Mo<strong>de</strong>l 2). The Wald test comparing Mo<strong>de</strong>l 2 with<br />
Mo<strong>de</strong>l 1 reinforces this <strong>de</strong>cision: F-statistic=0.871633 (probability of 0.437211) and Chisquare=1.743266<br />
(probability of 0.418268).<br />
Analysing the results of this Mo<strong>de</strong>l 2 it is also observed that there are no significant<br />
estimated parameters for the explicative variable exchange rate. It would be interesting to<br />
consi<strong>de</strong>r, in this way, if it is significant the influence of the exchange rate on the Japanese<br />
and German manufacturing profitabilities. Thus, it has been <strong>de</strong>fined successively the<br />
Mo<strong>de</strong>l 3, which supposes the non-relevance of the parameters linked to the exchange rate.<br />
The expression of this third mo<strong>de</strong>l would be:<br />
∆R<br />
it<br />
=<br />
2<br />
∑<br />
j=<br />
1<br />
µ D<br />
j<br />
i<br />
+<br />
2<br />
∑<br />
j=<br />
1<br />
β<br />
j∆Q<br />
∆Q<br />
jt<br />
D<br />
i<br />
+<br />
2<br />
∑<br />
j=<br />
1<br />
β<br />
j∆M<br />
∆M<br />
D<br />
jt<br />
i<br />
+<br />
2<br />
∑<br />
j=<br />
1<br />
β<br />
j∆I<br />
∆I<br />
D<br />
jt<br />
i<br />
+<br />
U<br />
it<br />
Mo<strong>de</strong>l 3<br />
and its estimation results appear in Table 3. Being the <strong>de</strong>scriptive statistics so similar, it<br />
can be stated a second test of hypothesis.<br />
7
5.2.- Test of neutrality of the exchange rate<br />
In this second test it is consi<strong>de</strong>red in the null hypothesis (H0) the nullity of all the<br />
parameters of the explicative variable exchange rate (Mo<strong>de</strong>l 3). The alternative hypothesis<br />
(H1) implies the non-acceptation of the null one (Mo<strong>de</strong>l 2).<br />
H0 : ϑ1−E = ϑ2−E = 0 ➔ Mo<strong>de</strong>l 3<br />
H1 : No H0 ➔ Mo<strong>de</strong>l 2<br />
Being 26 the number of observations (n=26), k the number of parameters of the<br />
Mo<strong>de</strong>l 2 (k=10) and r the number of restrictions (r=2), the statistic F* stated is:<br />
(SSR −SSR<br />
)<br />
0 1 (14.3974 - 12.7484)<br />
F<br />
∗<br />
=<br />
r =<br />
2 = 1.<br />
0348<br />
SSR<br />
12.7484<br />
1<br />
(26 - 10)<br />
(n - k)<br />
This value has to be compared with an F (2,16) and the null hypothesis can not be rejected<br />
(it is accepted the null one, so the best mo<strong>de</strong>l would be Mo<strong>de</strong>l 3). The Wald test comparing<br />
Mo<strong>de</strong>l 3 with Mo<strong>de</strong>l 1 reinforces this <strong>de</strong>cision: F-statistic=1.189115 (probability of<br />
0.353198) and Chi-square=4.756458 (probability of 0.313211). So there is neutrality, no<br />
influence, of the exchange rate over the manufacturing profitability in Japan and<br />
Germany, and it is accepted the Mo<strong>de</strong>l 3 as a better mo<strong>de</strong>l than the Mo<strong>de</strong>l 2.<br />
In Mo<strong>de</strong>l 3 it is observed that from the estimated parameters for the explicative<br />
variable interest rate there is only one (the German one) which is significant. Thus, it could<br />
be stated another test, consi<strong>de</strong>ring a new mo<strong>de</strong>l, Mo<strong>de</strong>l 4, which eliminates the variable<br />
interest rate only for the Japanese manufacturing industry. The expression of this fourth<br />
mo<strong>de</strong>l would be (country 1=Japan, country 2=Germany):<br />
∆ R<br />
it<br />
=<br />
2<br />
∑<br />
j=<br />
1<br />
µ D<br />
j<br />
i<br />
+<br />
2<br />
∑<br />
j=<br />
1<br />
β<br />
j∆Q<br />
∆Q<br />
jt<br />
D<br />
i<br />
+<br />
2<br />
∑<br />
j=<br />
1<br />
β<br />
j∆M<br />
∆M D + β ∆I<br />
D + U<br />
jt<br />
i<br />
2 ∆I<br />
2t<br />
i<br />
it<br />
Mo<strong>de</strong>l 4<br />
and its estimation results appear in Table 4. Being the <strong>de</strong>scriptive statistics so similar, it<br />
can be stated a third test of hypothesis.<br />
8
5.3.- Test of significance of the interest rate only for the German manufacturing<br />
In the third test the null hypothesis (H0) consi<strong>de</strong>rs the nullity of the parameter for<br />
the explicative variable interest rate for the Japanese manufacturing (Mo<strong>de</strong>l 4). The<br />
alternative hypothesis (H1) is reserved for the opposite case (Mo<strong>de</strong>l 3).<br />
H0 : ϑ1−I = 0 ➔ Mo<strong>de</strong>l 4<br />
H1 : No H0 ➔ Mo<strong>de</strong>l 3<br />
Being 26 the number of observations (n=26), k the number of parameters of the<br />
Mo<strong>de</strong>l 2 (k=8) and r the number of restrictions (r=1), the statistic F* stated is:<br />
(SSR −SSR<br />
)<br />
0 1 (14.3984 - 14.3974)<br />
F<br />
∗<br />
=<br />
r =<br />
1 = 0.<br />
0012002<br />
SSR<br />
14.3974<br />
1<br />
(26 - 8)<br />
(n - k)<br />
The null hypothesis can not be rejected (it is accepted the null one, so the best mo<strong>de</strong>l would<br />
be Mo<strong>de</strong>l 4; in this case, being a test in which there is only one parameter, for choosing the<br />
correct hypothesis it is enough with the information provi<strong>de</strong>d by the statistic t-Stu<strong>de</strong>nt).<br />
The Wald test comparing Mo<strong>de</strong>l 4 with Mo<strong>de</strong>l 1 reinforces this <strong>de</strong>cision: F-<br />
statistic=0.951797 (probability of 0.475171) and Chi-square=4.758987 (probability of<br />
0.445996). Thus, Mo<strong>de</strong>l 4 is a better mo<strong>de</strong>l.<br />
Looking at the results provi<strong>de</strong>d by Mo<strong>de</strong>l 4, it is possible to appreciate a positive<br />
relationship of the in<strong>de</strong>x of raw materials prices on the two manufacturing profitabilities<br />
(in Japan and Germany an increase of those prices would mean more profitability). Being<br />
these two significant estimated parameters so similar (0.052 and 0.049 for Japan and<br />
Germany respectively), it could be consi<strong>de</strong>red another hypothesis, in which those<br />
parameters would be the same for the two manufacturing industries. Thus, it can be<br />
formulated another mo<strong>de</strong>l with the consi<strong>de</strong>ration of this possibility and the expression of<br />
this fifth mo<strong>de</strong>l would be:<br />
∆ R<br />
it<br />
=<br />
2<br />
∑<br />
j=<br />
1<br />
µ D<br />
j<br />
i<br />
+<br />
2<br />
∑<br />
j=<br />
1<br />
β<br />
j∆Q<br />
∆Q<br />
D<br />
jt<br />
i<br />
+ β<br />
∆M<br />
∆M D + β ∆I<br />
D + U<br />
t<br />
i<br />
2 ∆I<br />
2t<br />
i<br />
it<br />
Mo<strong>de</strong>l 5<br />
and its estimation results appear in Table 5. Being the <strong>de</strong>scriptive statistics so similar, it<br />
can be stated a fourth test of hypothesis.<br />
9
5.4.- Test of homogeneity of the raw material prices in<strong>de</strong>x<br />
In this fifth test the null hypothesis (H0) implies the equality of the estimated<br />
parameters, referred to the raw material prices in<strong>de</strong>x (Mo<strong>de</strong>l 5). The alternative hypothesis<br />
(H1) supposes the acceptance of significant differences in the parameters mentioned before<br />
(Mo<strong>de</strong>l 4).<br />
H0 : ϑ1−M = ϑ2−M = ϑ −M ➔ Mo<strong>de</strong>l 5<br />
H1 : No H0 ➔ Mo<strong>de</strong>l 4<br />
Being 26 the number of observations (n=26), k the number of parameters of the<br />
Mo<strong>de</strong>l 2 (k=7) and r the number of restrictions (r=1), the statistic F* stated is:<br />
(SSR −SSR<br />
)<br />
0 1 (14.4143 - 14.3984)<br />
F<br />
∗<br />
=<br />
r =<br />
1 = 0.<br />
02103<br />
SSR<br />
14.3984<br />
1<br />
(26 - 7)<br />
(n - k)<br />
This value has to be compared with an F (1,19). The null hypothesis can not be rejected (it<br />
is accepted the null one, so the best mo<strong>de</strong>l would be Mo<strong>de</strong>l 5. The Wald test comparing<br />
Mo<strong>de</strong>l 5 with Mo<strong>de</strong>l 1 reinforces this <strong>de</strong>cision: F-statistic=0.795798 (probability of<br />
0.586785) and Chi-square=4.774786 (probability of 0.573006). Thus, Mo<strong>de</strong>l 5 is a better<br />
mo<strong>de</strong>l.<br />
Looking at the results provi<strong>de</strong>d by Mo<strong>de</strong>l 5 it could be stated if it is significant the<br />
estimation of the intercept terms (until now they have been estimated by fixed effects). In<br />
this sense, it could be formulated a sixth mo<strong>de</strong>l, in which is not consi<strong>de</strong>red the existence of<br />
the in<strong>de</strong>pen<strong>de</strong>nt terms for to explain the Japanese and German manufacturing<br />
profitability. The expression of this sixth mo<strong>de</strong>l would be:<br />
∆ R<br />
it<br />
=<br />
2<br />
∑<br />
j=<br />
1<br />
β<br />
j∆Q<br />
∆Q<br />
D<br />
jt<br />
i<br />
+ β<br />
∆M<br />
∆M D + β ∆I<br />
D + U<br />
t<br />
i<br />
2 ∆I<br />
2t<br />
i<br />
it<br />
Mo<strong>de</strong>l 6<br />
and its estimation results appear in Table 6. Being the <strong>de</strong>scriptive statistics so similar, it<br />
can be stated a fifth test of hypothesis.<br />
10
5.5.- Test of non existence of intercept terms<br />
In this fifth test the null hypothesis (H0) implies the nullity of the in<strong>de</strong>pen<strong>de</strong>nt<br />
terms in the regressions (Mo<strong>de</strong>l 6). The alternative hypothesis (H1) supposes that it is<br />
significant to inclu<strong>de</strong> these two terms in the regressions (Mo<strong>de</strong>l 5).<br />
H0 : µ1 = 0 ; µ2 = 0 ➔ Mo<strong>de</strong>l 6<br />
H1 : µ1 ≠ 0 ; µ2 ≠ 0 ➔ Mo<strong>de</strong>l 5<br />
Being 26 the number of observations (n=26), k the number of parameters of the<br />
Mo<strong>de</strong>l 2 (k=6) and r the number of restrictions (r=2), the statistic F* stated is:<br />
(SSR −SSR<br />
)<br />
0 1 (32.41401 - 14.41434)<br />
F<br />
∗<br />
=<br />
r =<br />
2 = 12.<br />
4873<br />
SSR<br />
14.4143<br />
1<br />
(26 - 6)<br />
(n - k)<br />
This value has to be compared with an F (2,20), which is smaller than the obtained F*. In<br />
this case it is rejected the null hypothesis. It can be said that Mo<strong>de</strong>l 5 provi<strong>de</strong>s better<br />
estimations than Mo<strong>de</strong>l 6. It is necessary to inclu<strong>de</strong> the intercept terms in the equations<br />
that try to explain the two consi<strong>de</strong>red manufacturing profitabilities .<br />
Thus, for to consi<strong>de</strong>r the intercept terms, it is possible to establish that these terms<br />
are equal for the two consi<strong>de</strong>red countries. It has been <strong>de</strong>fined another mo<strong>de</strong>l, Mo<strong>de</strong>l 7, in<br />
which it is reflected this supposition. The expression of this seventh mo<strong>de</strong>l would be:<br />
∆ R<br />
it<br />
= µ +<br />
2<br />
∑<br />
j=<br />
1<br />
β<br />
j∆Q<br />
∆Q<br />
jt<br />
D<br />
i<br />
+ β<br />
∆M<br />
∆M D + β ∆I<br />
D + U<br />
t<br />
i<br />
2 ∆I<br />
2t<br />
i<br />
it<br />
Mo<strong>de</strong>l 7<br />
and its estimation results appear in Table 7. Being the <strong>de</strong>scriptive statistics so similar, it<br />
can be stated a sixth test of hypothesis.<br />
11
5.6.- Test of a common intercept for both manufacturing industries<br />
In this sixth test the null hypothesis (H0) implies the equality of the in<strong>de</strong>pen<strong>de</strong>nt<br />
terms in the regressions (Mo<strong>de</strong>l 7). The alternative hypothesis (H1) is reserved for the<br />
opposite case (Mo<strong>de</strong>l 6).<br />
H0 : µ1 = µ2 ➔ Mo<strong>de</strong>l 7<br />
H1 : µ1 ≠ µ2 ➔ Mo<strong>de</strong>l 5<br />
Being 26 the number of observations (n=26), k the number of parameters of the<br />
Mo<strong>de</strong>l 2 (k=5) and r the number of restrictions (r=1), the statistic F* stated is:<br />
(SSR −SSR<br />
)<br />
0 1 (15.39889 - 14.41434)<br />
F<br />
∗<br />
=<br />
r =<br />
1 = 1.<br />
3661<br />
SSR<br />
14.4143<br />
1<br />
(26 - 5)<br />
(n - k)<br />
This value has to be compared with an F (1,21). The null hypothesis can not be rejected (it<br />
is accepted the null one, so the best mo<strong>de</strong>l would be Mo<strong>de</strong>l 7. Thus, Mo<strong>de</strong>l 7 is a better<br />
mo<strong>de</strong>l and provi<strong>de</strong>s better results than Mo<strong>de</strong>l 6.<br />
Finally, it is observed that in the results provi<strong>de</strong>d by Mo<strong>de</strong>l 7 the two estimated<br />
parameters for the explicative variable industrial production are significant, and could<br />
suggest the existence of a double impact on the profitability. Thus, the coefficient obtained<br />
for the German manufacturing is nearly the double than the Japanese one, in the sense that<br />
an increase of the industrial production would benefit more the German profitability than<br />
the Japanese one. Thus, it seems interesting to proceed testing this last hypothesis, and for<br />
this reason it has been proposed the estimation of another mo<strong>de</strong>l. Mo<strong>de</strong>l 8, therefore,<br />
reflects this double impact in the parameter of German industrial production. The<br />
expression of this last mo<strong>de</strong>l would be:<br />
∆ R<br />
it<br />
= µ + 2β<br />
1∆Q<br />
∆Q + β ∆Q<br />
+ β ∆M<br />
D + β ∆I<br />
D + U<br />
1t<br />
2 ∆Q<br />
2 t<br />
∆M<br />
t<br />
i<br />
2 ∆I<br />
2t<br />
i<br />
it<br />
Mo<strong>de</strong>l 8<br />
and its estimation results appear in Table 8. Being the <strong>de</strong>scriptive statistics so similar, it<br />
can be stated a last test of hypothesis.<br />
12
5.7.- Test of double impact of the industrial production in the German<br />
manufacturing (than in the Japanese one)<br />
In this seventh and last test, the null hypothesis (H0) reflects that the German<br />
parameter of the explicative variable industrial production is exactly the double than the<br />
Japanese one (Mo<strong>de</strong>l 8). The alternative hypothesis (H1) is reserved for another values<br />
(Mo<strong>de</strong>l 7).<br />
H0 : ϑ2∆Q = 2ϑ1∆Q ➔ Mo<strong>de</strong>l 8<br />
H1 : No H0 ➔ Mo<strong>de</strong>l 7<br />
Being 26 the number of observations (n=26), k the number of parameters of the<br />
Mo<strong>de</strong>l 2 (k=5) and r the number of restrictions (r=1), the statistic F* stated is:<br />
(SSR −SSR<br />
)<br />
0 1 (15.3881 - 15.34889)<br />
F<br />
∗<br />
=<br />
r =<br />
1 = 0.<br />
0537<br />
SSR<br />
15.34889<br />
1<br />
(26 - 5)<br />
(n - k)<br />
This value has to be compared with an F (1,21). The null hypothesis can not be rejected (it<br />
is accepted the null one). The Wald test comparing Mo<strong>de</strong>l 8 with Mo<strong>de</strong>l 1 reinforces this<br />
<strong>de</strong>cision: F-statistic=0.699186 (probability of 0.672816) and Chi-square=4.894302<br />
(probability of 0.672860). The best mo<strong>de</strong>l would be Mo<strong>de</strong>l 8, being the best of all stated<br />
mo<strong>de</strong>ls.<br />
6.- VALIDATION AND FINAL MODEL DIAGNOSTIC<br />
Mo<strong>de</strong>l 8 is globally explicative (F statistic = 27.14640 and its probability is 0.000000).<br />
Its predictive capacity is also quite good (R 2 = 0.787315). Individually, all the estimated<br />
parameters present statistics t-Stu<strong>de</strong>nt higher than 2 (taking values between 2.7 and 6.6).<br />
Moreover, Durbin-Watson statistic is 2.351604, closer to 2, so it seems that there’s no autocorrelation<br />
between mo<strong>de</strong>l’s residues.<br />
13
7.- CONCLUSIONS<br />
7.1.- Neutrality of industrial prices and homogeneity of the raw materials prices<br />
for both manufacturing industries<br />
In test 5.1 it has been proved the neutrality of the industrial prices over the<br />
respective manufacturing profitabilities. There is some recent experience and consens<br />
about this fact, in the sense that the benefits of enterprises, which have recovered quickly<br />
in the years 1994-96, have not generated inflation in the European countries (Trigo, 1995;<br />
Tremosa&<strong>Val<strong>de</strong>ro</strong>, 1999).<br />
In test 5.4 it has been analised the homogeneity significance of the raw material<br />
prices obtained for Japanese and German manufacturing. The result interpretation means<br />
that when prices’ in<strong>de</strong>x increases 1 point, both manufacturing profitability’s accelerate<br />
0.051 points. In the case of Germany, it is the unique European country that is selfsufficient,<br />
in terms of the raw materials that are used in the manufacturing industries<br />
(especially mineral materials). This would be the cause by the way an increase of those<br />
materials would affect (positively) the German’s manufacturing profitability. Moreover,<br />
Japan is not a self-sufficient country as German is in terms of raw materials, but Japanese<br />
manufacturing multinationals control, in many manufacturing subsections, the whole<br />
production process (from extraction till selling and marketing). Thus, an increase of raw<br />
materials price doesn’t damage their profit and loss accounts, as it happens in all the rest<br />
of the European manufacturing industries.<br />
7.2.- Neutrality of the exchange rate for both manufacturing industries<br />
In test 5.2 it has been observed that estimated parameters for the explicative<br />
variable exchange rate are not significant for both manufacturing industries. It means that<br />
the evolution of the exchange rate doesn’t affect Japanese and German profitability. It<br />
seems that both profitabilities are protected in front of an appreciation of the Yen or the<br />
Deutsche Mark. It is important to notice that, since 1945, Japanese and German currencies<br />
have been appreciating itselfs in front many other currencies, and both tra<strong>de</strong> balances<br />
have been traditionally positive (with few exceptions). In front of the behaviour observed<br />
for other European manufacturing profitabilities, which are quite sensitive to appreciation<br />
or <strong>de</strong>preciation (the French one would be the most sensitive: Tremosa&<strong>Val<strong>de</strong>ro</strong>, 1999), the<br />
exchange rate is not a significant explicative variable for Japanese and German<br />
manufacturing profitabilities.<br />
14
7.3.- Unequal impact of monetary policy<br />
In test 5.3 it has been <strong>de</strong>scribed the significance of the interest rate only in the<br />
German manufacturing profitability. The interpretation of the estimated parameter of that<br />
variable implies that an increase of 1 point of German interest rate would disaccelerate<br />
German profitability in 0.6534 points. In this case, German manufacturing is less sensitive<br />
than other European manufacturing, in therms of presenting this negative relationship<br />
between interest rate and industries profitability (the French one would be again the most<br />
sensitive: Tremosa&<strong>Val<strong>de</strong>ro</strong>, 1999). In spite of this, German benefits haven’t been so much<br />
affected in front of variations of the price of money: in the last thirty years, German<br />
competitiveness has been based in constant innovation, growth in productivity and<br />
continuos reductions in production’s cost. Thus, German industry has been able to absorb<br />
quickly an increase of its interest rate, as it happened when Bun<strong>de</strong>sbank raised it from<br />
4.5% to 8.5% between 1990 and 1992 (for to finance German monetary and economic<br />
unification).<br />
For Japanese manufacturing profitability it has been found no significance for the<br />
interest rate. In the consi<strong>de</strong>red period, the price of money in Japan has been <strong>de</strong>creasing<br />
consi<strong>de</strong>rably, as far as getting through the liquidity catch: for very low levels of interest<br />
rate, economic agents don’t respond to its variations (monetary policy is not effective). In<br />
addition of this, what has been said for German manufacturing is also good for the<br />
Japanese one: Japanese competitiveness has been also based in innovation and<br />
productivity. Variations of interest rate (and exchange rate) have been successfully<br />
absorbed for both industries production systems.<br />
7.4.- Double impact of the industrial production in the German manufacturing<br />
(than in the Japanese one)<br />
In test 5.7 it has been proved the significance of the two estimated parameters of the<br />
industrial production, having a positive relationship with both profitabilites. Mo<strong>de</strong>l 8<br />
results suggest that for every point of increase of the industrial production in<strong>de</strong>x, the<br />
acceleration of profitability would be of 0.161632 and 0.323264 points (in Japanese and<br />
German manufacturing, respectively). It is also interesting to consi<strong>de</strong>r the double impact<br />
observed for the German manufacturing: it means a higher <strong>de</strong>pen<strong>de</strong>nce of German<br />
profitability to the German industrial production’s evolution. Moreover, Japanese<br />
profitability appears with a lower sensibility, which implies a lower negative impact in<br />
case of output’s recessions.<br />
15
TABLE 1 – MODEL 1<br />
DESCRIPTIVE STATISTICS AND ESTIMATED PARAMETERS<br />
SSR R 2 D-W F*<br />
11.83600 0.850469 2.677877 8.847359<br />
Depen<strong>de</strong>nt Variable: Profitability<br />
Explicative<br />
Variables<br />
Estimated<br />
parameters<br />
Standard<br />
<strong>de</strong>viation<br />
t of<br />
Stu<strong>de</strong>nt<br />
C Jap (Fixed effects) -0.616171<br />
C Ger (Fixed effects) -1.551884<br />
Q Jap 0.140850 0.051288 2.746261<br />
Q Ger 0.366911 0.085475 4.292619<br />
P Jap -0.284477 0.234059 -1.215409<br />
P Ger 0.250104 0.484889 0.515797<br />
M Jap 0.053630 0.014415 3.720355<br />
M Ger 0.048936 0.025584 1.912755<br />
I Jap 0.040581 0.240775 0.168544<br />
I Ger -0.937004 0.400358 -2.340414<br />
E Jap 0.032166 0.016880 1.905602<br />
E Ger -0.139262 2.412916 -0.05771<br />
TABLE 2 – MODEL 2<br />
DESCRIPTIVE STATISTICS AND ESTIMATED PARAMETERS<br />
SSR R 2 D-W F*<br />
12.74840 0.830323 2.639573 11.8527<br />
Depen<strong>de</strong>nt Variable: Profitability<br />
Explicative<br />
Variables<br />
Estimated<br />
parameters<br />
Standard<br />
<strong>de</strong>viation<br />
t of<br />
Stu<strong>de</strong>nt<br />
C Jap (Fixed effects) -0.661728<br />
C Ger (Fixed effects) -1.160343<br />
Q Jap 0.139164 0.052776 2.636873<br />
Q Ger 0.378628 0.078530 4.821428<br />
M Jap 0.058801 0.014178 4.147388<br />
M Ger 0.053119 0.023125 2.297049<br />
I Jap -0.080313 0.225714 -0.355818<br />
I Ger -0.810273 0.301250 -2.689702<br />
E Jap 0.015515 0.010150 1.528496<br />
E Ger 0.922640 1.199322 0.769301<br />
16
TABLE 3 – MODEL 3<br />
DESCRIPTIVE STATISTICS AND ESTIMATED PARAMETERS<br />
SSR R 2 D-W F*<br />
14.39746 0.798789 2.509481 14.39746<br />
Depen<strong>de</strong>nt Variable: Profitability<br />
Explanatory<br />
Variables<br />
Estimated<br />
parameters<br />
Standard<br />
<strong>de</strong>viation<br />
t of<br />
Stu<strong>de</strong>nt<br />
C Jap (Fixed effects) -0.776785<br />
C Ger (Fixed effects) -1.209711<br />
Q Jap 0.143670 0.056470 2.544160<br />
Q Ger 0.373834 0.076487 4.887558<br />
M Jap 0.052742 0.014588 3.615423<br />
M Ger 0.049147 0.022024 2.231524<br />
I Jap 0.010636 0.233335 0.045582<br />
I Ger -0.789564 0.293162 -2.693269<br />
TABLE 4 – MODEL 4<br />
DESCRIPTIVE STATISTICS AND ESTIMATED PARAMETERS<br />
SSR R 2 D-W F*<br />
14.39842 0.798766 2.511610 18.85431<br />
Depen<strong>de</strong>nt Variable: Profitability<br />
Explanatory<br />
Variables<br />
Estimated<br />
parameters<br />
Standard<br />
<strong>de</strong>viation<br />
t of<br />
Stu<strong>de</strong>nt<br />
C Jap (Fixed effects) -0.786968<br />
C Ger (Fixed effects) -1.209711<br />
Q Jap 0.145587 0.036672 3.969957<br />
Q Ger 0.373834 0.074447 5.021488<br />
M Jap 0.052499 0.013224 3.969901<br />
M Ger 0.049147 0.021427 2.292673<br />
I Ger -0.789564 0.285343 -2.767070<br />
17
TABLE 5 – MODEL 5<br />
DESCRIPTIVE STATISTICS AND ESTIMATED PARAMETERS<br />
SSR R 2 D-W F*<br />
14.41436 0.798580 2.491830 26.43171<br />
Depen<strong>de</strong>nt Variable: Profitability<br />
Explanatory<br />
Variables<br />
Estimated<br />
parameters<br />
Standard<br />
<strong>de</strong>viation<br />
t of<br />
Stu<strong>de</strong>nt<br />
C Jap (Fixed effects) -0.786515<br />
C Ger (Fixed effects) -1.208255<br />
Q Jap 0.146027 0.035607 4.101037<br />
Q Ger 0.373834 0.074447 5.021488<br />
M 0.051576 0.010974 4.699786<br />
I Ger -0.779431 0.268215 -2.905999<br />
TABLE 6 – MODEL 6<br />
DESCRIPTIVE STATISTICS AND ESTIMATED PARAMETERS<br />
SSR R 2 D-W F*<br />
32.41401 0.537115 1.311812 8.509344<br />
Depen<strong>de</strong>nt Variable: Profitability<br />
Explanatory<br />
Variables<br />
Estimated<br />
parameters<br />
Standard<br />
<strong>de</strong>viation<br />
t of<br />
Stu<strong>de</strong>nt<br />
Q Jap 0.078795 0.045883 1.717303<br />
Q Ger 0.227553 0.081224 2.801561<br />
M 0.051221 0.016042 3.193031<br />
I Ger -0.376752 0.338672 -1.112439<br />
18
TABLE 7 – MODEL 7<br />
DESCRIPTIVE STATISTICS AND ESTIMATED PARAMETERS<br />
SSR R 2 D-W F*<br />
15.34889 0.788191 2.355772 19.53644<br />
Depen<strong>de</strong>nt Variable: Profitability<br />
Explanatory<br />
Variables<br />
Estimated<br />
parameters<br />
Standard<br />
<strong>de</strong>viation<br />
t of<br />
Stu<strong>de</strong>nt<br />
C -0.891364 0.178270 -5.000070<br />
Q Jap 0.154829 0.034112 4.538916<br />
Q Ger 0.333994 0.062312 5.360028<br />
M 0.051933 0.010916 4.757286<br />
I Ger -0.672032 0.250943 -2.678022<br />
TABLE 8 – MODEL 8<br />
DESCRIPTIVE STATISTICS AND ESTIMATED PARAMETERS<br />
SSR R 2 D-W F*<br />
15.38814 0.787315 2.351604 27.14640<br />
Depen<strong>de</strong>nt Variable: Profitability<br />
Explanatory<br />
Variables<br />
Estimated<br />
parameters<br />
Standard<br />
<strong>de</strong>viation<br />
t of<br />
Stu<strong>de</strong>nt<br />
C -0.897449 0.173628 -5.168807<br />
Q Jap 0.161632 0.024347 6.638765<br />
Q Ger 0.323264 0.048694 6.638682<br />
M 0.051756 0.010678 4.846777<br />
I Ger -0.653498 0.236960 -2.757838<br />
19
APPENDIX 1<br />
LABOUR UNITY COST =<br />
= Staff Costs / Ad<strong>de</strong>d Value<br />
GROSS OPERATING MARGIN =<br />
= (Ad<strong>de</strong>d Value – Staff Costs) / Ad<strong>de</strong>d Value =<br />
= 1- Labour Unity Cost<br />
PRODUCTIVITY OF CAPITAL = RETURN ON ASSETS =<br />
= Ad<strong>de</strong>d Value / Net Operating Assets<br />
GROSS OPERATING PROFITABILITY / NET OPERATING ASSETS =<br />
= Gross Margin x Return on Assets =<br />
= (Gross Operating Margin / Ad<strong>de</strong>d Value) x (Ad<strong>de</strong>d Value / Net Operating Assets) =<br />
= Gross Operating Margin / Net Operating Assets<br />
*Net Operating Assets = Fixed Assets (Lands, Buildings, Machinery) + Stocks + Debtors –<br />
Cumulated Depreciation.<br />
DEPRECIATION =<br />
= Depreciation / Net Operating Assets<br />
NET OPERATING ASSETS PROFITABILITY =<br />
= Gross Operating Profitability - Depreciation =<br />
= (Gross Operating Margin / Net Operating Assets) -<br />
- (Depreciation / Net Operating Assets) =<br />
= Net Operating Margin / Net Operating Assets<br />
Source: Genescà & Salas (1995).<br />
20
APPENDIX 2<br />
B.A.C.H. PROJECT: BALANCE SHEET.<br />
A. Subscribed capital unpaid.<br />
C. Fixed assets.<br />
D. Current assets.<br />
C.1. Intangible fixed assets.<br />
C.1.1. Formation expenses.<br />
C.1.5. Other intangible fixed assets.<br />
C.2. Tangible fixed assets.<br />
C.2.1. Land and buildings.<br />
C.2.2. Plant and machinery.<br />
C.2.3. Other fixtures.<br />
C.2.4. Payments on account and assets in construction.<br />
C.3. Financial fixed assets.<br />
C.3.1. Shares and participating interests.<br />
C.8. Other financial fixed assets.<br />
D.1. Stocks.<br />
D.1.1. Raw materials and consumables.<br />
D.1.4. Payments on account.<br />
D.1.5. Other stocks.<br />
D.2. Debtors.<br />
D.2.1. Tra<strong>de</strong> <strong>de</strong>btors.<br />
D.2.7. Other <strong>de</strong>btors.<br />
D.3. Current investments.<br />
D.4. Cash at bank and in hand.<br />
E. Prepayments and accrued income.<br />
A+C+D+E = ASSETS // LIABILITIES = F+I+J+K+L.<br />
21
F. Creditors: amounts becoming due and payable within one year.<br />
F.2 Amounts owed to credit institutions.<br />
F.3. Payments on account of or<strong>de</strong>rs.<br />
F.4. Tra<strong>de</strong> creditors.<br />
F.10. Other creditors.<br />
F10.1. Other financial creditors.<br />
F10.2. Other non financial creditors.<br />
I. Creditors: amounts becoming due and payable after more than one year.<br />
I.1. Debenture loans.<br />
I.2. Amounts owed to credit institutions.<br />
I.4. Tra<strong>de</strong> creditors.<br />
I.10. Other creditors.<br />
I.10.1. Other financial creditors.<br />
I.10.2. Other non financial creditors.<br />
J. Provisions for liabilities and charges.<br />
J.1. Provisions for pensions and similar obligations.<br />
J.4. Other provisions.<br />
K. Accruals and <strong>de</strong>ferred income.<br />
L. Capital and reserves.<br />
L.1. Subscribed capital.<br />
L.2. Share premium account.<br />
L.3. Revaluation reserve.<br />
L.4. Reserves.<br />
L.5. Profit / loss brougth forward.<br />
L.6. Profit / loss for the year.<br />
22
B.A.C.H. PROJECT: PROFIT AND LOSS ACCOUNT.<br />
1. Net turnover.<br />
2.Variation in stocks of finished goods and work in progress.<br />
3. Capitalised production.<br />
4. Other operating income.<br />
S. Total operating income = 1+2+3+4.<br />
5. Costs of materials and consumables.<br />
5.a. Raw materials and consumables.<br />
5.b. Other external charges.<br />
8. Other operating charges and taxes.<br />
6.Staff costs.<br />
6.a. Wages and salaries.<br />
6.b. Social security costs.<br />
R. Total operating charges = 5+8.<br />
T. Ad<strong>de</strong>d value BACH = S-5-8.<br />
U. Gross operating profit = T-6.<br />
7. Value adjustements on non financial assets.<br />
7.a. Depreciation in intangible and tangible fixed assets.<br />
7.c. Other value adjustments and provisions.<br />
V. Net operating profit = U-7.<br />
9/11. Financial income.<br />
12. Value adjustment on financial assets.<br />
13. Interest and similar charges.<br />
13.a. Interest paid on financial <strong>de</strong>bts.<br />
13.b. Other financial charges.<br />
16. Extraordinary income.<br />
17. Extraordinary charges.<br />
W. Financial income net of charges = (9/11-12-13)<br />
X. Profit on ordinary activities before taxes = V+W.<br />
Y. Taxes on profit.<br />
1. Profit or loss for the financial year.<br />
23
GRAPHIC 1<br />
JAPANESE AND GERMAN MANUFACTURING INDUSTRY<br />
NET ASSETS OPERATING<br />
PROFITABILITY<br />
16,00<br />
14,00<br />
12,00<br />
10,00<br />
8,00<br />
6,00<br />
4,00<br />
2,00<br />
0,00<br />
83 84 85 86 87 88 89 90 91 92 93 94 95 96<br />
Japanese<br />
Profitability<br />
German<br />
Profitability<br />
YEARS<br />
24
REFERENCES<br />
ARGIMON, I.; GONZALEZ-PÁRAMO, J.M. & ROLDÁN, J.M. (1997): Evi<strong>de</strong>nce of public<br />
spending crowding-out from a panel of O.E.C.D. countries. Applied Economics, 29,<br />
1001-1010.<br />
B.A.C.H. PROJECT (1997): Financial Aggregated Accounts, European Union (in<br />
cooperation with the Autonomous University of Barcelone and the Catalan<br />
Government, “Generalitat <strong>de</strong> Catalunya”).<br />
EUROPEAN ECONOMY (1994): “Financial situation of industrial enterprises: costs,<br />
profitability and financing”. Supplement A, n. 1.<br />
GENESCÀ, E. (1996): “La empresa catalana: rentabilidad y estructura financiera”. La<br />
industria en España y Catalunya, 139-158. Editorial Columna i Comissió Obrera<br />
Nacional <strong>de</strong> Catalunya, <strong>Barcelona</strong>.<br />
GENESCÀ, E. & SALAS, V. (1995): “Convergencia microeconómica España-Europa (1982-<br />
1992)”. Papeles <strong>de</strong> Economía Española, 63, 146-163. Fundación F.I.E.S. <strong>de</strong> la C.E.C.A.,<br />
Madrid.<br />
GENESCÀ, E. & SALAS, V. (1994): “Factors <strong>de</strong> costos i diferenciació en la competitivitat<br />
<strong>de</strong> l’empresa catalana”. L’economia catalana davant <strong>de</strong>l canvi <strong>de</strong> segle, Fundación Banco<br />
Bilbao Vizcaya, 547-565.<br />
HAKURA, D.S. (1998): “The effects of European economic integration on the profitability<br />
of industries”, International Monetary Fund Institute (IMF Working Paper WP/98/85).<br />
HALL, R.E. (1990): “The relation between price and marginal cost in United States<br />
industry”, Journal of Political Economy, volum 96, número 5, 921-947.<br />
RAYMOND, J.L. (1995): “Análisis <strong>de</strong>l ciclo económico”. Papeles <strong>de</strong> Economía Española, 62, 2-<br />
36. Fundación F.I.E.S. <strong>de</strong> la C.E.C.A., Madrid.<br />
SHERMAN, H. J. (1991): The Business Cycle. Capítols 12 (232-247) i 16 (317-339).<br />
Princenton University Press, Princenton, New Jersey.<br />
TREMOSA, R. & VALDERO, E. (1999): “Macroeconomic influence in the European<br />
manufacturing profitability, according to the E.U. database B.A.C.H. (1983-1995”,<br />
presentend in ERSA’99 (39 th Congress).<br />
TRIGO, J. (1997): “Márgenes empresariales, inflación y recuperación económica”. La<br />
Economía Española: el camino hacia el mercado, 17-43. Ediciones Gestión 2000, SA,<br />
<strong>Barcelona</strong>.<br />
TRIGO, J. (1994): La empresa española. Economía y empresa en España, 229-269. Ediciones<br />
Gestión 2000, SA. <strong>Barcelona</strong>.<br />
VAN EES, H.; KUPER, G. & STERKEN, E. (1997): “Investment, finance and the business<br />
cycle: evi<strong>de</strong>nce from the Dutch manufacturing sector”. Cambridge Journal of<br />
Economics, 21, 395-407.<br />
25
ZABALZA, A. (1995): “Thirty years of spanish economic growth: the role of private and<br />
public sectors”, presented in “Twenty yeas of iberian <strong>de</strong>mocracy: an assessment”, 7-9th<br />
april, 1998, Harvard University.<br />
26