Godinez Fundamental High School - Santa Ana Unified School District
Godinez Fundamental High School - Santa Ana Unified School District
Godinez Fundamental High School - Santa Ana Unified School District

Create successful ePaper yourself
Turn your PDF publications into a flip-book with our unique Google optimized e-Paper software.
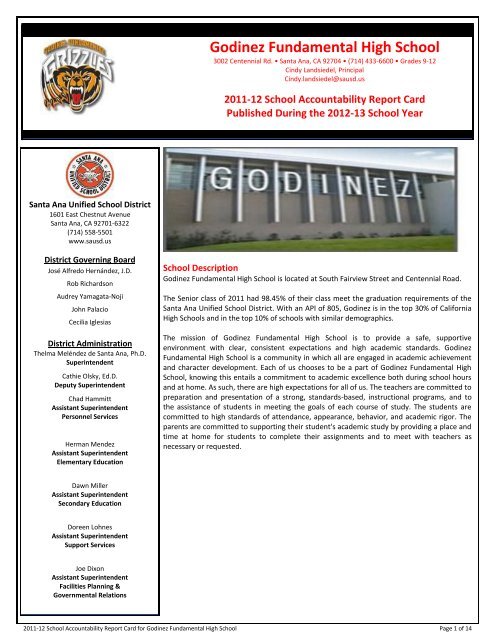
<strong>Godinez</strong> <strong>Fundamental</strong> <strong>High</strong> <strong>School</strong><br />
3002 Centennial Rd. • <strong>Santa</strong> <strong>Ana</strong>, CA 92704 • (714) 433-6600 • Grades 9-12<br />
Cindy Landsiedel, Principal<br />
Cindy.landsiedel@sausd.us<br />
---- ----<br />
2011-12 <strong>School</strong> Accountability Report Card<br />
Published During the 2012-13 <strong>School</strong> Year<br />
<strong>Santa</strong> <strong>Ana</strong> <strong>Unified</strong> <strong>School</strong> <strong>District</strong><br />
1601 East Chestnut Avenue<br />
<strong>Santa</strong> <strong>Ana</strong>, CA 92701-6322<br />
(714) 558-5501<br />
www.sausd.us<br />
<strong>District</strong> Governing Board<br />
José Alfredo Hernández, J.D.<br />
Rob Richardson<br />
Audrey Yamagata-Noji<br />
John Palacio<br />
Cecilia Iglesias<br />
<strong>District</strong> Administration<br />
Thelma Meléndez de <strong>Santa</strong> <strong>Ana</strong>, Ph.D.<br />
Superintendent<br />
Cathie Olsky, Ed.D.<br />
Deputy Superintendent<br />
Chad Hammitt<br />
Assistant Superintendent<br />
Personnel Services<br />
Herman Mendez<br />
Assistant Superintendent<br />
Elementary Education<br />
<strong>School</strong> Description<br />
<strong>Godinez</strong> <strong>Fundamental</strong> <strong>High</strong> <strong>School</strong> is located at South Fairview Street and Centennial Road.<br />
The Senior class of 2011 had 98.45% of their class meet the graduation requirements of the<br />
<strong>Santa</strong> <strong>Ana</strong> <strong>Unified</strong> <strong>School</strong> <strong>District</strong>. With an API of 805, <strong>Godinez</strong> is in the top 30% of California<br />
<strong>High</strong> <strong>School</strong>s and in the top 10% of schools with similar demographics.<br />
The mission of <strong>Godinez</strong> <strong>Fundamental</strong> <strong>High</strong> <strong>School</strong> is to provide a safe, supportive<br />
environment with clear, consistent expectations and high academic standards. <strong>Godinez</strong><br />
<strong>Fundamental</strong> <strong>High</strong> <strong>School</strong> is a community in which all are engaged in academic achievement<br />
and character development. Each of us chooses to be a part of <strong>Godinez</strong> <strong>Fundamental</strong> <strong>High</strong><br />
<strong>School</strong>, knowing this entails a commitment to academic excellence both during school hours<br />
and at home. As such, there are high expectations for all of us. The teachers are committed to<br />
preparation and presentation of a strong, standards-based, instructional programs, and to<br />
the assistance of students in meeting the goals of each course of study. The students are<br />
committed to high standards of attendance, appearance, behavior, and academic rigor. The<br />
parents are committed to supporting their student's academic study by providing a place and<br />
time at home for students to complete their assignments and to meet with teachers as<br />
necessary or requested.<br />
Dawn Miller<br />
Assistant Superintendent<br />
Secondary Education<br />
Doreen Lohnes<br />
Assistant Superintendent<br />
Support Services<br />
Joe Dixon<br />
Assistant Superintendent<br />
Facilities Planning &<br />
Governmental Relations<br />
2011-12 <strong>School</strong> Accountability Report Card for <strong>Godinez</strong> <strong>Fundamental</strong> <strong>High</strong> <strong>School</strong> Page 1 of 14
<strong>District</strong> Profile<br />
<strong>Santa</strong> <strong>Ana</strong> <strong>Unified</strong> <strong>School</strong> <strong>District</strong> is the seventh largest district in the state, currently servicing over 57,000 students in grades K-12 and residing in the<br />
city of <strong>Santa</strong> <strong>Ana</strong>. The district currently operates 36 elementary schools, 9 intermediate schools, 7 high schools, 1 alternative high school, 2<br />
continuation schools and 5 charter schools. The student population is comprised of approximately 77.8% enrolled in the Free or Reduced Price Meal<br />
program, 51.3% qualifying for English language learner support, and approximately 9.0% receiving special education services. Our district’s schools<br />
have received California Distinguished <strong>School</strong>s, National Blue Ribbon <strong>School</strong>s, California Model <strong>School</strong>, Title I Academic Achieving <strong>School</strong>s and<br />
Governor’s <strong>High</strong>er Expectations awards in honor of their outstanding school programs. Over 25 schools have received the Golden Bell Award.<br />
Each of <strong>Santa</strong> <strong>Ana</strong> <strong>Unified</strong> <strong>School</strong> <strong>District</strong>’s staff members, parents, and community partners have developed and maintained high expectations to<br />
ensure every student’s intellectual, creative, physical, emotional, and social development needs are met. The district’s commitment to excellence is<br />
achieved through a team of professionals dedicated to delivering a challenging, high quality educational program. Consistent success in meeting<br />
student performance goals is directly attributed to the district’s energetic teaching staff and strong parent and community support.<br />
<strong>District</strong> Mission<br />
We assure well-rounded learning experiences, which prepare our students for success in college and career. We engage, inspire, and challenge all of<br />
our students to become productive citizens, ethical leaders, and positive contributors to our community, country and a global society.<br />
<strong>District</strong> Vision<br />
We will work collaboratively and comprehensively with staff, parents, and the community to strengthen a learning environment focused on raising the<br />
achievement of all students and preparing them for success in college and career.<br />
Opportunities for Parental Involvement<br />
Parents are encouraged to become involved in <strong>Godinez</strong> <strong>Fundamental</strong> <strong>High</strong> <strong>School</strong>'s learning community by volunteering their time,<br />
attending school events, or sharing in the decision-making process. The school welcomes assistance in the classroom, and library and/or<br />
media center on special days. Parents are always invited to help chaperone field trips. <strong>Godinez</strong> <strong>Fundamental</strong> <strong>High</strong> <strong>School</strong> provides a<br />
wide range of opportunities for parents to interact with school staff while supporting their child’s academic efforts; these may include:<br />
• Monthly Parent Coffee Chats<br />
• PTA<br />
• Back to <strong>School</strong> Night<br />
• Booster Clubs<br />
• Open House<br />
• Student performances<br />
• Fundraisers<br />
• College Night<br />
• Parent conferences<br />
• Music/choir and/or theatre performances<br />
• Sports events<br />
• Promotion activities<br />
• Student recognition assemblies<br />
• Parent education training and/or workshops<br />
The following campus organizations provide opportunities for parents to have input on curricular programs, activities, and the design of<br />
the <strong>School</strong>’s Plan:<br />
• <strong>School</strong> Site Council<br />
• English Language Advisory Council<br />
• Parent Teacher Association (PTA)<br />
Parents seeking more information about becoming an active member in the school community may contact the principal or assistant<br />
principal at (714) 433-6600.<br />
<strong>School</strong>-to-home communication is provided in both English and Spanish. Through routine correspondence and special announcements,<br />
parents are kept informed on school news, student activities, schedules, policy changes, and class curriculum updates including the<br />
following formats:<br />
• XTEND or Tell-A-Parent Computerized Phone System<br />
• <strong>School</strong> web site<br />
• Public Service Channel 31 or 51<br />
• <strong>School</strong> and/or Class newsletters<br />
• Flyers<br />
• Letters<br />
• <strong>School</strong> Marquee/Banners<br />
• New Student Orientations<br />
2011-12 <strong>School</strong> Accountability Report Card for <strong>Godinez</strong> <strong>Fundamental</strong> <strong>High</strong> <strong>School</strong> Page 2 of 14
About the SARC<br />
Every school in California is required by state law to publish a <strong>School</strong> Accountability Report Card (SARC), by February 1 of each year. The<br />
SARC contains information about the condition and performance of each California public school. All data are reported for the 2011-12<br />
school-year, unless otherwise indicated. For more information about SARC requirements, see the California Department of Education<br />
(CDE) SARC webpage at www.cde.ca.gov/ta/ac/sa/. For additional information about this school, please contact the school<br />
administration at (714) 433-6600.<br />
Grade Level<br />
Student Enrollment by Grade Level<br />
Number of Students<br />
Gr. 9-- 706<br />
Gr. 10- 706<br />
Gr. 11- 658<br />
Gr. 12- 553<br />
Total-- 2,623<br />
Group<br />
Student Enrollment by Group<br />
Percent of Total Enrollment<br />
Black or African American------- 0.4<br />
American Indian or Alaska Native---<br />
0<br />
----<br />
Asian------- 1.5<br />
Filipino------- 0<br />
Hispanic or Latino------- 97<br />
Native Hawaiian/Pacific Islander 0<br />
Two or More Races 0<br />
Socioeconomically Disadvantaged 84.1<br />
English Learners 21.1<br />
Students with Disabilities 5.5<br />
Average Class Size and Class Size Distribution<br />
Average Class Size<br />
Number of Classrooms*<br />
1-20 21-32 33+<br />
Year 10 11 12 10 11 12 10 11 12 10 11 12<br />
English 34.68 37.1 32.9 10 4 9 12 3 7 106 58 59<br />
Math--- 31.84 30.9 34.9 16 12 3 26 14 10 92 53 61<br />
Science 30.46 32 31.9 16 6 6 43 10 9 76 51 54<br />
SS----- 31.53 35.5 35.5 14 5 4 19 0 2 81 40 44<br />
* Number of classes indicates how many classrooms fall into each size category<br />
(a range of total students per classroom). At the secondary school level, this<br />
information is reported by subject area, English, Math, Science and Social<br />
Science (SS), rather than grade level.<br />
Suspensions and Expulsions<br />
<strong>School</strong> 09-10 10-11 11-12<br />
Suspensions Rate 6.35 4.93 7.36<br />
Expulsions Rate 0.18 0.24 0.00<br />
<strong>District</strong> 09-10 10-11 11-12<br />
Suspensions Rate 12.11 10.14 14.5<br />
Expulsions Rate 0.34 0.25 0.51<br />
* The rate of suspensions and expulsions is calculated by dividing the total<br />
number of incidents by the total enrollment (and multiplying by 100).<br />
<strong>School</strong> Safety Plan<br />
This section provides information about the school’s comprehensive safety plan, including the dates on which the safety plan was last reviewed,<br />
updated, and discussed with faculty; as well as a brief description of the key elements of the plan.<br />
The Comprehensive <strong>School</strong> Site Safety Plan was developed in collaboration with local agencies and the district office to fulfill Senate Bill 187<br />
requirements. Components of this plan include child abuse reporting procedures, teacher notification of dangerous pupil procedures, disaster response<br />
procedures, procedures for safe arrival and departure from school, sexual harassment policy, and dress code policy. The school’s most current safety<br />
plan was reviewed and updated to address the safety plan components and individual responsibilities during the 2011-2012 school year. The <strong>Santa</strong> <strong>Ana</strong><br />
<strong>Unified</strong> <strong>School</strong> <strong>District</strong>’s Board of Trustees reviews the safety plans annually by March 1.<br />
<strong>School</strong> Facility Conditions and Planned Improvements (<strong>School</strong> Year 2012-13)<br />
This section provides information from the most recent Facility Inspection Tool (FIT) data (or equivalent), including:<br />
• Description of the safety, cleanliness, and adequacy of the school facility<br />
• Description of any planned or recently completed facility improvements<br />
• The year and month in which the data were collected<br />
• Description of any needed maintenance to ensure good repair<br />
Year and month in which data were collected: 07/17/12<br />
<strong>School</strong> custodial staff and the district’s maintenance department work together to ensure classrooms and campus grounds are well-maintained and<br />
kept safe and functioning for students, staff, and visitors. Maintenance and Operations (M&O) employs an electronic work order system enabling<br />
school staff to communicate unscheduled maintenance needs, urgent repairs, or special projects. Most of the school's repairs and maintenance<br />
projects are performed by the district’s highly qualified, professional trade specialists. Emergency situations are immediately resolved either by the<br />
school custodian or district maintenance staff, based upon the nature of the situation.<br />
Day and evening custodians work closely as a team and with the principal for routine maintenance, daily custodial duties, and special events<br />
preparations. The principal and day custodian communicate daily to discuss campus cleaning needs and safety concerns. Every morning before school<br />
begins, the custodian, principal, and assistant principal inspect facilities for safety hazards, graffiti, and other conditions that require removal prior to<br />
students and staff entering school grounds.<br />
2011-12 <strong>School</strong> Accountability Report Card for <strong>Godinez</strong> <strong>Fundamental</strong> <strong>High</strong> <strong>School</strong> Page 3 of 14
<strong>School</strong> safety and cleanliness are the custodians’ highest priority and strongly emphasized as a component of their daily routines. Custodians are<br />
trained by M&O’s administrators on proper cleaning procedures, use of chemicals, and use of equipment. The day custodians are responsible for<br />
following an established set of cleaning standards and prioritization procedures for general campus maintenance. The day custodian checks restrooms<br />
twice a day as a proactive measure in keeping facilities well stocked, safe, and sanitary. The evening custodians are responsible for thorough cleaning<br />
of classrooms, office areas, and restrooms. Groundskeepers are dispatched by the district office to perform general maintenance of landscaping,<br />
gardening, sports fields, and irrigation systems.<br />
The most recent facilities inspection at <strong>Godinez</strong> <strong>Fundamental</strong> <strong>High</strong> <strong>School</strong> took place on 07/17/12. <strong>School</strong>s are required by state law to<br />
report the condition of their facilities; the <strong>School</strong> Site Inspection table illustrated in this report identifies the state required inspection<br />
areas and discloses the operational status in each of those areas.<br />
<strong>School</strong> Facility Good Repair Status (<strong>School</strong> Year 2012-13)<br />
This section provides information from the most recent Facility Inspection Tool (FIT) data (or equivalent), including:<br />
• Determination of repair status for systems listed<br />
• Description of any needed maintenance to ensure good repair<br />
• The Overall Rating (bottom row)<br />
System Inspected<br />
Systems:<br />
Gas Leaks, Mechanical/HVAC, Sewer<br />
Interior:<br />
Interior Surfaces<br />
Cleanliness:<br />
Overall Cleanliness, Pest/ Vermin Infestation<br />
Electrical:<br />
Electrical<br />
<strong>School</strong> Facility Good Repair Status<br />
Repair Status<br />
Exemplary Good Fair Poor<br />
[ ] [X] [ ] [ ]<br />
[ ] [X] [ ] [ ]<br />
[ ] [X] [ ] [ ]<br />
[ ] [X] [ ] [ ]<br />
Repair Needed and<br />
Action Taken or Planned<br />
Restrooms/Fountains:<br />
Restrooms, Sinks/ Fountains<br />
Safety:<br />
Fire Safety, Hazardous Materials<br />
Structural:<br />
Structural Damage, Roofs<br />
External:<br />
Playground/<strong>School</strong> Grounds, Windows/<br />
Doors/Gates/Fences<br />
[ ] [X] [ ] [ ]<br />
[ ] [X] [ ] [ ]<br />
[ ] [X] [ ] [ ]<br />
[ ] [X] [ ] [ ]<br />
Overall Rating [X] [ ] [ ] [ ]<br />
Teacher Credentials<br />
<strong>School</strong> 09-10 10-11 11-12<br />
Fully Credentialed 90 100 100<br />
Without Full Credential 0 0 0<br />
Teaching Outside Subject Area 0 0 3<br />
<strong>District</strong>wide 09-10 10-11 11-12<br />
Fully Credentialed ♦ ♦ 2,013<br />
Without Full Credential ♦ ♦ 81<br />
Teacher Misassignments and Vacant Teacher Positions at this <strong>School</strong><br />
<strong>School</strong> 10-11 11-12 12-13<br />
Teachers of English Learners 0 0 1<br />
Total Teacher Misassignments 0 0 2<br />
Vacant Teacher Positions 0 0 0<br />
* “Misassignments” refers to the number of positions filled by teachers who<br />
lack legal authorization to teach that grade level, subject area, student group,<br />
etc.<br />
2011-12 <strong>School</strong> Accountability Report Card for <strong>Godinez</strong> <strong>Fundamental</strong> <strong>High</strong> <strong>School</strong> Page 4 of 14
Professional Development<br />
This section provides information on the number of days provided for professional development and continuous professional growth in the most<br />
recent three year period.<br />
All curriculum and instructional improvement activities at <strong>Santa</strong> <strong>Ana</strong> <strong>Unified</strong> <strong>School</strong> <strong>District</strong> are aligned to the California State Content Standards and<br />
Frameworks. Staff development concentrations are selected and identified based upon student assessment results, NCLB requirements, teacher input,<br />
state content standards, and professional development surveys.<br />
All staff development activities at <strong>Santa</strong> <strong>Ana</strong> <strong>Unified</strong> <strong>School</strong> <strong>District</strong> are focused on increasing student learning and proficiency. During the 2012-2013<br />
school year, our school sponsored three days of staff development. Staff training topics at the individual school sites may have included: Common Core<br />
State Standards, PBIS, Frontloading, Thinking Maps, Guided Language Acquisition Design, effective teaching strategies from Marzano, et al., effective<br />
grading practices, etc.<br />
<strong>Santa</strong> <strong>Ana</strong> <strong>Unified</strong> <strong>School</strong> <strong>District</strong> offers supplemental training and support for new and ongoing program implementation. Training activities take place<br />
throughout the school year, after school, and during the summer and generally focus on curriculum, teaching strategies, and methodologies. During<br />
the 2012-2013 school year, district training opportunities focused on the following:<br />
At the secondary level –<br />
• Language Arts<br />
• AP Training (Advanced Placement)<br />
• SDAIE Training (Specially Designed Academic Instruction In English)<br />
• AVID Training (Advancement Via Individual Determination)<br />
• SALT Training (Systematic Academic Language Tools)<br />
• CTAP Technology Training (California Technology Assistance Project)<br />
• Working with Parents<br />
• GATE Training (Gifted And Talented Education)<br />
• GLAD Training (Guided Language Acquisition Design)<br />
• Special Education<br />
• Data <strong>Ana</strong>lysis and Using Data to Drive Instruction<br />
• Curriculum Mapping<br />
New teachers and teachers not yet fully credentialed are supported by peer coaching and extensive staff development. The BTSA Induction Program<br />
(Beginning Teacher Support and Assistance) is a state-approved program that offers additional support and assistance to newly credentialed teachers.<br />
All new teachers are assigned to a Support Provider (mentor teacher) and provided individualized support over a two-year period. More information<br />
about the BTSA Induction Program is available at http://www.sausd.us/14431028114350867/site/default.asp<br />
To support veteran teachers as well as new teachers to the district, <strong>Santa</strong> <strong>Ana</strong> <strong>Unified</strong> <strong>School</strong> <strong>District</strong> offers Peer Assistance and Review (PAR) which is<br />
easily defined as teachers helping teachers. Experienced and knowledgeable veteran teachers, referred to as Consulting Teachers, provide ongoing<br />
assistance to teachers who need to improve their instructional skills, classroom management strategies, subject knowledge, and/or related aspects of<br />
their teaching performance.<br />
Staff members are encouraged to attend professional workshops and conferences. New teachers, experienced teachers, mentor/ teacher leaders,<br />
administrators, and support staff are encouraged to participate in workshops sponsored by the Orange County Office of Education and courses offered<br />
by community colleges and universities. Classified support staff may receive additional job-related training from vendors, department supervisors, and<br />
district representatives.\<br />
2011-12 <strong>School</strong> Accountability Report Card for <strong>Godinez</strong> <strong>Fundamental</strong> <strong>High</strong> <strong>School</strong> Page 5 of 14
Training and professional development activities attended by our staff members over the past two years include:<br />
• ACSA conference – 6 staff members<br />
• Aeries training (attendance) – all teachers<br />
• AIRUCI conference (atmospheric chemistry department, UCI) – 2 teachers<br />
• Algebra I and Algebra Readiness training (UCI) – 1 teacher<br />
• Algebra 2 curriculum development – 1 teacher<br />
• American Football Coaches Association National Conference – 1 teacher<br />
• AP College Board Workshops – 6 teachers<br />
• AP training, all subject areas (College Board) – 9 teachers<br />
• Association of American French Teachers (AAFT) speaker (Montreal) – 1 teacher<br />
• AVID summer institute – 4 teachers<br />
• AVID training (OCDE) – 12 teachers<br />
• BTSA Support Provider Training – all BTSA support providers<br />
• California Conference for Creating the Healthiest Children in America – 2 teachers<br />
• California League of <strong>High</strong> <strong>School</strong>s Technology Conference – 7 teachers<br />
• California State University Update Conference – 1 counselor<br />
• Coaching Clinic – 30 teachers<br />
• Cognitive coaching (OCDE) – 1 teacher<br />
• College Board training and workshop for grading AP exams -2 teachers<br />
• College Preparatory Mathematics (geometry) week long training with three day follow-up – 1 teacher<br />
• Crisis Counseling (quarterly, OCDE) – 3 staff members<br />
• CUE conference (technology in the classroom) – 8 teachers<br />
• EDI (Explicit Direct Instruction) – 2 teachers<br />
• First aid/CPR training – majority of teachers<br />
• First aid/disaster training -3 teachers<br />
• Gang Intervention workshop (OCDE) – 1 counselor<br />
• GATE training (USC seminar) – 2 teachers<br />
• GK12 UCI science research – 2 teachers<br />
• GLAD training (<strong>District</strong>) – all BTSA participating teachers<br />
• <strong>Godinez</strong> Technology (<strong>District</strong>) – 34 teachers<br />
• Google docs training – 37 teachers<br />
• Hands on Minds on Science – 8 teachers<br />
• History Project (UCI) – 4 teachers<br />
• HIV/AIDS teacher training – 8 teachers<br />
• Human Rights Conference (weekend full of professional development concerning bullying, equality in the classroom, etc.) – 1 teacher<br />
• HYtech conference for alternative energy (Lawrence Labs, Berkeley) – 1 teacher<br />
• International Convention Speaker – 1 teacher<br />
• Learning Disabilities and Possibilities – 1 teacher<br />
• Master’s Programs (current enrollment) – 6 teachers<br />
• Materials Science Camp (CSULB) – 1 teacher<br />
• NEA - Women's Leadership Training Program cadre trainer – 1 teacher<br />
• NSTA conference – 1 teacher<br />
• Pinnacle training (grade book) – all teachers<br />
• Private College Symposium (Tiger Woods Learning Center) – 3 teachers<br />
• Quizdom training – 1 teacher SAUSD web page design – all teachers<br />
• <strong>School</strong> Site Council – 6 teachers per year<br />
• Summer institute for chemistry (UCI) – 2 teachers<br />
• Summer institute for journalism (University of Nevada, Reno) – 1 teacher<br />
• Summer institute for physics (UCI) – 1 teacher<br />
• Summer Study in Quebec – 1 teacher<br />
• Teach Asia (Cal State Fullerton) – 4 teachers<br />
• Teaching Autism teaching authorization – 8 teachers Thinking Maps Trainer Training (title 3 program) – 5 teachers<br />
• Thinking Maps Training (6 hours) – majority of GFHS teachers (by 12/2011)<br />
• UCI Pathways (writing project) – 5 teachers<br />
• UCI writing project conference – 8 teachers (2010); 7 teachers (2011)<br />
• Writing notebooks – 3 teachers<br />
2011-12 <strong>School</strong> Accountability Report Card for <strong>Godinez</strong> <strong>Fundamental</strong> <strong>High</strong> <strong>School</strong> Page 6 of 14
Many teachers actively pursue professional development opportunities that will enrich the classroom experience for our students. We are fortunate to<br />
collaborate with several local universities that offer ongoing outreach opportunities designed to enhance teaching methods. The wide range of<br />
professional development activities listed above include workshops that range from a few hours in the evening to a few weeks during the summer.<br />
1. Content of staff development and numbers of participating (programs, activities)<br />
Meetings are attended by approximately 90 staff members. Rosters are available for each meeting listed below:<br />
• professional expectations, job description, sexual harassment, meeting schedule<br />
• team activities: October 2010, November 2010<br />
• classroom visitation, progress reports<br />
• WASC introduction<br />
• WASC departmental progress update<br />
• WASC data analysis and formation of Critical Academic Needs<br />
• WASC ESLR analysis and planning<br />
• WASC student work analysis: April 2011, May 2011, August 2011<br />
• Second semester procedures and expectations<br />
• CAHSEE training<br />
• CST training<br />
• End of year preparations<br />
• Departmental data analysis and goal setting activities<br />
• Departmental summer reading activities<br />
• WASC home group activity<br />
• WASC focus group activities: August, September (x2), October, November, December 2011.<br />
Currently all <strong>Godinez</strong> teachers are being trained on Common Core State Standards (CCSS). We have a CLAS teacher on site to work with teachers,<br />
model lessons in classrooms, help in lesson design and support teachers as we expand our knowledge and understanding of CCSS and begin to put CCSS<br />
into daily teaching practices.<br />
Core Academic Classes Taught by <strong>High</strong>ly Qualified Teachers<br />
The Federal Elementary and Secondary Education Act (ESEA), also known<br />
as No Child Left Behind (NCLB), requires that core academic subjects be<br />
taught by <strong>High</strong>ly Qualified Teachers, defined as having at least a<br />
bachelor’s degree, an appropriate California teaching credential, and<br />
demonstrated core academic subject area competence. For more<br />
information, see the CDE Improving Teacher and Principal Quality<br />
webpage at: www.cde.ca.gov/nclb/sr/tq/<br />
Percent of Classes In Core Academic Subjects<br />
Core Academic Classes Taught by <strong>High</strong>ly Qualified Teachers<br />
Location of Classes<br />
Taught by <strong>High</strong>ly<br />
Qualified Teachers<br />
Not Taught by <strong>High</strong>ly<br />
Qualified Teachers<br />
This <strong>School</strong> 100 0<br />
<strong>District</strong>wide<br />
All <strong>School</strong>s 99.72 0.28<br />
<strong>High</strong>-Poverty <strong>School</strong>s 99.72 0.28<br />
Low-Poverty <strong>School</strong>s 0 0<br />
* <strong>High</strong>-poverty schools are defined as those schools with student eligibility of<br />
approximately 40 percent or more in the free and reduced price meals<br />
program. Low-poverty schools are those with student eligibility of<br />
approximately 25 percent or less in the free and reduced price meals<br />
program.<br />
Academic Counselors and Other Support Staff at this <strong>School</strong><br />
Number of Full-Time Equivalent (FTE)<br />
Academic Counselor------- 0<br />
Social/Behavioral or Career Development Counselor<br />
Library Media Teacher (Librarian) 0<br />
Library Media Services Staff (Paraprofessional)<br />
Psychologist------- 0<br />
Social Worker------- 0<br />
Nurse------- 0<br />
Speech/Language/Hearing Specialist 0<br />
Resource Specialist------- 0<br />
Other------- 0<br />
Average Number of Students per Staff Member<br />
Academic Counselor-------<br />
* One Full-Time Equivalent (FTE) equals one staff member working full-time;<br />
one FTE could also represent two staff members who each work 50 percent<br />
of full-time.<br />
2011-12 <strong>School</strong> Accountability Report Card for <strong>Godinez</strong> <strong>Fundamental</strong> <strong>High</strong> <strong>School</strong> Page 7 of 14
Level<br />
Expenditures Per Pupil and <strong>School</strong> Site Teacher Salaries<br />
(Fiscal Year 2010-11)<br />
Expenditures Per Pupil<br />
Total Restricted Unrestricted<br />
Average<br />
Teacher<br />
Salary<br />
<strong>School</strong> Site- $5,124 $877 $4,247 $80,306<br />
<strong>District</strong>------ ♦ ♦ $4,101 $80,860<br />
- State------- ♦ ♦ $5,455 $68,835<br />
Percent Difference: <strong>School</strong> Site/<strong>District</strong> 3.6% -0.7%<br />
Percent Difference: <strong>School</strong> Site/ State -22.1% 16.7%<br />
* Supplemental/Restricted expenditures come from money whose use is<br />
controlled by law or by a donor. Money that is designated for specific<br />
purposes by the district or governing board is not considered restricted.<br />
* Basic/Unrestricted expenditures are from money whose use, except for<br />
general guidelines, is not controlled by law or by a donor.<br />
For detailed information on school expenditures for all districts in<br />
California, see the CDE Current Expense of Education & Per-pupil<br />
Spending webpage at www.cde.ca.gov/ds/fd/ec/. For information on<br />
teacher salaries for all districts in California, see the CDE Certificated<br />
Salaries & Benefits webpage at www.cde.ca.gov/ds/fd/cs/. To look up<br />
expenditures and salaries for a specific school district, see the Ed-Data<br />
Web site at: www.ed-data.org.<br />
Teacher and Administrative Salaries (Fiscal Year 2010-11)<br />
Category<br />
<strong>District</strong><br />
Amount<br />
State Average for<br />
<strong>District</strong>s In Same<br />
Category<br />
Beginning Teacher Salary $48,660 $41,455<br />
Mid-Range Teacher Salary $74,308 $66,043<br />
<strong>High</strong>est Teacher Salary $94,284 $85,397<br />
Average Principal Salary (ES) $112,475 $106,714<br />
Average Principal Salary (MS) $112,695 $111,101<br />
Average Principal Salary (HS) $124,829 $121,754<br />
Superintendent Salary $241,718 $223,357<br />
Percent of <strong>District</strong> Budget<br />
Teacher Salaries 41% 39%<br />
Administrative Salaries 4% 5%<br />
* For detailed information on salaries, see the CDE Certificated Salaries &<br />
Benefits webpage at www.cde.ca.gov/ds/fd/cs/.<br />
Types of Services Funded (Fiscal Year 2011-12)<br />
This section provides specific information about the types of programs and services available at the school that support and assists students. For<br />
example, this narrative may include information about supplemental educational services related to the school’s federal Program Improvement (PI)<br />
status.<br />
In addition to general fund state funding, <strong>Santa</strong> <strong>Ana</strong> <strong>Unified</strong> <strong>School</strong> <strong>District</strong> receives state and federal categorical funding for special programs. For the<br />
2011-12 school year, the <strong>District</strong> received approximately $3,769 per student in federal, state, and local aid for categorical, special education, and<br />
support programs, including but not limited to:<br />
• Bilingual Education<br />
• Beginning Teacher & Support (BTSA)<br />
• California Child Nutrition Education<br />
• Carl Perkins<br />
• Class Size Reduction<br />
• Comprehensive <strong>School</strong> Reform<br />
• Drug Free <strong>School</strong>s<br />
• Even Start Family Literacy<br />
• Gifted & Talented Education<br />
• Head Start<br />
• Instructional Materials<br />
• Migrant Education<br />
• Peer Assistance & Review<br />
• Regional Occupational Program<br />
• Safe <strong>School</strong>s and Healthy Students<br />
• Special Education<br />
• Title I, II, III, IV, & VII<br />
• Vocational Education<br />
• Reading First<br />
2011-12 <strong>School</strong> Accountability Report Card for <strong>Godinez</strong> <strong>Fundamental</strong> <strong>High</strong> <strong>School</strong> Page 8 of 14
Quality, Currency, Availability of Textbooks and Instructional Materials (<strong>School</strong> Year 2012-13)<br />
This section describes whether the textbooks and instructional materials used at the school are from the most recent adoption; whether there are<br />
sufficient textbooks and instruction materials for each student; and information about the school’s use of any supplemental curriculum or non-adopted<br />
textbooks or instructional materials.<br />
Year and month in which data were collected: October 9, 2012<br />
All textbooks used in the core curriculum throughout <strong>Santa</strong> <strong>Ana</strong> <strong>Unified</strong> <strong>School</strong> <strong>District</strong> are aligned to the California Content Standards and<br />
Frameworks. Instructional materials for grades K-8 are selected from the state’s most recent list of standards-based materials and adopted by the State<br />
Board of Education. Instructional materials for grades 9-12 are standards based and approved by the district’s Board of Trustees. On October 9, 2012,<br />
the <strong>Santa</strong> <strong>Ana</strong> <strong>Unified</strong> <strong>School</strong> <strong>District</strong>’s Board of Trustees held a public hearing to certify the extent to which textbooks and instructional materials have<br />
been provided to students. The Board of Trustees adopted Resolution No 12/13-2940 which certifies as required by Education Code §60119 that for<br />
the 2012-2013 school year, the <strong>Santa</strong> <strong>Ana</strong> <strong>Unified</strong> <strong>School</strong> <strong>District</strong> has provided sufficient textbooks or instructional materials, or both, that are<br />
consistent with the content and cycles of the curriculum frameworks adopted by the State Board, to each pupil enrolled in a foreign language or health<br />
course, and that sufficient laboratory science equipment applicable to science laboratory courses offered in grades 9-12, inclusive, is available to pupils.<br />
Year Adopted <strong>High</strong> <strong>School</strong> Textbook Publisher Grades<br />
Mathematics<br />
2008 Pearson/Prentice Hall, Algebra Readiness 9-12<br />
2008 Pearson/Prentice Hall, Algebra 1 9-12<br />
2008 Holt, Rinehart, Winston, Geometry 9-12<br />
2008 Pearson/Prentice Hall, Algebra 2 9-12<br />
2008 McDougal Littell, Precalculus with Limits: A Graphing Approach 9-12<br />
2008 McDougal Littell, Calculus of a Single Variable 9-12<br />
2008 Addison Wesley, College Algebra-Elementary and Intermediate Algebra Concepts and Applications 9-12<br />
2008 Prentice Hall, Probability & Statistics 9-12<br />
Language Arts<br />
2009 Pearson Longman, Keystone (KL, BB, D, E F) 9<br />
2002 Holt, Rinehart, Winston Literature & Language Arts 9-12<br />
Science(s)<br />
2007 Holt Earth Science 9-12<br />
2007 Glencoe Biology 9-12<br />
2007 Prentice Hall Chemistry 9-12<br />
2007 Prentice Hall Essentials of Human <strong>Ana</strong>tomy & Physiology 9-12<br />
2007 Prentice Hall Conceptual Physics 9-12<br />
2007 Holt-Mcdougal, Physics Honor – Algebra/Trig 12<br />
Social Science<br />
2006 McDougal-Littell Modern World History 9-12<br />
2006 Prentice Hall American Government - Magruders 9-12<br />
2006 Prentice Hall Economics: Principles in Action 9-12<br />
2006 McDougal-Littell The Americans - Reconstruction to the 21st Century 9-12<br />
2006 Glencoe/McGraw-Hill, Psychology – Understanding Psychology 9-12<br />
2006 Holt. Sociology – The Study of Human Relationships 9-12<br />
2006 Oxford University, Mexican American Studies – The course of Mexican History 9-12<br />
2011-12 <strong>School</strong> Accountability Report Card for <strong>Godinez</strong> <strong>Fundamental</strong> <strong>High</strong> <strong>School</strong> Page 9 of 14
Note: Scores are not shown when the number of students tested is ten or<br />
less, either because the number of students in this category is too small<br />
for statistical accuracy or to protect student privacy.<br />
The Standardized Testing and Reporting (STAR) Program consists of<br />
several key components, including:<br />
• California Standards Tests (CSTs), which include Englishlanguage<br />
arts (ELA) and mathematics (Math) in grades two through<br />
eleven; science in grades five, eight, and nine through eleven; and<br />
history-social science (H-SS) in grades eight, and nine through<br />
eleven.<br />
• California Modified Assessment (CMA), an alternate<br />
assessment that is based on modified achievement standards in ELA<br />
for grades three through eleven; mathematics for grades three<br />
through seven, Algebra I, and Geometry; and science in grades five<br />
and eight, and Life Science in grade ten. The CMA is designed to<br />
assess those students whose disabilities preclude them from<br />
achieving grade-level proficiency on an assessment of the California<br />
content standards with or without accommodations.<br />
• California Alternate Performance Assessment (CAPA),<br />
includes ELA and mathematics in grades two through eleven, and<br />
science for grades five, eight, and ten. The CAPA is given to those<br />
students with significant cognitive disabilities whose disabilities<br />
prevent them from taking either the CSTs with accommodations or<br />
modifications or the CMA with accommodations.<br />
The assessments under the STAR Program show how well students are<br />
doing in relation to the state content standards. On each of these<br />
assessments, student scores are reported as performance levels.<br />
For detailed information regarding the STAR Program results for each<br />
grade and performance level, including the Percent of Students not<br />
tested, see the CDE STAR Results Web site at star.cde.ca.gov.<br />
Subject<br />
STAR Results for All Students - Three-Year Comparison<br />
Percent of Students Scoring at Proficient or Advanced<br />
<strong>School</strong> <strong>District</strong> State<br />
09-10 10-11 11-12 09-10 10-11 11-12 09-10 10-11 11-12<br />
ELA---- 54 54 53 40 43 45 52 54 56<br />
Math--- 27 30 39 43 47 48 48 50 51<br />
Science 43 55 63 40 44 48 54 57 60<br />
H-SS--- 51 53 55 34 37 40 44 48 49<br />
Internet Access<br />
Internet access is available at public libraries and other locations that are<br />
publicly accessible. Access to the Internet at libraries and public locations<br />
is generally provided on a first-come, first-served basis. Other use<br />
restrictions may include the hours of operation, the length of time that a<br />
workstation may be used (depending on availability), the types of<br />
software programs available on a workstation, and the ability to print<br />
documents.<br />
EdData Partnership Web Site<br />
EdData is a partnership of the CDE, EdSource, and the Fiscal Crisis<br />
Management and Assistance Team (FCMAT) that provides extensive<br />
financial, demographic, and performance information about California’s<br />
public kindergarten through grade twelve school districts and schools.<br />
Group<br />
2012 STAR Results by Student Group<br />
Percent of Students Scoring at<br />
Proficient or Advanced<br />
ELA Math Science H-SS<br />
All Students in the LEA 45 48 48 40<br />
All Student at the <strong>School</strong> 53 39 63 55<br />
Male------- 52 43 71 65<br />
Female------- 54 36 56 47<br />
Black or African American<br />
American Indian or Alaska Native<br />
Asian------- 88 78 91 82<br />
Filipino-------<br />
Hispanic or Latino 52 39 62 55<br />
Native Hawaiian/Pacific Islander<br />
White------- 71 47 55<br />
Two or More Races-------<br />
Socioeconomically Disadvantaged 52 39 62 55<br />
English Learners------- 16 17 28 15<br />
Students with Disabilities 31 28 21<br />
Students Receiving Migrant<br />
Education Services<br />
42 24 47<br />
California Physical Fitness Test Results<br />
The California Physical Fitness Test (PFT) is administered to students in<br />
grades five, seven, and nine only. This table displays by grade level the<br />
Percent of Students meeting the fitness standards for the most recent<br />
testing period. For detailed information regarding this test, and<br />
comparisons of a school’s test results to the district and state, see the<br />
CDE PFT webpage at www.cde.ca.gov/ta/tg/pf/.<br />
Grade<br />
Level<br />
Percent of Students Meeting Fitness Standards<br />
4 of 6 5 of 6 6 of 6<br />
---9--- 22.2 28.2 32.3<br />
DataQuest<br />
DataQuest is an online data tool located on the CDE DataQuest webpage<br />
at dq.cde.ca.gov/dataquest/ that contains additional information about<br />
this school and comparisons of the school to the district, the county, and<br />
the state. Specifically, DataQuest is a dynamic system that provides<br />
reports for accountability (e.g., state Academic Performance Index [API],<br />
federal Adequate Yearly Progress [AYP]), test data, enrollment, high<br />
school graduates, dropouts, course enrollments, staffing, and data<br />
regarding English learners.<br />
2011-12 <strong>School</strong> Accountability Report Card for <strong>Godinez</strong> <strong>Fundamental</strong> <strong>High</strong> <strong>School</strong> Page 10 of 14
Academic Performance Index<br />
The Academic Performance Index (API) is an annual measure of state<br />
academic performance and progress of schools in California. API scores<br />
range from 200 to 1,000, with a statewide target of 800. For detailed<br />
information about the API, see the CDE API webpage at<br />
www.cde.ca.gov/ta/ac/ap/.<br />
API Growth by Student Group – Three-Year Comparison<br />
Group<br />
Actual API Change<br />
09-10 10-11 11-12<br />
All Students at the <strong>School</strong> 2 11 10<br />
Black or African American<br />
American Indian or Alaska Native<br />
Asian-------<br />
Filipino-------<br />
Hispanic or Latino 1 12 10<br />
Native Hawaiian/Pacific Islander<br />
White-------<br />
Two or More Races<br />
Socioeconomically Disadvantaged 6 12 8<br />
English Learners -15 28 -17<br />
Students with Disabilities 18<br />
Academic Performance Index Ranks - Three-Year Comparison<br />
This table displays the school’s statewide and similar schools’ API ranks.<br />
The statewide API rank ranges from 1 to 10. A statewide rank of 1 means<br />
that the school has an API score in the lowest ten percent of all schools in<br />
the state, while a statewide rank of 10 means that the school has an API<br />
score in the highest ten percent of all schools in the state. The similar<br />
schools API rank reflects how a school compares to 100 statistically<br />
matched “similar schools.” A similar schools rank of 1 means that the<br />
school’s academic performance is comparable to the lowest performing<br />
ten schools of the 100 similar schools, while a similar schools rank of 10<br />
means that the school’s academic performance is better than at least 90<br />
of the 100 similar schools.<br />
Academic Performance Index Ranks - Three-Year Comparison<br />
API Rank 2009 2010 2011<br />
Statewide------- 8 8 8<br />
Similar <strong>School</strong>s------- 10 10 10<br />
Federal Intervention Program (<strong>School</strong> Year 2012-13)<br />
<strong>School</strong>s and districts receiving federal Title I funding enter Program<br />
Improvement (PI) if they do not make AYP for two consecutive years in<br />
the same content area (ELA or mathematics) or on the same indicator<br />
(API or graduation rate). After entering PI, schools and districts advance<br />
to the next level of intervention with each additional year that they do<br />
not make AYP. For detailed information about PI identification, see the<br />
CDE PI Status Determinations webpage:<br />
www.cde.ca.gov/ta/ac/ay/tidetermine.asp.<br />
Indicator <strong>School</strong> <strong>District</strong><br />
Program Improvement Status Not in PI In PI<br />
First Year of Program Improvement 2004-2005<br />
Year in Program Improvement Year 3<br />
Number of <strong>School</strong>s Currently in Program Improvement 41<br />
Percent of <strong>School</strong>s Currently in Program Improvement 68.3<br />
API Growth by Student Group - 2012 Growth API Comparison<br />
This table displays, by student group, the number of students included in<br />
the API and the 2012 Growth API (API-G) at the school, district, and state<br />
level.<br />
All Students<br />
at the <strong>School</strong><br />
Black or<br />
African American<br />
American Indian or<br />
Alaska Native<br />
Group <strong>School</strong> <strong>District</strong> State<br />
Students 1,998 38,884 4,664,264<br />
API-G 814 754 788<br />
Students 6 158 313,201<br />
API-G 803 710<br />
Students 1 29 31,606<br />
API-G 755 742<br />
Asian------- Students 31 936 404,670<br />
API-G 914 902 905<br />
Filipino------- Students 0 86 124,824<br />
Hispanic<br />
or Latino<br />
Native Hawaiian/<br />
Pacific Islander<br />
API-G 867 869<br />
Students 1,943 37,095 2,425,230<br />
API-G 812 748 740<br />
Students 0 40 26,563<br />
API-G 767 775<br />
White------- Students 17 421 1,221,860<br />
Two<br />
or More Races<br />
Socioeconomically<br />
Disadvantaged<br />
API-G 813 855 853<br />
Students 0 111 88,428<br />
API-G 850 849<br />
Students 1,816 36,094 2,779,680<br />
API-G 811 748 737<br />
English Learners Students 1,039 29,055 1,530,297<br />
Students<br />
with Disabilities<br />
API-G 737 719 716<br />
Students 116 3,982 530,935<br />
API-G 604 604 607<br />
Adequate Yearly Progress<br />
The federal ESEA requires that all schools and districts meet the following<br />
Adequate Yearly Progress (AYP) criteria:<br />
• Participation rate on the state’s standards-based assessments in ELA<br />
and mathematics<br />
• Percent proficient on the state’s standards-based assessments in<br />
ELA and mathematics<br />
• API as an additional indicator<br />
• Graduation rate (for secondary schools)<br />
Detailed information about AYP, can be found at the CDE Adequate<br />
Yearly Progress (AYP) webpage at www.cde.ca.gov/ta/ac/ay/.<br />
AYP Criteria <strong>School</strong> <strong>District</strong><br />
Made AYP Overall No No<br />
Met Participation Rate: English-Language Arts Yes Yes<br />
Met Participation Rate: Mathematics Yes Yes<br />
Met Percent Proficient: English-Language Arts No No<br />
Met Percent Proficient: Mathematics No No<br />
Met API Criteria Yes Yes<br />
Met Graduation Rate (if applicable) Yes Yes<br />
2011-12 <strong>School</strong> Accountability Report Card for <strong>Godinez</strong> <strong>Fundamental</strong> <strong>High</strong> <strong>School</strong> Page 11 of 14
Admission Requirements for California’s Public Universities<br />
University of California<br />
Admission requirements for the University of California (UC) follow<br />
guidelines set forth in the Master Plan, which requires that the top oneeighth<br />
of the state’s high school graduates, as well as those transfer<br />
students who have successfully completed specified college course work,<br />
be eligible for admission to the UC. These requirements are designed to<br />
ensure that all eligible students are adequately prepared for Universitylevel<br />
work.<br />
For general admissions requirements, please visit the UC Admissions<br />
Information webpage at www.universityofcalifornia.edu/admissions/.<br />
(Outside source)<br />
California State University<br />
Eligibility for admission to the California State University (CSU) is<br />
determined by three factors:<br />
• Specific high school courses<br />
• Grades in specified courses and test scores<br />
• Graduation from high school<br />
Some campuses have higher standards for particular majors or students<br />
who live outside the local campus area. Because of the number of<br />
students who apply, a few campuses have higher standards<br />
(supplementary admission criteria) for all applicants. Most CSU campuses<br />
have local admission guarantee policies for students who graduate or<br />
transfer from high schools and colleges that are historically served by a<br />
CSU campus in that region. For admission, application, and fee<br />
information see the CSU webpage at<br />
www.calstate.edu/admission/admission.shtml. (Outside source)<br />
Completion of <strong>High</strong> <strong>School</strong> Graduation Requirements<br />
This table displays, by student group, the Percent of Students who began<br />
the 2011-12 school year in grade twelve and were a part of the school’s<br />
most recent graduating class, meeting all state and local graduation<br />
requirements for grade twelve completion, including having passed both<br />
the ELA and mathematics portions of the CAHSEE or received a local<br />
waiver or state exemption.<br />
Completion of <strong>High</strong> <strong>School</strong> Graduation Requirements<br />
Group<br />
Graduating Class of 2012<br />
<strong>School</strong> <strong>District</strong> State<br />
All Students 100% 85% ---<br />
Black or African American * 74% ---<br />
American Indian or Alaska Native * ---<br />
Asian------- * 94% ---<br />
Filipino------- * * ---<br />
Hispanic or Latino 100% 85% ---<br />
Native Hawaiian/Pacific Islander * ---<br />
White------- * 87% ---<br />
Two or More Races ---<br />
Socioeconomically Disadvantaged 100% 86% ---<br />
English Learners 100% 62% ---<br />
Students with Disabilities 94% 53% ---<br />
Dropout Rate and Graduation Rate<br />
Indicator 2008-09 2009-10 2010-11<br />
Dropout Rate (1-year) 0.8 2.1 2.5<br />
Graduation Rate 97.11 97.13<br />
<strong>District</strong><br />
Dropout Rate (1-year) 3.5 12.5 13.1<br />
Graduation Rate 83.63 84.15 82.73<br />
Dropout Rate (1-year) 5.7 16.6 14.4<br />
Graduation Rate 78.59 80.53 76.26<br />
* The National Center for Education Statistics graduation rate as reported in<br />
AYP is provided in this table.<br />
California <strong>High</strong> <strong>School</strong> Exit Examination<br />
The California <strong>High</strong> <strong>School</strong> Exit Examination (CAHSEE) is primarily used as<br />
a graduation requirement. However, the grade ten results of this exam<br />
are also used to establish the percentages of students at three<br />
proficiency levels (not proficient, proficient, or advanced) in ELA and<br />
mathematics to compute AYP designations required by the federal ESEA,<br />
also known as NCLB. For detailed information regarding CAHSEE results,<br />
see the CDE CAHSEE Web site at cahsee.cde.ca.gov/.<br />
CAHSEE Results for All Students - Three-Year Comparison<br />
Percent of Students Scoring at Proficient or Advanced<br />
Subject 2009-10 2010-11 2011-12<br />
English-Language Arts 60 72 61<br />
Mathematics 67 76 76<br />
<strong>District</strong><br />
English-Language Arts 45 54 48<br />
Mathematics 51 56 58<br />
English-Language Arts 54 59 56<br />
Mathematics 54 56 58<br />
Advanced Placement Courses (<strong>School</strong> Year 2011–12)<br />
Subject<br />
Number of<br />
AP Courses<br />
Offered*<br />
Percent of<br />
Students In<br />
AP Courses<br />
Computer Science 0 ---<br />
English------- 7 ---<br />
Fine and Performing Arts 0 ---<br />
Foreign Language 7 ---<br />
Mathematics 4 ---<br />
Science------- 5 ---<br />
Social Science 11 ---<br />
All courses 34 6.8<br />
* Where there are student course enrollments.<br />
2011-12 <strong>School</strong> Accountability Report Card for <strong>Godinez</strong> <strong>Fundamental</strong> <strong>High</strong> <strong>School</strong> Page 12 of 14
California <strong>High</strong> <strong>School</strong> Exit Examination Grade Ten Results by Student Group - Most Recent Year<br />
Group<br />
English-Language Arts<br />
Mathematics<br />
Not Proficient Proficient Advanced Not Proficient Proficient Advanced<br />
All Students in the LEA 52 24 25 42 39 19<br />
All Students at the <strong>School</strong> 39 30 31 24 46 30<br />
Male------- 41 28 31 20 44 36<br />
Female------- 38 32 30 28 48 24<br />
Black or African American<br />
American Indian or Alaska Native<br />
Asian------- 17 8 75 8 25 67<br />
Filipino-------<br />
Hispanic or Latino 40 31 29 24 47 29<br />
Native Hawaiian/Pacific Islander<br />
White-------<br />
Two or More Races<br />
Socioeconomically Disadvantaged 41 29 30 25 46 29<br />
English Learners------- 84 15 1 56 41 4<br />
Students with Disabilities 92 8 0 68 32 0<br />
Students Receiving Migrant Education Services 50 33 17 17 58 25<br />
Career Technical Education Participation<br />
Measure<br />
CTE Program Participation<br />
Number of pupils participating in CTE 1,390<br />
Percent of pupils completing a CTE<br />
program and earning a high school<br />
diploma<br />
Percent of CTE courses sequenced/<br />
articulated between the school/<br />
institutions of postsecondary education<br />
95%<br />
64%<br />
Courses for University of California and/or California State University<br />
Admission<br />
UC/CSU Course Measure<br />
Percent<br />
2011-12 Students Enrolled in Courses Required for UC/CSU<br />
Admission<br />
2010-11 Graduates Who Completed All Courses Required for<br />
UC/CSU Admission<br />
79.1<br />
58.4<br />
2011-12 <strong>School</strong> Accountability Report Card for <strong>Godinez</strong> <strong>Fundamental</strong> <strong>High</strong> <strong>School</strong> Page 13 of 14
Career Technical Education Programs<br />
This section provides information about Career Technical Education (CTE) programs including:<br />
• Programs and classes offered that are specifically focused on career preparation and or preparation for work<br />
• How these programs and classes are integrated with academic courses and how they support academic achievement<br />
• How the school addresses the needs of all students in career preparation and/or preparation for work, including needs unique to defined special<br />
populations of students<br />
• The measurable outcomes of these programs and classes, and how they are evaluated<br />
• State the primary representative of the district’s CTE advisory committee and the industries represented on the committee<br />
Career Technical Education (CTE) is available to all high school students in the <strong>Santa</strong> <strong>Ana</strong> <strong>Unified</strong> <strong>School</strong> <strong>District</strong>. The CTE programs and classes offered<br />
are specifically focused on career preparation with the main goal of preparing students for the workforce of the 21st century. CTE includes districtsponsored<br />
CTE courses as well as Regional Occupational Program (ROP) courses that are aligned to state-adopted academic standards. The goals of the<br />
program are aligned with those of the Carl D. Perkins Career and Technical Education Improvement Act which focuses primarily on the improvement of<br />
career technical education programs, the integration and sequencing of courses, and most importantly serving special populations.<br />
CTE programs of study combine academic rigor and real world relevance. Some courses satisfy the A-G entrance requirements for the University of<br />
California (UC) and California State University (CSU) systems. Additionally, courses are articulated with colleges to establish a process for achieving<br />
dual credit as students attend high school courses and receive college credit at articulated schools. Furthermore, work-based learning opportunities<br />
are available for students to apply theories and skills learned in the classroom to an actual job situation further enhancing a real world experience.<br />
<strong>Godinez</strong> <strong>Fundamental</strong> <strong>High</strong> <strong>School</strong> provides a rigorous academic curriculum for college-bound students, yet the school also offers a number of ROP<br />
courses taught on campus. Some of these courses are offered during the regular school day while others are offered after the regular day ends.<br />
Currently, <strong>Godinez</strong> offers ROP courses in Computer Tech, Web Design, Sports Medicine, Photography, and Professional Dance on campus. Many<br />
students, however, are also enrolled in courses offered off campus. The Guidance Staff works closely with the students and parents to identify students<br />
who may benefit from these programs. As demand for other courses increases, <strong>Godinez</strong> will continue to add courses and programs which will benefit<br />
those students who are seeking immediately entry into the workforce after high school. The opportunity for students to participate in NJROTC also<br />
exists. Students interested in this program will take a 0 period that meets at Saddleback <strong>High</strong> <strong>School</strong> then be transported back to <strong>Godinez</strong>.<br />
2011-12 <strong>School</strong> Accountability Report Card for <strong>Godinez</strong> <strong>Fundamental</strong> <strong>High</strong> <strong>School</strong> Page 14 of 14