Lithium-ion batteries – The bubble bursts - Roland Berger
Lithium-ion batteries – The bubble bursts - Roland Berger
Lithium-ion batteries – The bubble bursts - Roland Berger

You also want an ePaper? Increase the reach of your titles
YUMPU automatically turns print PDFs into web optimized ePapers that Google loves.
<strong>Lithium</strong>-<strong>ion</strong> <strong>batteries</strong> –<br />
<strong>The</strong> <strong>bubble</strong> <strong>bursts</strong><br />
Stuttgart, October 2012<br />
Li-Ion-Batteries_Bubble_final_E.pptx<br />
1
SUMMARY<br />
Consolidat<strong>ion</strong> in the lithium-<strong>ion</strong> battery (LiB) market is inevitable –<br />
Stakeholders need to revise their strategies<br />
A<br />
B<br />
C<br />
Source: <strong>Roland</strong> <strong>Berger</strong><br />
<strong>The</strong> large-format lithium-<strong>ion</strong> cell market will face overcapacity and price wars:<br />
- Demand is lower than expected<br />
- A lot of capacity has been built up – but new equipment to be installed will be<br />
more efficient<br />
- Prices are down to 180 and 200 EUR/kWH in 2014/2015<br />
Bottom-up calculat<strong>ion</strong>s show that with an expected EBIT margin at or below 5%,<br />
"early movers" in particular cannot generate enough EBIT to finance their cost<br />
of capital<br />
New developments on the material side (mainly cathodes, electrolytes/separators)<br />
as well as in product<strong>ion</strong> technologies will lead to further cost reduct<strong>ion</strong>s – but<br />
require more cash for introduct<strong>ion</strong> and industrializat<strong>ion</strong><br />
<strong>The</strong>refore only the already large players or companies will survive the shakeout,<br />
as their parent companies might be willing to provide the business with sufficient<br />
capital<br />
That's why cell manufacturers as well as their customers – the OEMs – need to<br />
rethink their strategies<br />
Li-Ion-Batteries_Bubble_final_E.pptx<br />
2
A<br />
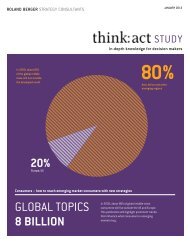
OEMs will increase xEVs sales significantly in the short term –<br />
Toyota will remain the main player<br />
Hybrid light HEV 1) BEV<br />
0.3<br />
2011<br />
1) FHEV, PHEV<br />
DEMAND<br />
OEMs xEV sales plans by xEV type [m units]<br />
Source: <strong>Roland</strong> <strong>Berger</strong><br />
25%<br />
0.8<br />
0.3<br />
80%<br />
17% 1.3<br />
2015<br />
1.1<br />
0.7<br />
2011<br />
38%<br />
2.6<br />
1.3<br />
2015<br />
OEMs excl. Toyota Toyota xx CAGR 2011-2015<br />
0.1<br />
2011<br />
0.6<br />
2015<br />
Comments<br />
• Figures are a<br />
summary of OEMs'<br />
sales targets for their<br />
xEV programs<br />
• <strong>The</strong>y do not include<br />
sub-A-segment<br />
vehicles (vehicles not<br />
classified as<br />
"passenger cars")<br />
• Sales targets tend to<br />
be on the optimistic<br />
side – but were not<br />
adjusted by <strong>Roland</strong><br />
<strong>Berger</strong><br />
Li-Ion-Batteries_Bubble_final_E.pptx<br />
3
A DEMAND<br />
However, in one 2020 scenario, xEVs will represent only a minor<br />
share of powertrains in EU, US and China – Introduct<strong>ion</strong> delayed<br />
Base scenario: xEV market share in the EU, US and China, 2020 [%]<br />
70%<br />
26%<br />
1% 2%<br />
0%<br />
Convent<strong>ion</strong>al incl. Start-Stop<br />
Hybrid Light<br />
Source: <strong>Roland</strong> <strong>Berger</strong><br />
95%<br />
0% 2%<br />
2% 0%<br />
FHEV<br />
PHEV<br />
BEV/RE<br />
1%<br />
97%<br />
1% 1%<br />
COMMENTS<br />
• Market share calculated based on an<br />
assessment of push (legislat<strong>ion</strong>-driven) and<br />
pull (customer-driven) factors for xEVs in the<br />
EU, US and China<br />
• <strong>The</strong> market shares shown represent the<br />
minimum required xEV share to meet push<br />
and pull in each reg<strong>ion</strong> – Higher xEV market<br />
shares are possible and even likely<br />
• <strong>The</strong> EU's xEV market share achieves the level<br />
required to meet EU CO 2 emiss<strong>ion</strong>s targets in<br />
an aggressive scenario regarding ICE<br />
optimizat<strong>ion</strong> and driving resistance reduct<strong>ion</strong><br />
• <strong>The</strong> US's and China's xEV market shares are<br />
primarily required to fulfill pull factors for xEVs<br />
• Further legislative act<strong>ion</strong> might increase share<br />
• Japanese/Korean figures expected to fall<br />
between the US and EU<br />
Li-Ion-Batteries_Bubble_final_E.pptx<br />
4
PUSH<br />
PULL<br />
A DEMAND<br />
<strong>The</strong> EU's xEV market is primarily legislat<strong>ion</strong>-driven – <strong>The</strong> US and<br />
China are driven primarily by customer pull<br />
Summary of push and pull factors for xEVs<br />
1 EU<br />
2 USA<br />
• Even under optimistic assumpt<strong>ion</strong>s<br />
regarding ICE improvements and light-<br />
weight measures, all OEMs will need<br />
xEVs to comply with 2020 CO 2<br />
emiss<strong>ion</strong>s targets<br />
• In terms of costs, hybrid light and<br />
PHEVs are most favorable<br />
• No TCO advantage for FHEV, PHEV or<br />
BEV powertrains<br />
• Hybrid lights will become neutral as<br />
regards TCO, but will provide addit<strong>ion</strong>al<br />
funct<strong>ion</strong>s<br />
• In larger-car segments, customers will<br />
be willing to pay more for higher<br />
performing hybrids<br />
• Only niche demand for BEVs<br />
Source: Interviews; <strong>Roland</strong> <strong>Berger</strong><br />
• CAFE emiss<strong>ion</strong>s targets can be met by<br />
utilizing ICE improvements and some<br />
weight reduct<strong>ion</strong> technology – OEMs<br />
also have no cost incentive to apply xEV<br />
technologies on a large scale<br />
• However, the ZEV mandate and the<br />
ability to earn credits will lead OEMs to<br />
build at least some PHEVs and EVs<br />
• No TCO advantage for xEV powertrains<br />
due to low fuel costs<br />
• However, some customers are willing to<br />
pay for xEVs for environmental image<br />
reasons<br />
3<br />
China<br />
• Technology penetrat<strong>ion</strong> is driven only by<br />
government targets for PHEVs and EVs<br />
• Fuel consumpt<strong>ion</strong> targets can be met by<br />
optimizing ICE in all segments<br />
• Fleet emiss<strong>ion</strong>s are possible, but there<br />
is no clear indicat<strong>ion</strong> yet<br />
• If fleet emiss<strong>ion</strong>s will be set, high xEV<br />
penetrat<strong>ion</strong> expected<br />
• Almost no customer pull for xEVs –<br />
except in luxury segment<br />
• Light and full hybrids would offer<br />
significant consumpt<strong>ion</strong> advantages, but<br />
TCO advantage is limited due to low<br />
cost of fuel<br />
• No willingness to pay for "green" image<br />
– in luxury segment, innovativeness of<br />
xEVs is an important purchase criteria<br />
Li-Ion-Batteries_Bubble_final_E.pptx<br />
5<br />
5
A DEMAND<br />
To meet CO 2 emiss<strong>ion</strong> targets, OEMs will mostly introduce xEV only<br />
according to the cost of CO 2 emiss<strong>ion</strong> reduct<strong>ion</strong>s in their fleet<br />
Assumpt<strong>ion</strong> for xEV usage at OEMs to comply with EU CO 2 emiss<strong>ion</strong> regulat<strong>ion</strong><br />
Gap between CO 2 fleet<br />
emiss<strong>ion</strong>s and CO 2 targets Usage of xEVs types to close the gap at OEMs 1)<br />
108<br />
101<br />
OEM<br />
2020 CO 2<br />
emiss<strong>ion</strong><br />
2020 CO 2<br />
emiss<strong>ion</strong><br />
target<br />
0<br />
1<br />
2<br />
3<br />
OEM will offer xEVs in segments to fulfill customer<br />
requirement and skim willingness to pay – Hybrid light<br />
in large/luxury cars and minor share in medium size<br />
cars, PHEVs in large/luxury cars, BEVs in mini/small<br />
cars<br />
Intensify usage of hybrid light in medium size and<br />
small cars and PHEV usage in larger cars<br />
Expand PHEV usage to medium size cars<br />
Increase EV penetrat<strong>ion</strong> in smaller cars and<br />
expand usage to medium size cars<br />
Cost of cutting CO 2<br />
emiss<strong>ion</strong>s 2)<br />
1) Based on interviews, validat<strong>ion</strong> with TCO calculat<strong>ion</strong>s<br />
2) Assessment is based on a calculat<strong>ion</strong> of xEV CO 2 emiss<strong>ion</strong> reduct<strong>ion</strong> potential, customer willingness to pay and cost (components and other cost)<br />
Source: Interviews; <strong>Roland</strong> <strong>Berger</strong><br />
0<br />
Li-Ion-Batteries_Bubble_final_E.pptx<br />
High<br />
6
A DEMAND<br />
Hybrid light will become at least TCO neutral – Buyers of large/<br />
luxury vehicles will be willing to pay for full hybrids and PHEVs<br />
Pull factors for xEVs Europe, 2020<br />
Vehicle<br />
size<br />
Luxury<br />
Large<br />
Medium<br />
Small<br />
Mini<br />
Light Full PHEV EV<br />
xEV type<br />
TCO neutral/advantage to best ICE-technology Willingness to pay Other reason<br />
Source: Interviews; <strong>Roland</strong> <strong>Berger</strong><br />
CO 2 emiss<strong>ion</strong>s limits<br />
in company car fleets<br />
Esp. sport cars<br />
COMMENTS<br />
• Assessment of TCO is<br />
based on a detailed<br />
calculat<strong>ion</strong> – taking into<br />
account necessary uplift<br />
of 200% on material<br />
cost for OEMs to<br />
maintain EBIT margin<br />
per vehicle<br />
• Willingness to pay in<br />
large and luxury segment<br />
is driven by social<br />
pressure to be environmental<br />
compliant and<br />
addit<strong>ion</strong>al funct<strong>ion</strong>s<br />
enabled by xEV powertrains<br />
(e.g. comfort startstop,<br />
idle AC)<br />
Li-Ion-Batteries_Bubble_final_E.pptx<br />
7
A DEMAND<br />
A significant share of powertrain electrificat<strong>ion</strong> are stop-start and<br />
micro-hybrid systems – but here, LiB are not competitive<br />
• Convent<strong>ion</strong>al starter <strong>batteries</strong> cannot be used effectively in start-stop and<br />
micro-hybrid applicat<strong>ion</strong>s due to poor cycle life and poor charge acceptance<br />
• Initially, most of the start-stop systems used a 2 battery approach in order to fulfill<br />
the requirements: 1 convent<strong>ion</strong>al starter battery (for starting only) plus 1 AGM<br />
battery for power supply. Problems are cost for 2 <strong>batteries</strong> and limited life of the<br />
AGM battery – <strong>Lithium</strong> Ion cell makers did expect a chance here<br />
• Recent developments in Lead-acid <strong>batteries</strong> (called Enhanced Flooded Battery )<br />
have now be presented and are likely to become a viable and cost effective<br />
solut<strong>ion</strong> for start-stop and micro-hybrid applicat<strong>ion</strong>s<br />
• Companies like JCI, Exide, Banner, Moll, Shin Kobe, GS-Yuasa and others will<br />
probably be able to offer Lead-based products that will meet start-stop and<br />
micro-hybrid requirements exceeding 200,000 km or 6 to 8 years of operat<strong>ion</strong><br />
at lower system costs than lithium-<strong>ion</strong> <strong>batteries</strong>.<br />
Source: Source: <strong>Roland</strong> <strong>Roland</strong> <strong>Berger</strong> <strong>Berger</strong><br />
Li-Ion-Batteries_Bubble_final_E.pptx<br />
8
B CELL ECONOMICS & TARGET PRICES<br />
Price levels around 200 EUR/kwH (approx USD 250) in 2015 do not<br />
provide sufficient EBIT to finance cost of capital<br />
Typical 96 Wh PHEV cell – Cell cost structure 2015<br />
Cell P&L breakdown, 2015 Cell material cost split, 2015<br />
Total cost: approximately USD 22.1/cell (~ 237 USD/kWh)<br />
Overheads<br />
SG&A<br />
10%<br />
Labour<br />
6%<br />
1%<br />
Energy/Utilities 0%<br />
18%<br />
D&A Equipment<br />
0%<br />
2%<br />
D&A Building<br />
Quality / Evironmental<br />
EBIT<br />
5%<br />
1) Including carbon black content, foil and binder cost<br />
Source: <strong>Roland</strong> <strong>Berger</strong> LiB Value Chain Cost model 2011<br />
58%<br />
Raw material<br />
~24%<br />
of total cell<br />
costs)<br />
USD 13.4/cell<br />
39%<br />
18%<br />
13%<br />
19%<br />
11%<br />
Material cost<br />
breakdown<br />
Cathode<br />
Anode<br />
Electrolyte<br />
Separator<br />
Housing and feed-througs<br />
Li-Ion-Batteries_Bubble_final_E.pptx<br />
9
B CELL ECONOMICS & TARGET PRICES<br />
Our calculat<strong>ion</strong> takes into account declining material prices–<br />
Driven by strong competit<strong>ion</strong> to capture market shares<br />
Impact on the cell manufacturing material prices (mid-term - 2015)<br />
Input<br />
materials<br />
CATHODE<br />
ANODE<br />
SEPARATOR<br />
ELECTROLYTE<br />
IMPACT FACTORS ON PRICES<br />
Raw material<br />
cost<br />
Process<br />
cost 1)<br />
Increasing the price Limited impact Decreasing the price<br />
1) Investment, energy, labor 2) Process cost reduct<strong>ion</strong> potential for LFP available<br />
Source: <strong>Roland</strong> <strong>Berger</strong> "Battery material cost study V.2.4 / Q1 2011"<br />
2)<br />
Standardizat<strong>ion</strong> Competit<strong>ion</strong>/<br />
capacities<br />
Overall strong price decrease<br />
Overall<br />
impact<br />
Price<br />
per kg<br />
2015<br />
• NMC 25 $<br />
• LMO 15 $<br />
• NCA 35 $<br />
• 18 $<br />
(50-50 mix)<br />
• Solut<strong>ion</strong>:<br />
20 $<br />
(LiPF6:25-30$)<br />
Li-Ion-Batteries_Bubble_final_E.pptx<br />
10
B CELL ECONOMICS & TARGET PRICES<br />
Material manufacturer need to improve their materials to drive<br />
down costs – resulting in addit<strong>ion</strong>al R&D demand on cell level<br />
Manufacturing cost calculat<strong>ion</strong> 2015 [USD/kg]<br />
TMC 1)<br />
[USD/<br />
kWh]<br />
~32.5 ~25.5 ~24.5 ~23.7 ~22.8 ~17.5 ~12.8 ~20.2 ~19<br />
10%<br />
10%<br />
73%<br />
LCO<br />
4%<br />
12%<br />
12%<br />
66%<br />
NCA<br />
4%<br />
13%<br />
13%<br />
2%<br />
64%<br />
NCM<br />
111<br />
13%<br />
13%<br />
63%<br />
NCM<br />
523<br />
4%<br />
14%<br />
14%<br />
2%<br />
62%<br />
NCM<br />
424<br />
49%<br />
LMO<br />
16%<br />
15%<br />
57%<br />
HCMA 3)<br />
17%<br />
16%<br />
54%<br />
HV<br />
spinel 4)<br />
~56.49 ~34.49 ~37.8 ~36.54 ~35.27 ~34.12 ~27.3 ~20.4 ~27.46<br />
7%<br />
7%<br />
21%<br />
22%<br />
2%<br />
40%<br />
LFP -<br />
FePO4<br />
8%<br />
5%<br />
15%<br />
20%<br />
3%<br />
5%<br />
2%<br />
5%<br />
5%<br />
2%<br />
Comment<br />
Quality/Environment Maintenance D&A Other D&A Equipment Energy/Utilities Labor<br />
1) Total manufacturing costs 2) High quality differences 3) not available until >2015 4) not available until 2020<br />
Source: <strong>Roland</strong> <strong>Berger</strong> LiB Value Chain Cost model 2011<br />
2)<br />
• According to latest analyst<br />
reports the prices of Nickel,<br />
Cobalt and Manganese will<br />
decline through 2015<br />
• Largely as a result thereof CAM<br />
material costs will decrease by<br />
between 7% and 22% between<br />
2011 and 2015<br />
• <strong>The</strong> costs of LFP will increase<br />
largely as a funct<strong>ion</strong> of higher<br />
energy and utility costs which<br />
account for 30% of total cost<br />
• If high-capacity materials<br />
(HCMA) is ready by 2015, this<br />
will offer a significant cost<br />
advantage over other CAMs due<br />
to higher energy density<br />
compounded by lower material<br />
cost<br />
Raw materials<br />
Li-Ion-Batteries_Bubble_final_E.pptx<br />
11
B CELL ECONOMICS & TARGET PRICES<br />
Declining cell prices will result in massive pressure on cell and CAM<br />
manufacturer margins - not enough to finance costs of capital<br />
Typical 96 Wh PHEV cell – Cell price breakdown 2015 [US $ / cell]<br />
Other<br />
materials 1)<br />
8.2<br />
Other<br />
CAM cost<br />
CAM<br />
margin<br />
Cell cost<br />
4.6<br />
Cathode<br />
material<br />
cost<br />
0.4<br />
CAM<br />
SG&A<br />
Margin pressure<br />
0.3<br />
CAM<br />
margin<br />
13.4<br />
Cell<br />
material<br />
cost<br />
4.3<br />
Cell<br />
D&A<br />
2.1<br />
Labor/<br />
utilities<br />
2.3<br />
Cell<br />
SG&A<br />
22.1<br />
Cell<br />
cost<br />
Cell<br />
margin<br />
1.2<br />
Cell<br />
margin<br />
Cell<br />
price<br />
23.3<br />
Cell<br />
Price<br />
1.3<br />
Market<br />
price<br />
• Any price decrease beyond 24 USD / cell (lower than EUR 200 / kWh) will<br />
have direct impact on CAM and cell manufacturer margins<br />
1) Anode, separator, electrolyte, housing 2) Expected market price based on expert interviews<br />
Source: <strong>Roland</strong> <strong>Berger</strong> LiB Value Chain Cost model 2011<br />
7.5% 6.0 %<br />
Delta<br />
Market<br />
price 2)<br />
22.0<br />
Market<br />
price<br />
Comment<br />
• For a typical CAM<br />
manufacturer<br />
– Raw materials account for<br />
up to 55% of total cost<br />
– D&A and utilities account<br />
for up to 25% of total cost<br />
• For a typical cell<br />
manufacturer<br />
– Raw materials account for<br />
up to 58% of total cost<br />
– D&A and utilities account<br />
for up to 19% of total cost<br />
• In view of their limited ability<br />
to offset sales price declines,<br />
CAM and cell manufacturers<br />
will compete over a shrinking<br />
profit pool<br />
Li-Ion-Batteries_Bubble_final_E.pptx<br />
12
B CELL ECONOMICS & TARGET PRICES<br />
To significantly reduce cell costs beyond 2015, major innovat<strong>ion</strong>s<br />
in CAM technology and introduct<strong>ion</strong> of new CAMs are necessary<br />
Typical 96 Wh PHEV cell – Impact of material improvements on cell prices<br />
(cost for Auto. customers)<br />
NCM cell<br />
2015<br />
(230<br />
USD/kWh<br />
22.1<br />
5.2<br />
16.9<br />
NMC<br />
cell cost<br />
2015<br />
CAM cost share<br />
0.4<br />
Manu-<br />
facturing<br />
Innovat<strong>ion</strong> pressure<br />
Cost reduct<strong>ion</strong> NCM cell 2015 – 2020<br />
-6%<br />
1.0<br />
Energy<br />
density 1)<br />
0.1<br />
Labor<br />
NCM cell<br />
2020<br />
20.8<br />
4.3<br />
16.5<br />
NMC<br />
cell cost<br />
2020<br />
Potential cost<br />
reduct<strong>ion</strong> HCMA<br />
-10%<br />
0.9<br />
HCMA<br />
19.9<br />
3.4<br />
16.5<br />
HCMA<br />
cell cost<br />
2020<br />
• Unless HCMA material is introduced, further price reduct<strong>ion</strong> potential of CAM materials is<br />
limited and margins remain at unacceptable level<br />
• Also cell manufacturer need (and will) improve processes and yield rate<br />
1) Based on a high-density 50-50 mixture of NCM 111 and LiNiO 2<br />
Source: Industry reports, experts interview, <strong>Roland</strong> <strong>Berger</strong> analysis<br />
HCMA cell<br />
2020<br />
204<br />
USD/kWh<br />
Comment<br />
• Const. cell energy (at 96 Wh)<br />
assumed<br />
• In 2016 introduct<strong>ion</strong> of higher<br />
density NCM CAM, resulting<br />
in:specific cell energy increase<br />
to141 Wh/kg and concurrent<br />
reduct<strong>ion</strong> in NCM usage to 113 g<br />
• In 2018 introduct<strong>ion</strong> of high-density<br />
HCMA CAM: further increases<br />
specific cell energy to 144 Wh/kg<br />
with HCMA usage to 100 g<br />
• HCMA price includes a license fee<br />
of 2%<br />
• No changes in anode, separator<br />
and electrolyte cost assumed in<br />
figure:<br />
add. potential 10..20$ /kWh<br />
• Add. cell manufacturing process<br />
improvement: potential ca. 10..15$<br />
/ kWh<br />
• Cell price forecast 2018..2020:<br />
200$ / kWh (incl. approx. 15%<br />
margin for both CAM and cell<br />
manuf.)<br />
Li-Ion-Batteries_Bubble_final_E.pptx<br />
13<br />
13
C IMPLICATIONS<br />
<strong>The</strong> value chain is therefore expected to further consolidate (1/2)<br />
Raw materials<br />
<strong>Lithium</strong><br />
mining<br />
Anodes,<br />
Cathodes,<br />
Separators,<br />
Electrolytes<br />
and<br />
Precursors<br />
Source: <strong>Roland</strong> <strong>Berger</strong><br />
TODAY (2012)<br />
> Oligopoly<br />
> Dominated by Asian<br />
(Jap.) players<br />
> Partially specialized<br />
precursors sourced<br />
> Some cathode<br />
materials<br />
manufactured by<br />
cell manufacturer<br />
CHANGES BY 2020<br />
> Some selected new players<br />
> New recycling companies<br />
> Business models integrating recycling<br />
> New players (from specialty chemical<br />
sector ) especially for Automotive and<br />
ESS<br />
> More integrat<strong>ion</strong> of precursor<br />
manufacturer<br />
> Cathode manufacturing by cell<br />
manufacturer only for top 2..3 with<br />
large chemical business<br />
Li-Ion-Batteries_Bubble_final_E.pptx<br />
14
C IMPLICATIONS<br />
<strong>The</strong> value chain is expected to further consolidate (2/2)<br />
Battery cells /<br />
stacks<br />
("LiB manuf.")<br />
Battery<br />
assembly<br />
Source: <strong>Roland</strong> <strong>Berger</strong><br />
TODAY (2012)<br />
> Some JVs<br />
disintegrating<br />
> Established players<br />
gaining share,<br />
research spin-offs<br />
with public & IPO<br />
funding leaving the<br />
market<br />
CHANGES BY 2020<br />
> Massive consolidat<strong>ion</strong> (cost<br />
pressure, innovat<strong>ion</strong>)<br />
> Auto-Cell manuf. JV's as exempt<strong>ion</strong><br />
> Mainly by OEMs (JVs > Increased outsourcing, but still<br />
LiB) inhouse dominated by in-house assembly<br />
> Selected supplier – > Some cell manufacturers try to deliver<br />
LiB JVs<br />
larger part of system (incl. electronics)<br />
> Limited LiB alone as Tier-1<br />
Li-Ion-Batteries_Bubble_final_E.pptx<br />
15
Li-Ion-Batteries_Bubble_final_E.pptx<br />
16